Scenario
Your team would like to be able to put up a near real-time display of the DHCP service status on a screen. You know that both Grid Members ibns1 and ibns2 are running DHCP. Please create a Status Dashboard in NIOS that displays DHCP service and system information for both members.
Estimate Completion Time
-
10 to 15 minutes
Credentials
|
Description |
Username |
Password |
URL or IP |
|---|---|---|---|
|
Grid Manager UI |
ops |
infoblox |
Requirements
-
Read-only access to Grid
-
Read-write access to Dashboard
Learning Content
Lab Initiation
Access jump-desktop
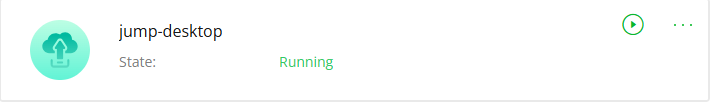
Once the lab is deployed, you can access the virtual machines required for this activity. To begin, select VM List from the navigation bar at the top, locate jump-desktop, and click the green play icon to open its console. Log in to the Linux UI.
Username: training
Password: infoblox
Initiate lab
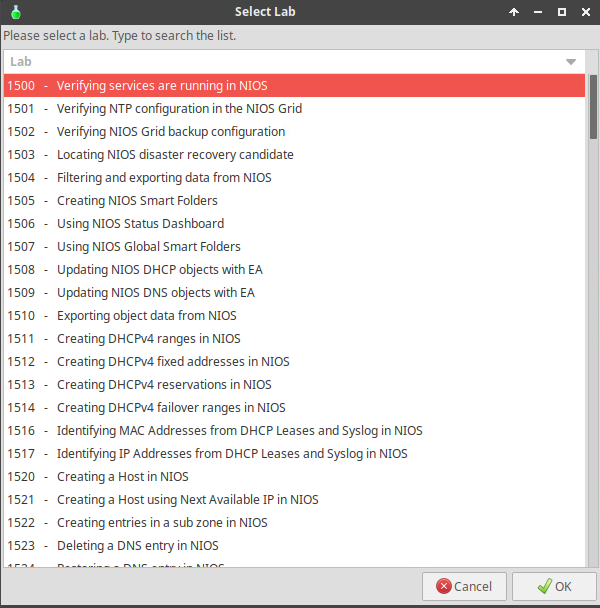
To initiate the lab, double-click the Launch Lab icon on the Desktop.

Choose the lab number from the list and click OK.
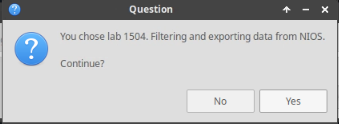
After clicking OK, you will see a pop-up message with a brief description of the lab task. If the description looks correct, click Yes to continue lab initiation.
Lab initiation will take a couple of minutes to finish.
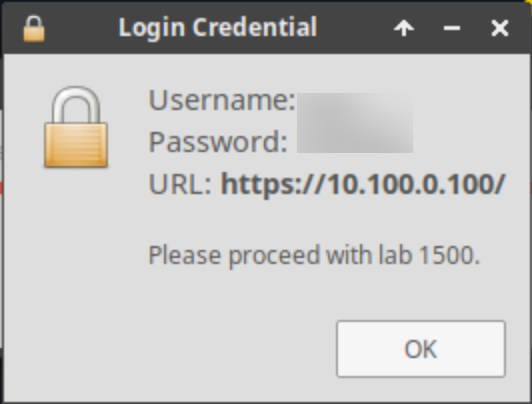
Once complete, you will see another pop-up message with the login credentials and the URL for the Grid Manager’s User Interface. Note that the credentials may differ from those from prior labs.
Tasks
Task 1: Creating a Status Dashboard and adding contents
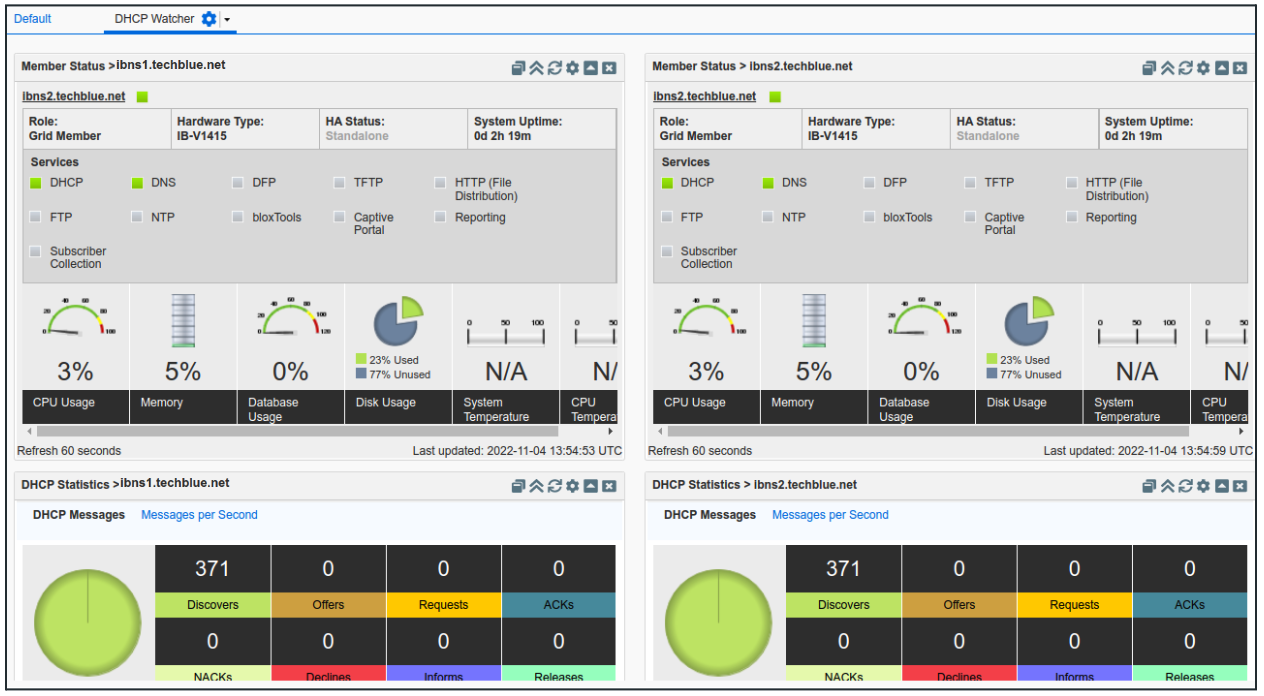
Login to the GM web interface. Create a new Status Dashboard named DHCP Watcher. In the new dashboard, add the content DHCP Statistics and Member Status for both members ibns1 and ibns2. To receive near real-time updates be sure to enable auto-refresh. The result should have four (4) widgets displayed on the screen, clearly showing the DHCP service statistics (such as number of requests) and System Status (such as CPU and memory usage).
Solutions
Task 1 Solution: Creating a Status Dashboard and adding contents
Login to the GM web interface and examine the service status of the member ibns2.techblue.net visually.
-
Login to NIOS GM web interface
-
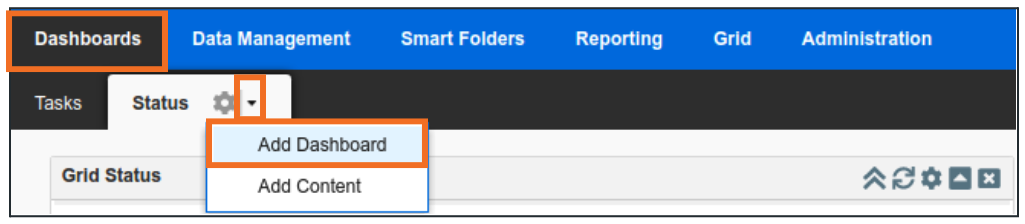
Navigate to Dashboard → Status
-
Click on the dropdown next to the gear icon and select Add Dashboard
-
Name the Dashboard DHCP Watcher and click Save and Close
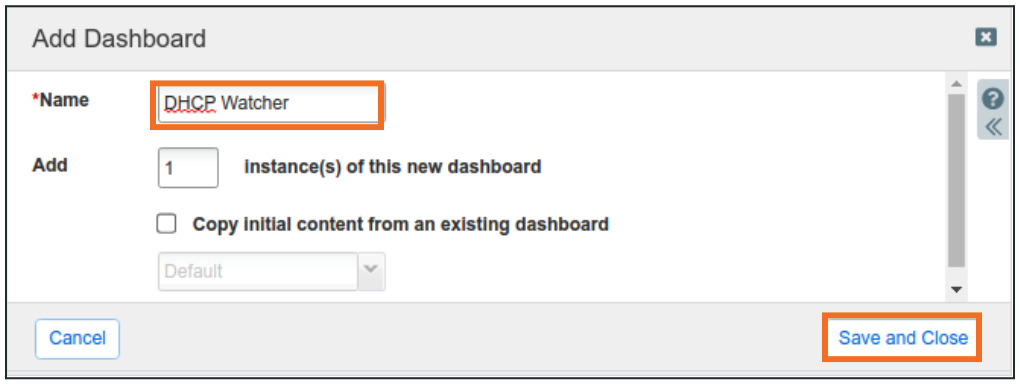
-
A new blank Dashboard is created
-
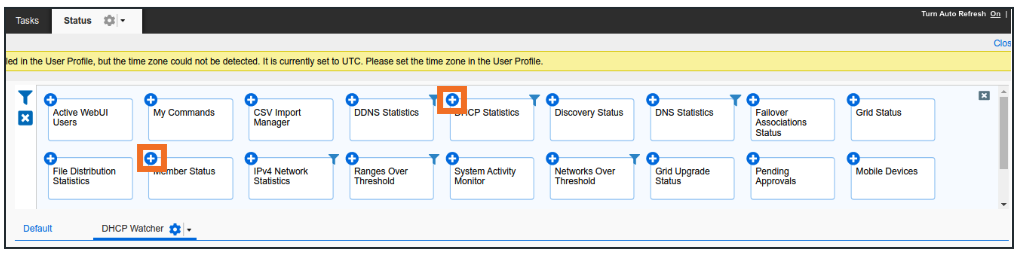
Click on the dropdown button next to the Dashboard name and choose Add Content
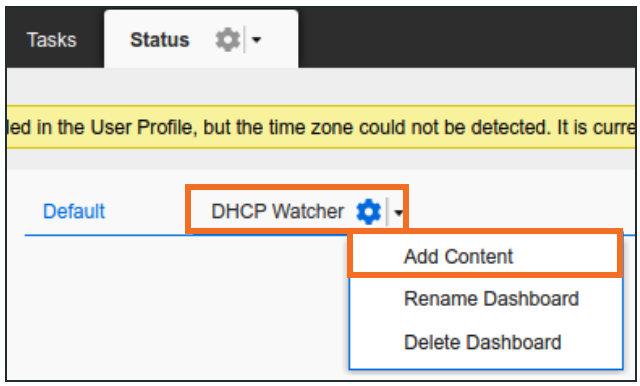
-
From the content list, add Member Status and DHCP Statistics by dragging them into the Dashboard or by clicking the +
-
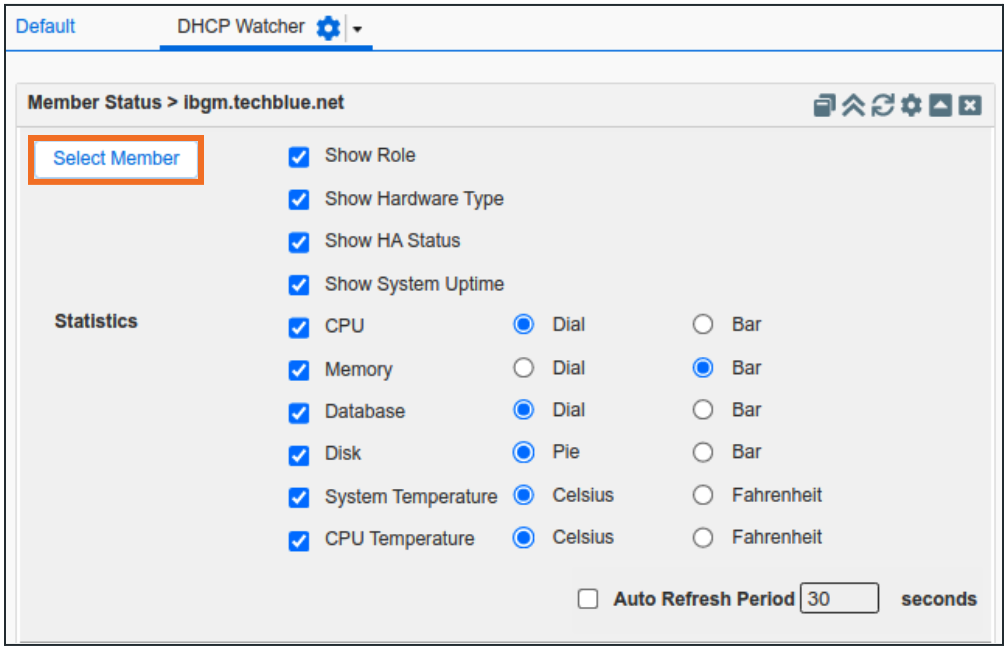
The Widget will default to displaying GM information. Change the member by clicking on Select Member
-
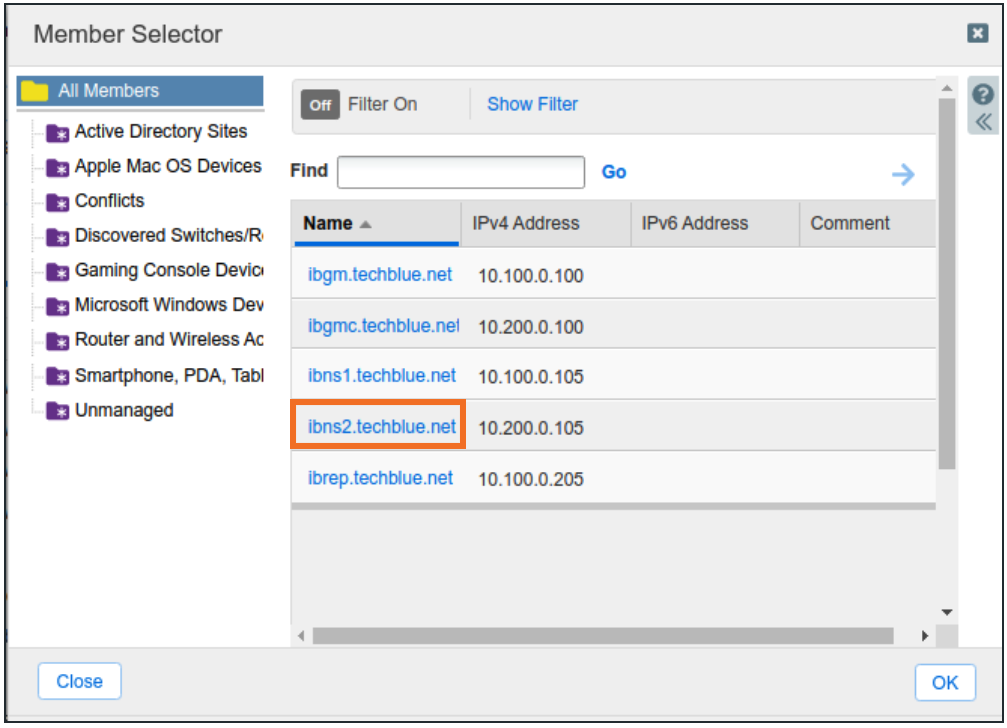
Choose ibns2.techblue.net from the list
-
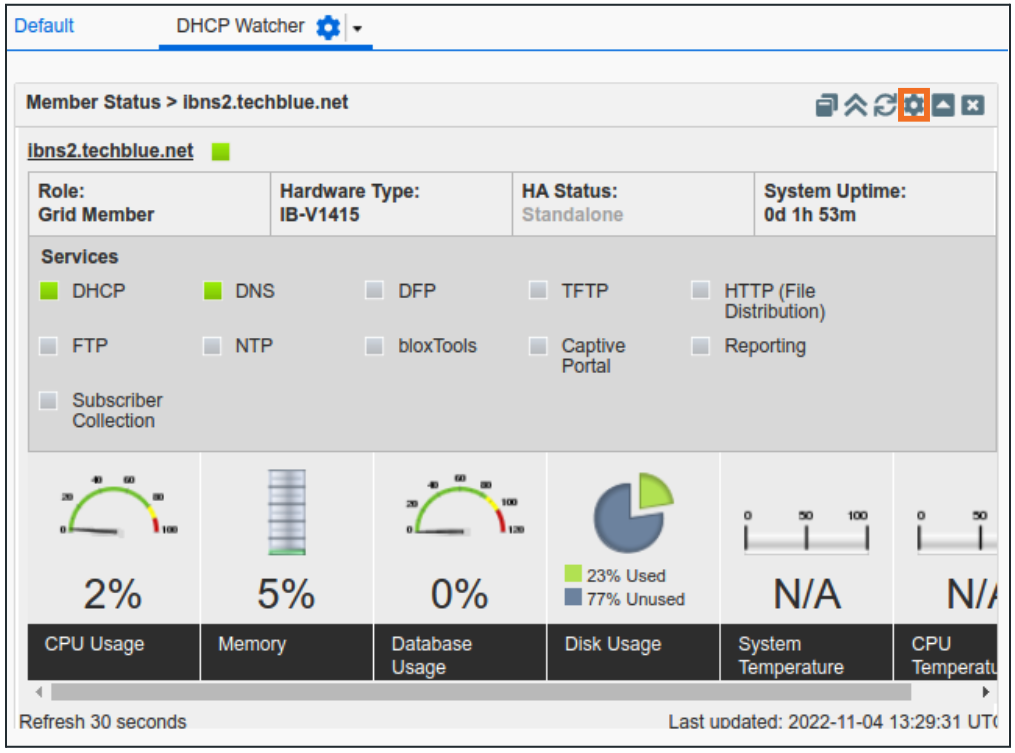
If the configure option is not available, click on the gear icon at the top right of the widget
-
Set Auto Refresh Period to 60 seconds and check the box
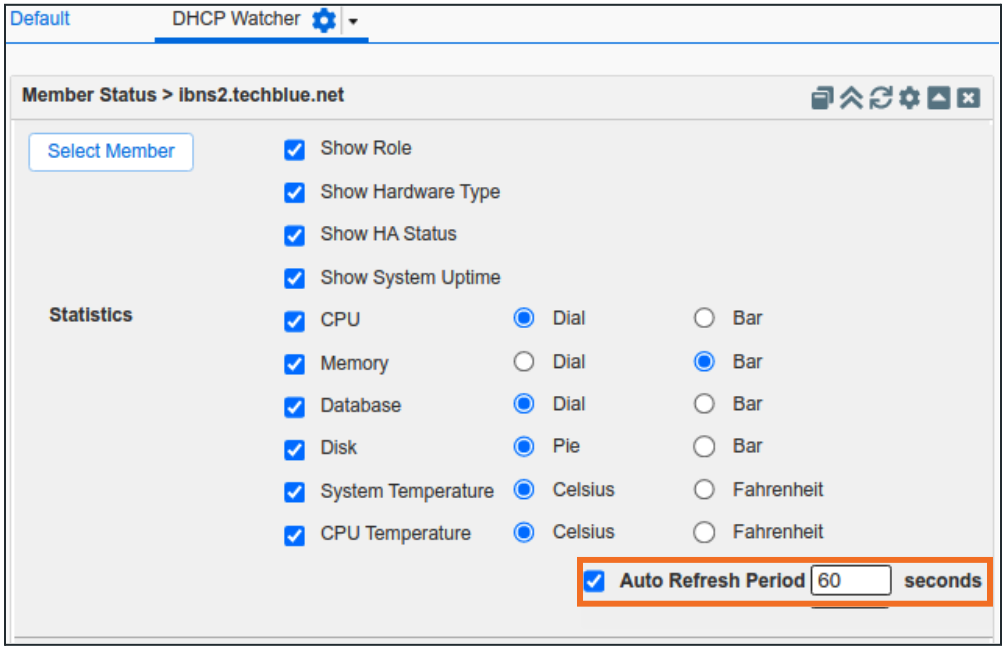
-
Repeat the steps for DHCP Statistics
-
Add the same widgets again for ibns1.techblue.net
-
The resulting Dashboard should look like the below image (numbers will vary)