This lab requires a NIOS 9.0 Lab Environment
This lab guide has been developed using the new NIOS 9.0 Lab Environment. Please ensure that you deploy a NIOS 9.0 lab environment to complete these lab tasks. If you use a different lab environment, this is untested, and the lab likely will not work.
Scenario
As part of the corporate security policy, you are tasked with identifying potentially compromised clients and reviewing recent DNS security events. Using the Security Dashboard and Reporting Server, you analyze RPZ hits, verify the status of name servers and RPZ feeds, and identify affected clients. You then create a search for hits on the infoblox-base.rpz.infoblox.local feed, add it to a custom dashboard, generate a report, and configure an alert that sends an email to noc@techblue.net when new hits are detected.
Estimate Completion Time
-
45 to 55 minutes
Credentials
|
Description |
Username |
Password |
URL or IP |
|---|---|---|---|
|
Grid Manager UI |
admin |
infoblox |
Lab Initiation
Access jump-desktop
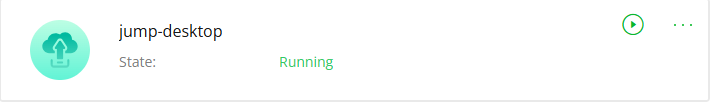
Once the lab is deployed, you can access the virtual machines required for this activity. To begin, select VM List from the navigation bar at the top, locate jump-desktop, and click the green play icon to open its console. Log in to the Linux UI.
Username: training
Password: infoblox
Initiate lab
To initiate the lab, double-click the Launch Lab icon on the Desktop.

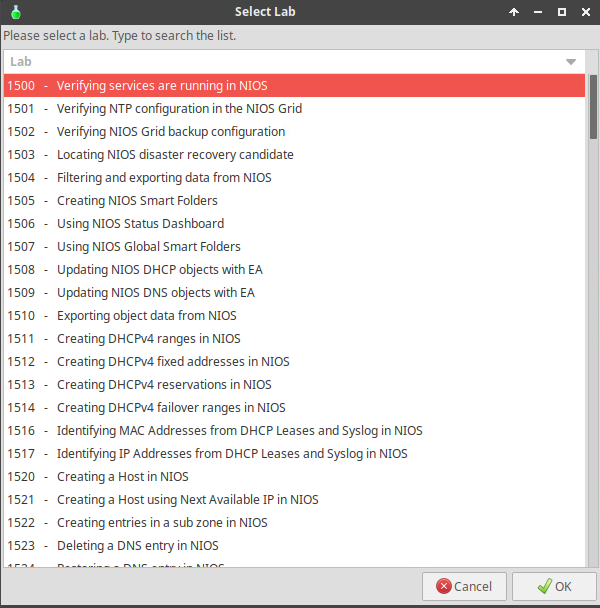
Choose the lab number from the list and click OK.
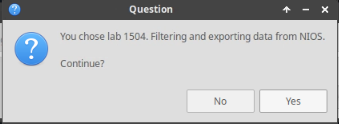
After clicking OK, you will see a pop-up message with a brief description of the lab task. If the description looks correct, click Yes to continue lab initiation.
Lab initiation will take a couple of minutes to finish.
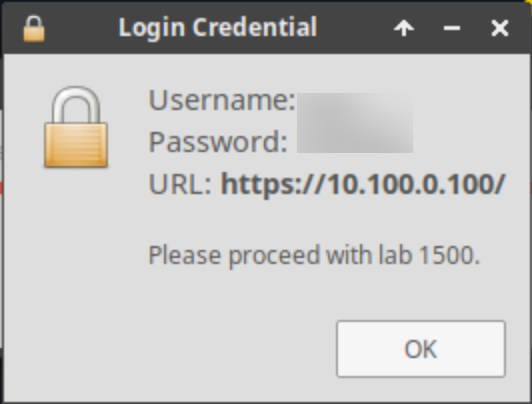
Once complete, you will see another pop-up message with the login credentials and the URL for the Grid Manager’s User Interface. Note that the credentials may differ from those from prior labs.
Tasks
-
Analyze the Security Dashboard Widgets
-
Investigate the available Reporting Server Dashboards to identify DNS Top RPZ Hits
-
Create a new Dashboard called DDI Security Dashboard
-
Create a DDI Security Dashboard Panel and a Report based on RPZ Hits
-
Create an Email Alert triggered by RPZ Hits
Task 1: Analyze the Grid Status and Health using Security Dashboard Widgets
-
View the RPZ Recent Hits in the Security Dashboard to identify clients that are causing many RPZ hits.
-
Use the Security Dashboard to confirm the status of the Grid name servers, ibns1.techblue.net and ibns2.techblue.net
-
Investigate the peak time when the most RPZ hits occur
Task 2: Investigate the available Reporting Server Dashboards to identify DNS Top RPZ Hits
If the reporting server needs to be configured, use the following instructions to set it up:
-
Click Continue to the app setup page
-
Username: training
-
Password: infoblox
-
Protocol: SCP
-
Host/ IP Address: 10.100.0.205
-
Port: 22
-
Path: /home/training/Documents/ReportingData
-
Please allow 25 to 30 minutes for the Reporting Server to pull data off the Grid and populate its Dashboards and Reports. This waiting time is only required for this simulated lab environment, as the Grid and the Reporting Server haven’t had enough time to sync.
-
Use the Reporting Server to provide information about RPZ Hits
Task 3: Create a new Dashboard called DDI Security Dashboard
-
Create a new dashboard using XML source from the Infoblox Community.
-
This Dashboard provides a good visual representation of DDI Security and will be popular with less technical senior staff.
-
The XML is stored in the Reporting - DNS Firewall Dashboard.xml file in the
Shared Drive/NIOS Importsfolder on jump-desktop.
-
Task 4: Create a DDI Security Dashboard Panel and a Report based on RPZ Hits
-
Create a search for RPZ Hits. The Search is saved as a Dashboard Panel on the new DDI Security Dashboard.
-
Use the previously created Search to create a report called infoblox-base RPZ Hits.
Task 5: Create an Email Alert triggered by RPZ Hits
-
Create an Alert for hits on the Base RPZ. When the Alert triggers, an email is sent to noc@techblue.net.
Solutions
Task 1 Solution: Analyze the Grid Status and Health using Security Dashboard Widgets
In this task, you are trying to investigate the recent spike in RPZ hits using the NIOS Dashboard; you will view the RPZ Recent Hits in the Security Dashboard to identify clients causing a large number of RPZ hits, use Threat Lookup to investigate domain names that appear in the RPZ hits and may pose potential threats, confirm the status of the Grid name servers ibns1.techblue.net and ibns2.techblue.net using the Security Dashboard, and investigate the peak times when the most RPZ hits occur.
-
On the jump-desktop machine, open a browser window to https:/10.100.0.100.
-
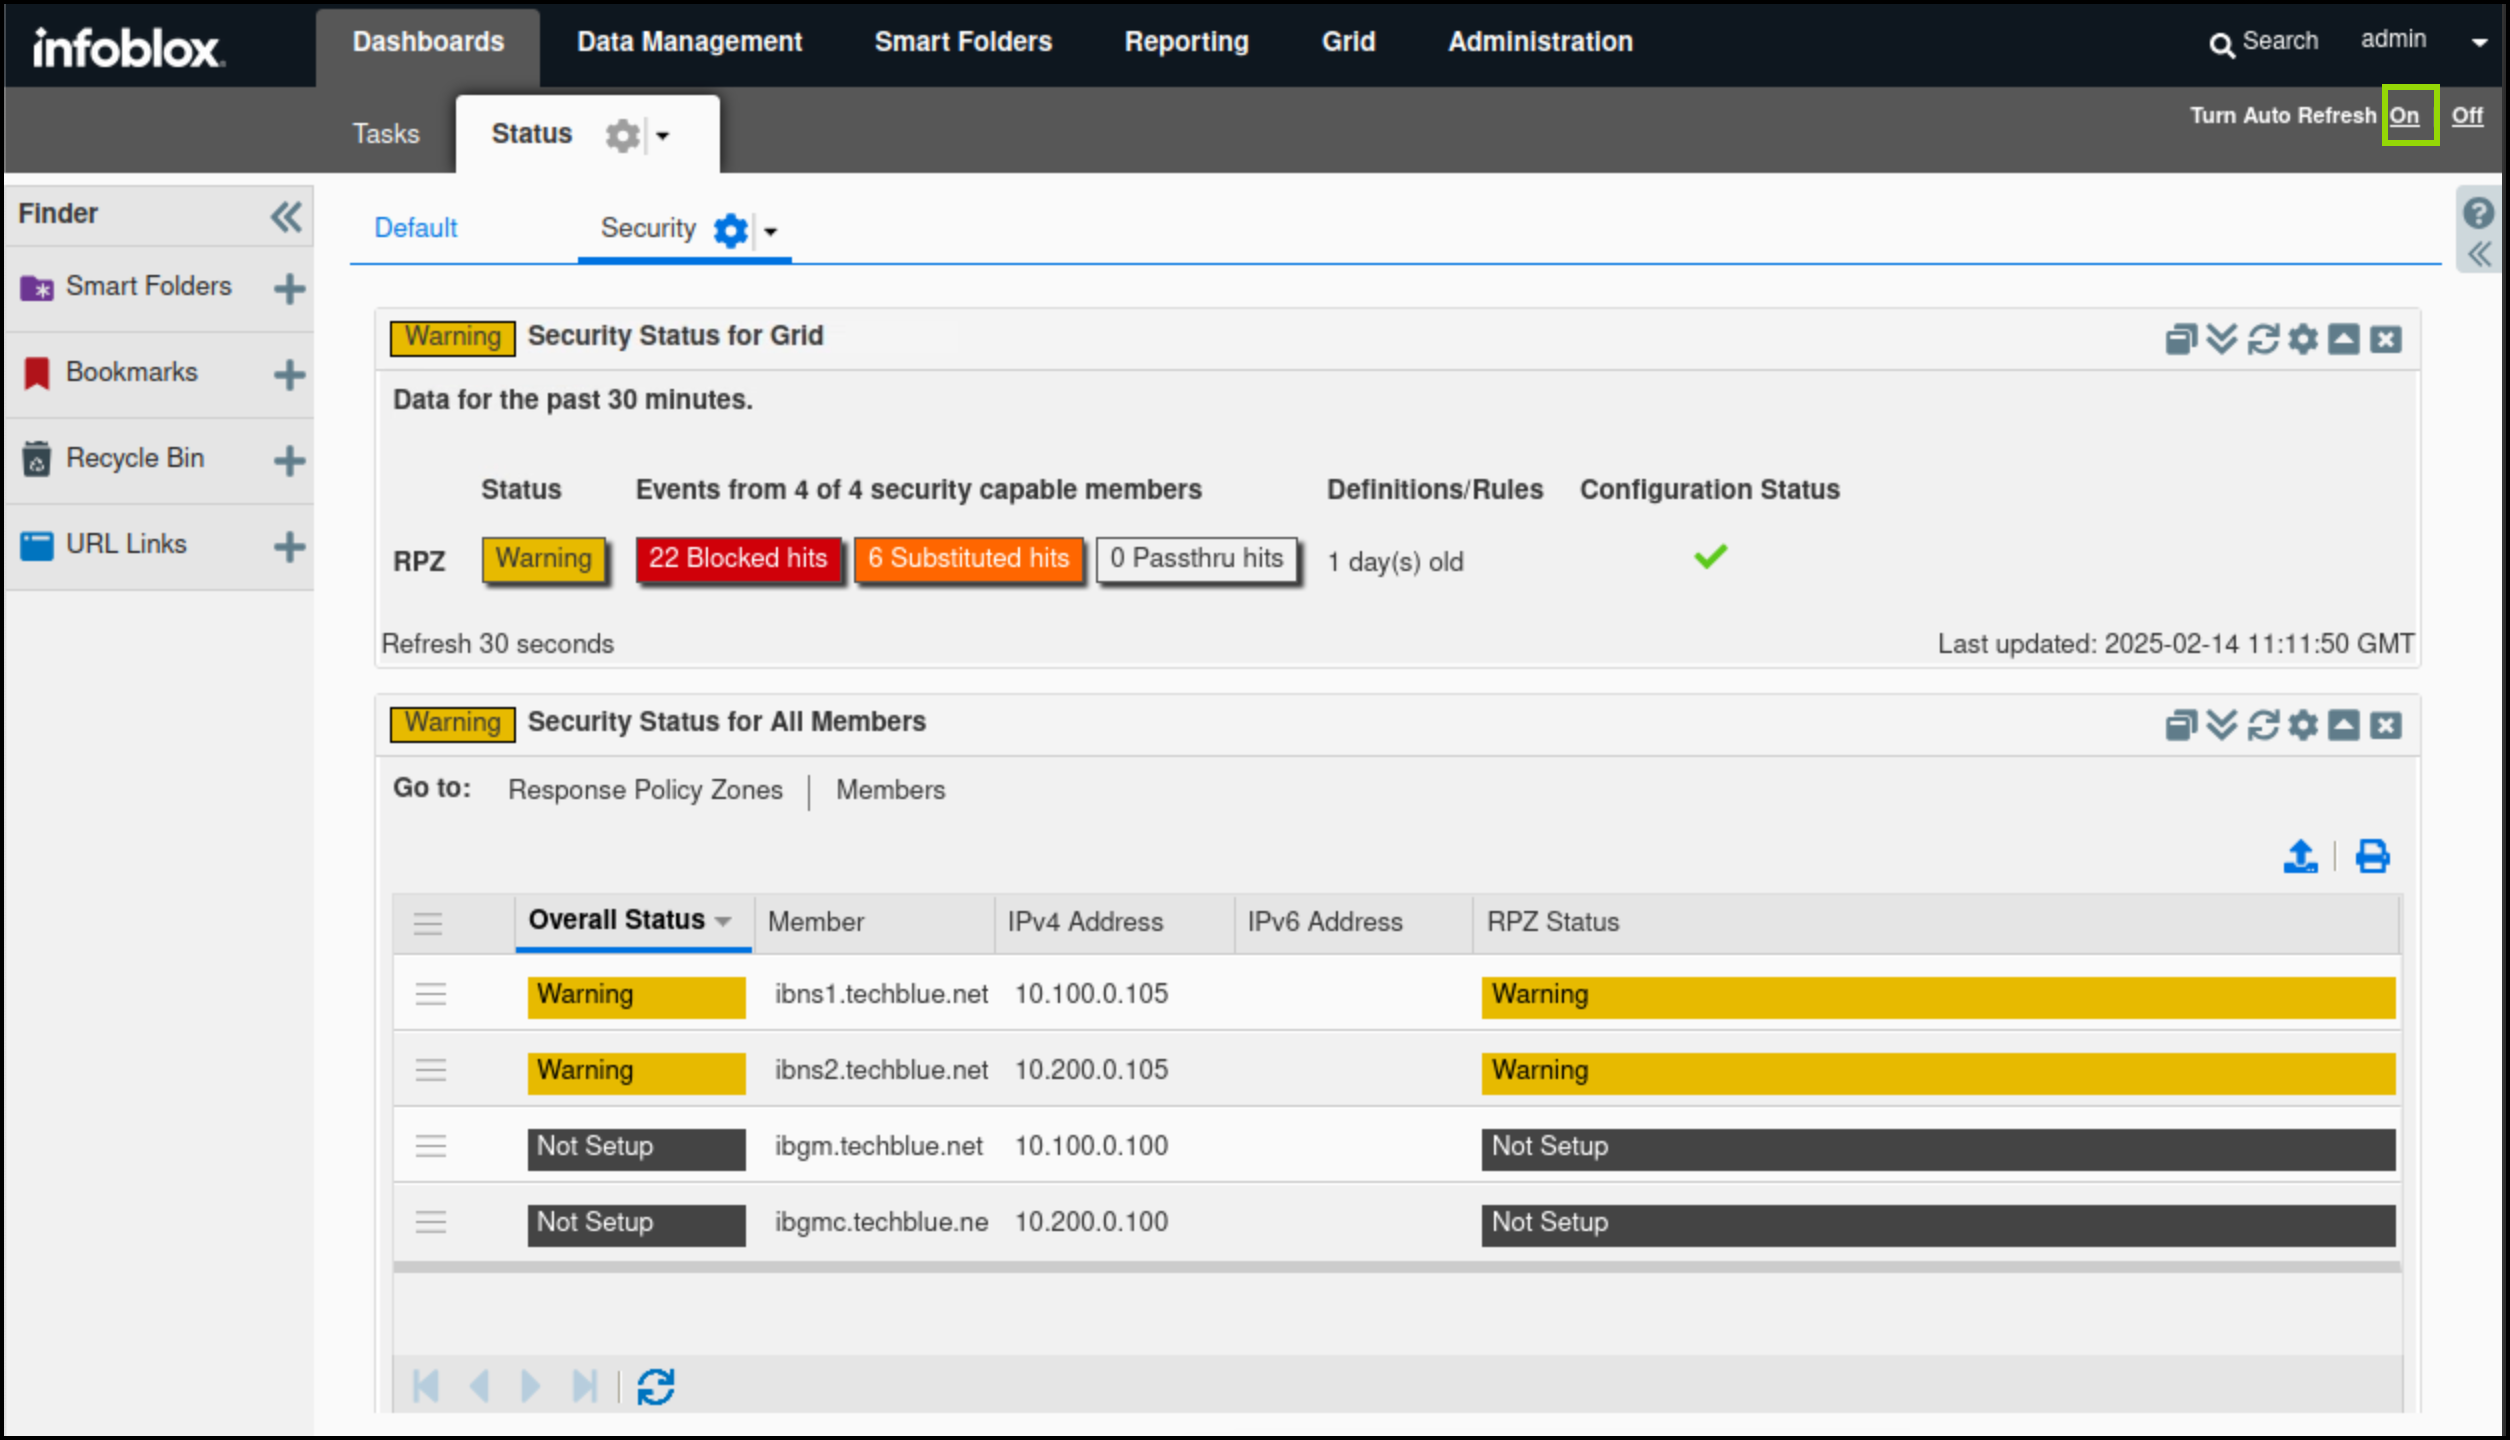
Navigate to Dashboards → Status → Security.
-
Turn on auto-refresh for the security Dashboard.
-
Find the Security Status for Grid widget.
-
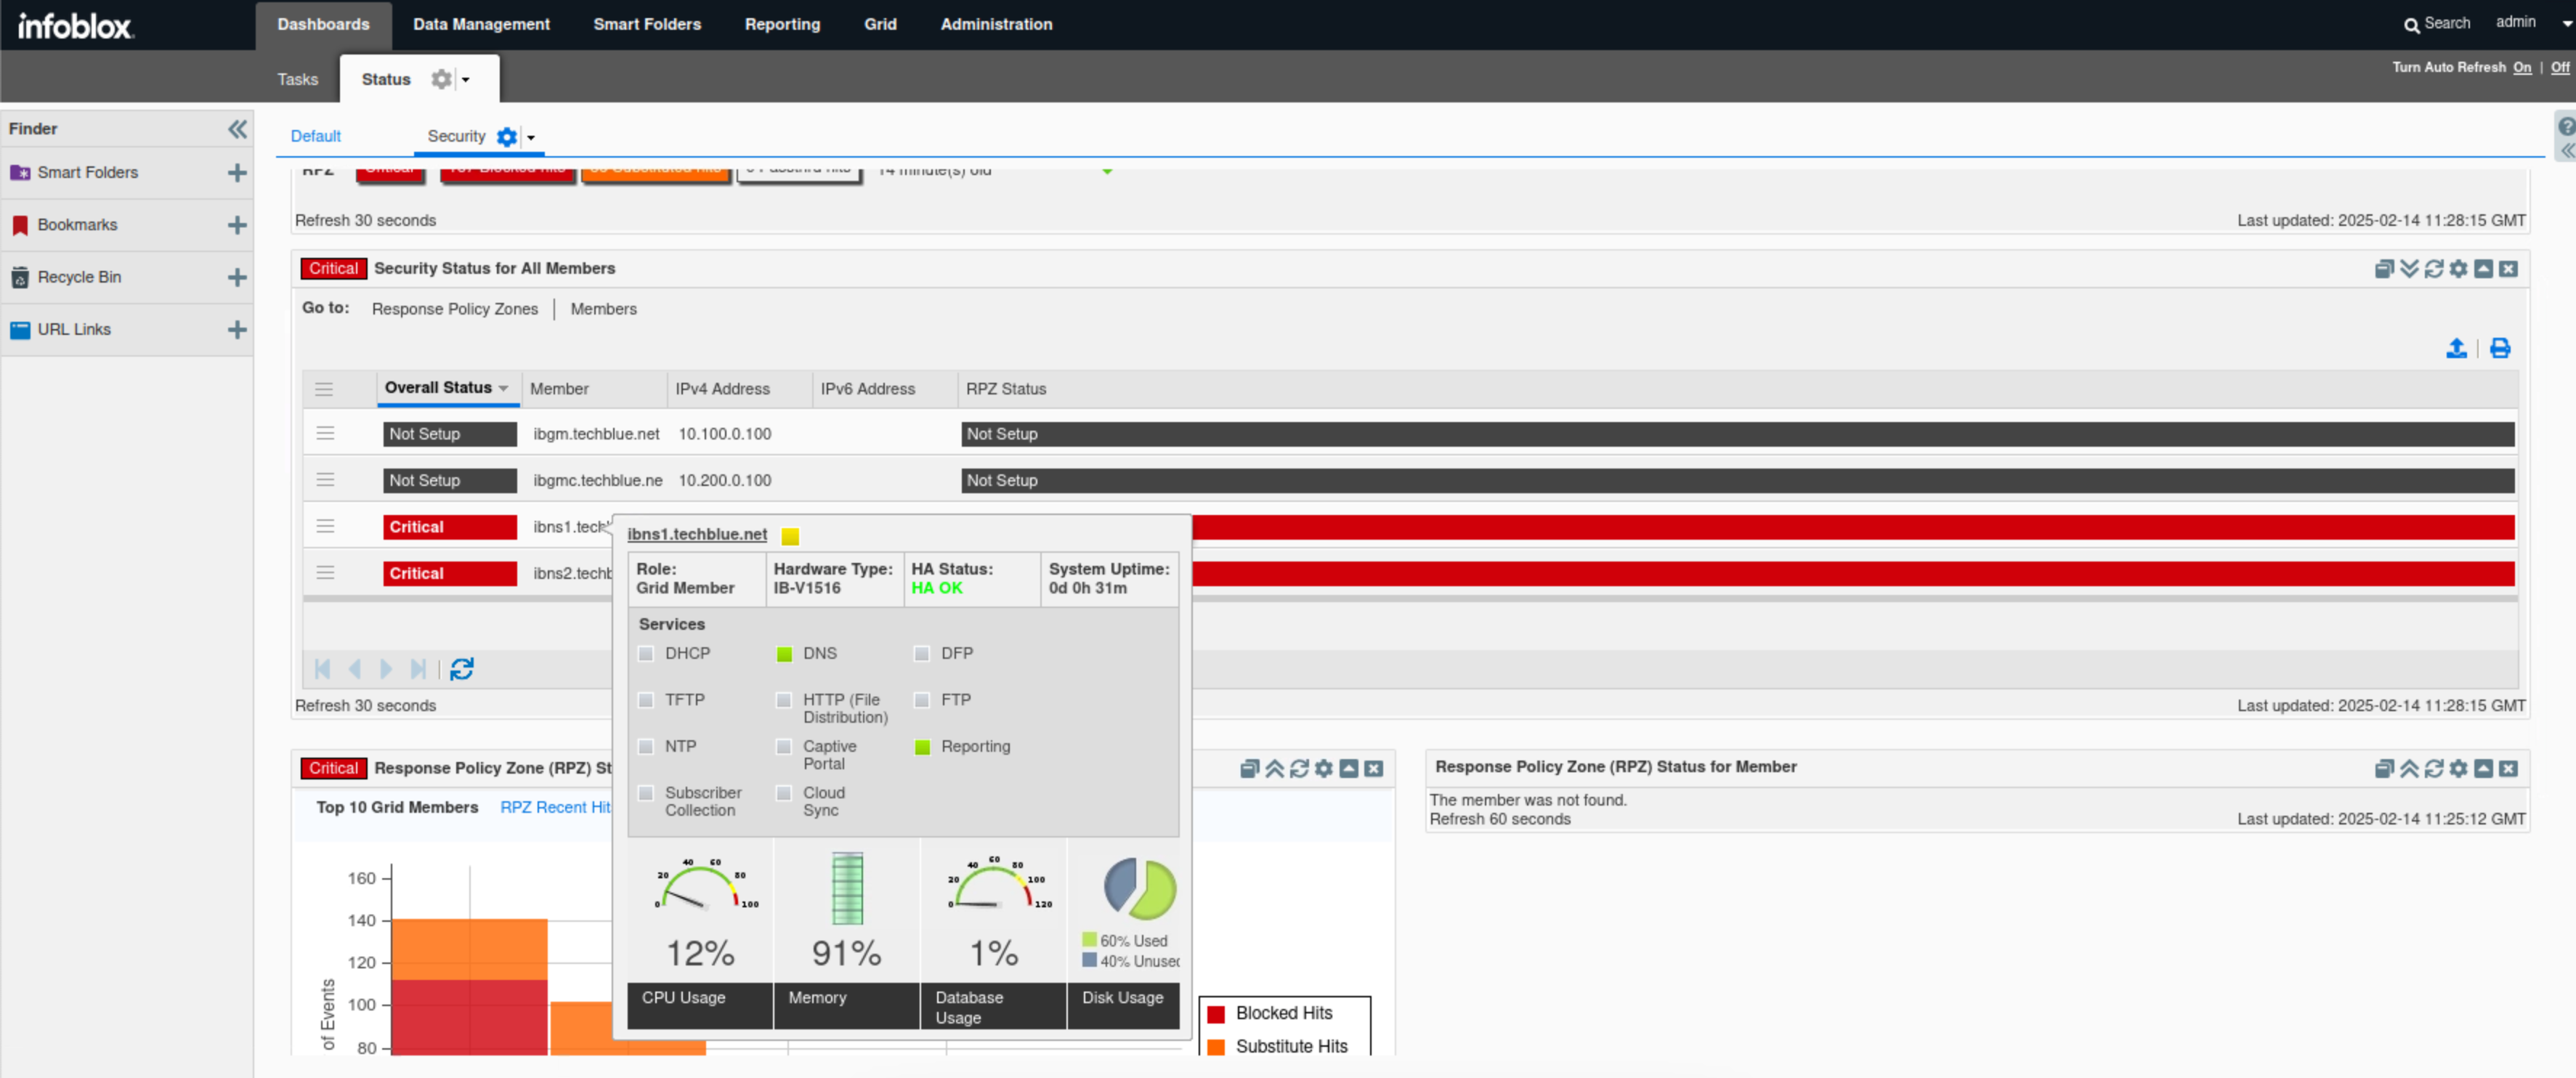
The widget displays high-level information about the Grid sec’s security status separately.
-
In this example, Both ibns1.techlblue.net and ibns2.techblue.net are in a critical state, by hovering over each member name in the widget we can view that member’s status and by hovering over the RPZ status bar we can view detailed security information such as RPZ hit sources, Trends and triggered RPZs.
-
-
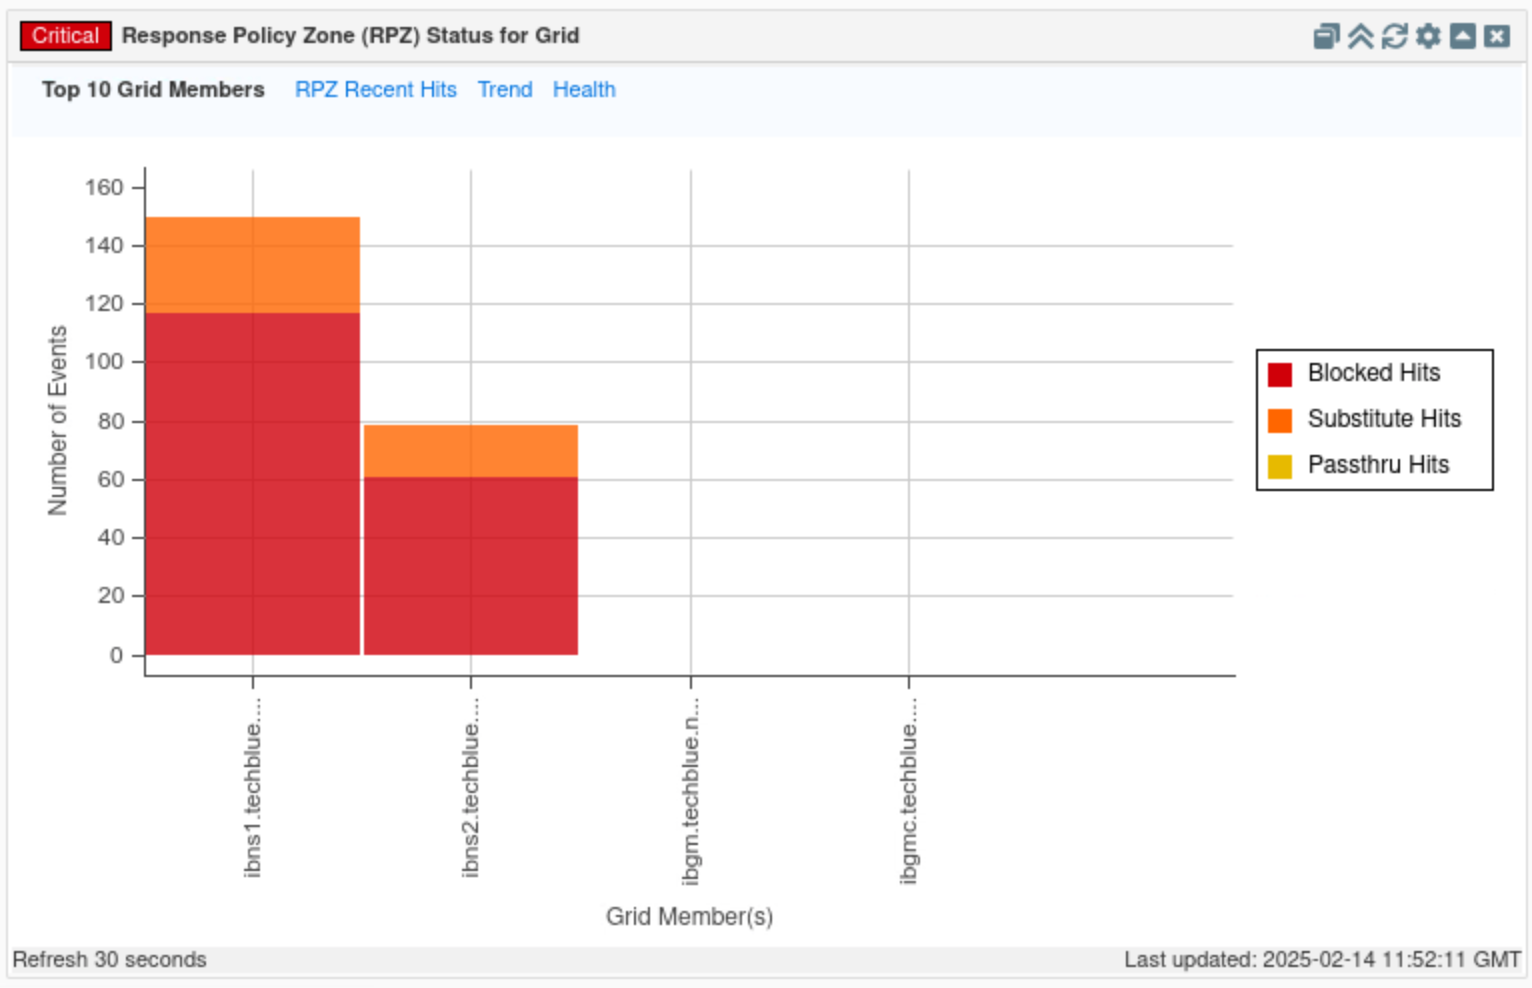
Find the Response Policy Zone (RPZ) Status for Grid widget.
-
Click on the Top 10 Grid Members tab.
-
In this tab, we can see number of hits per action (Block, Substitute and Passthru) per member. If we hover over any section of the bar chart we can see the number of hits for that section.
-
-
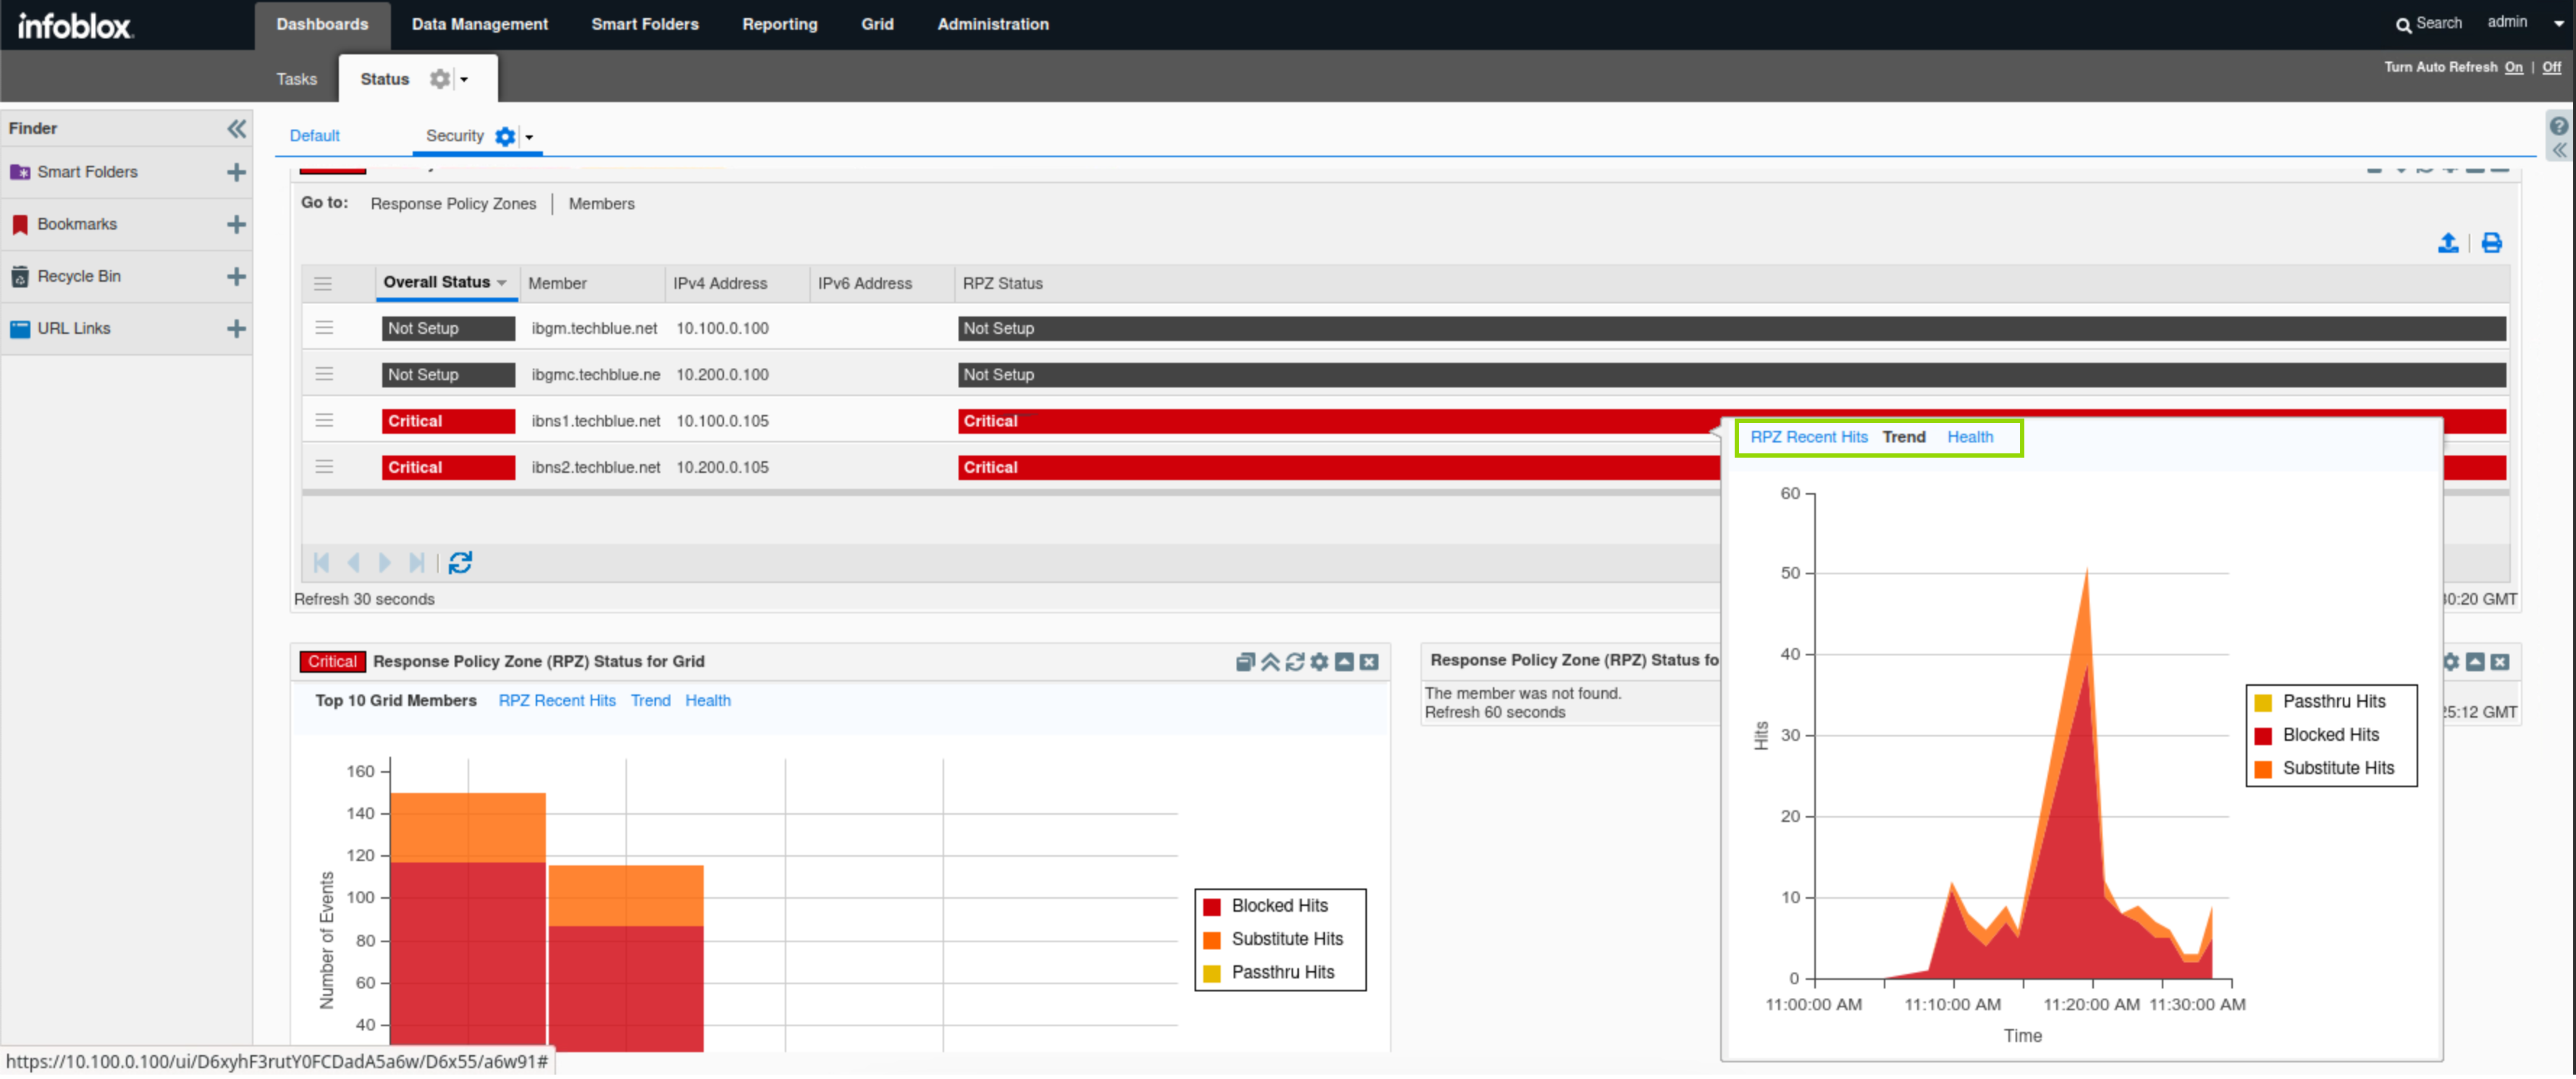
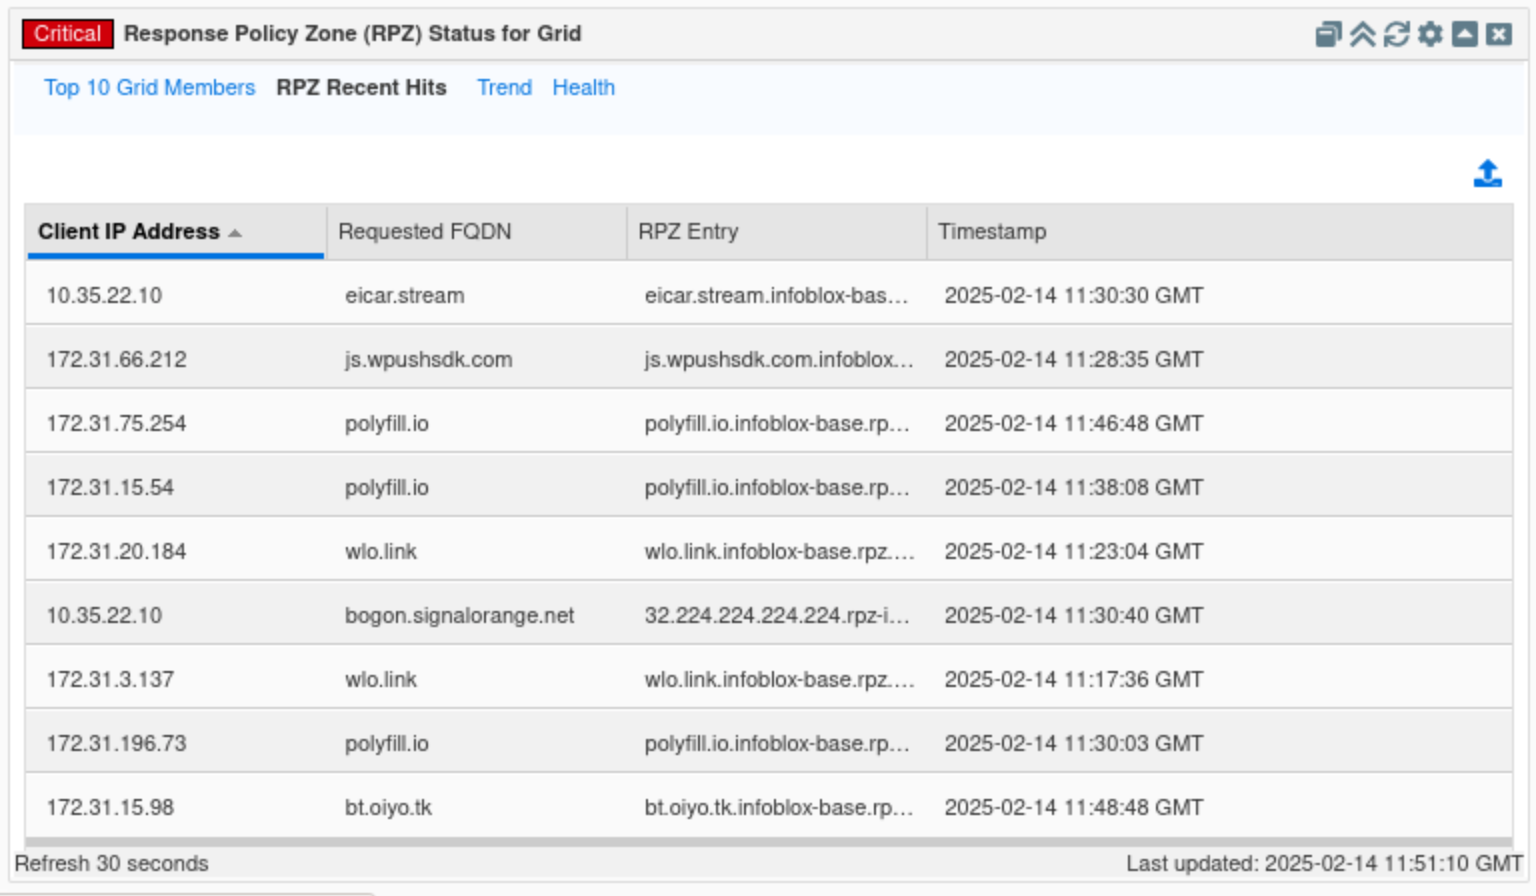
Click on the RPZ Recent Hits tab.
-
In this tab, we can see the latest domains triggering an RPZ hit alongside the source of the domain and the RPZ policy that got triggered. In this example, the results show recent RPZ Hits for the client with IP Address 10.35.22.10 as the top result or the most recent.
-
-
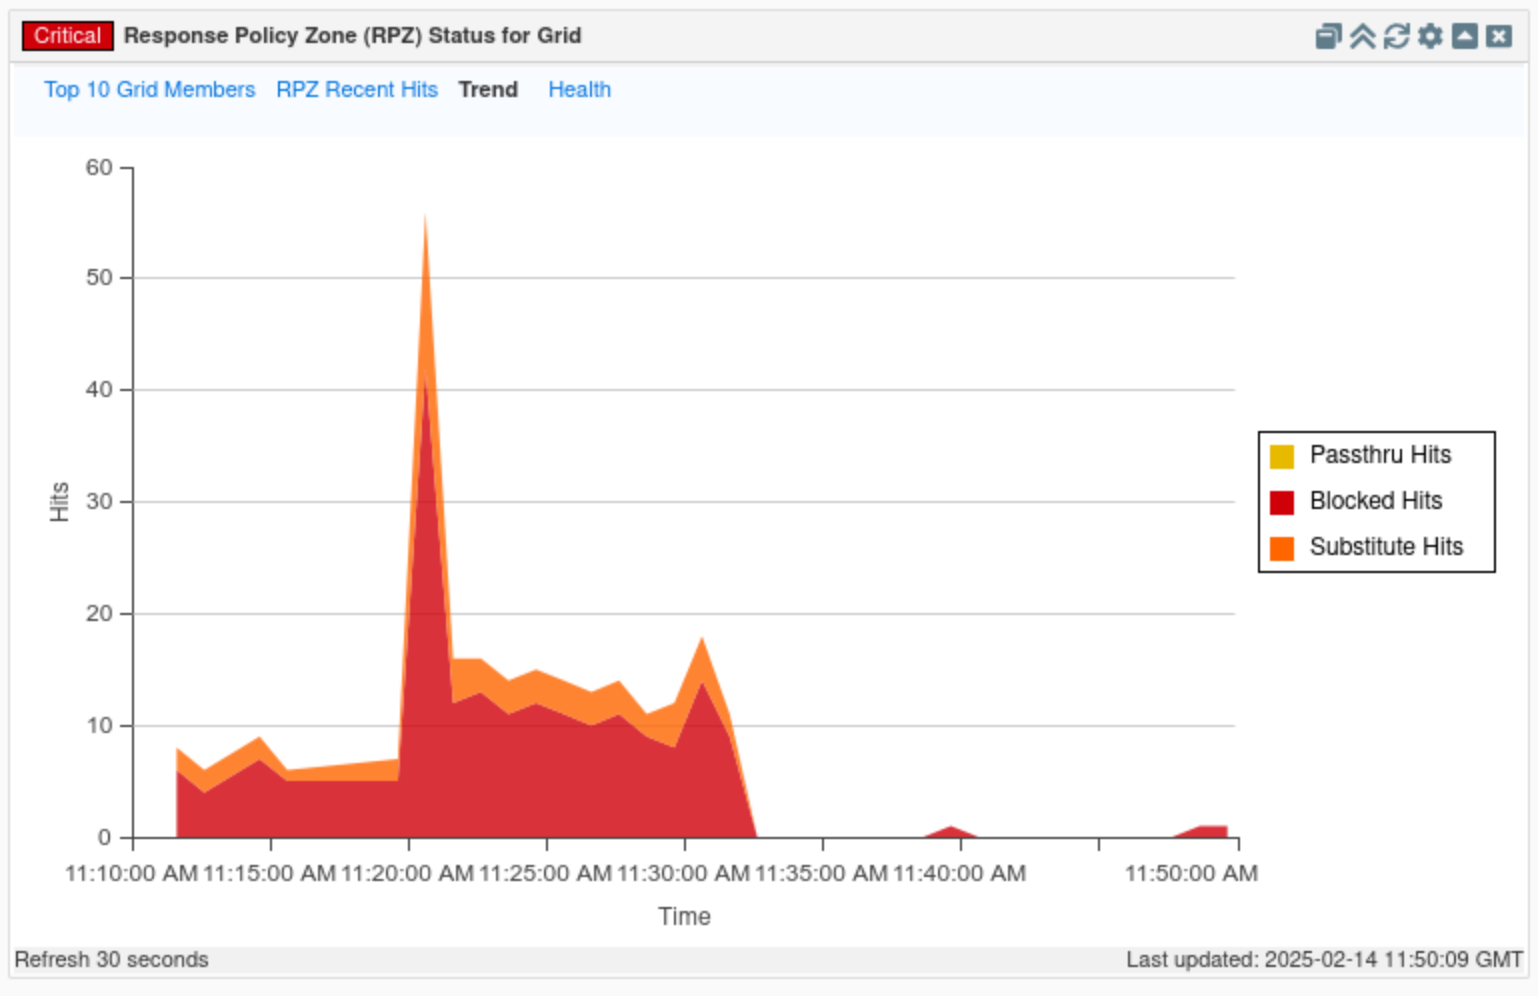
Finally, click on the Trends tab.
-
This tab displays a timeline visualizing the type and number of RPZ hits.
-
-
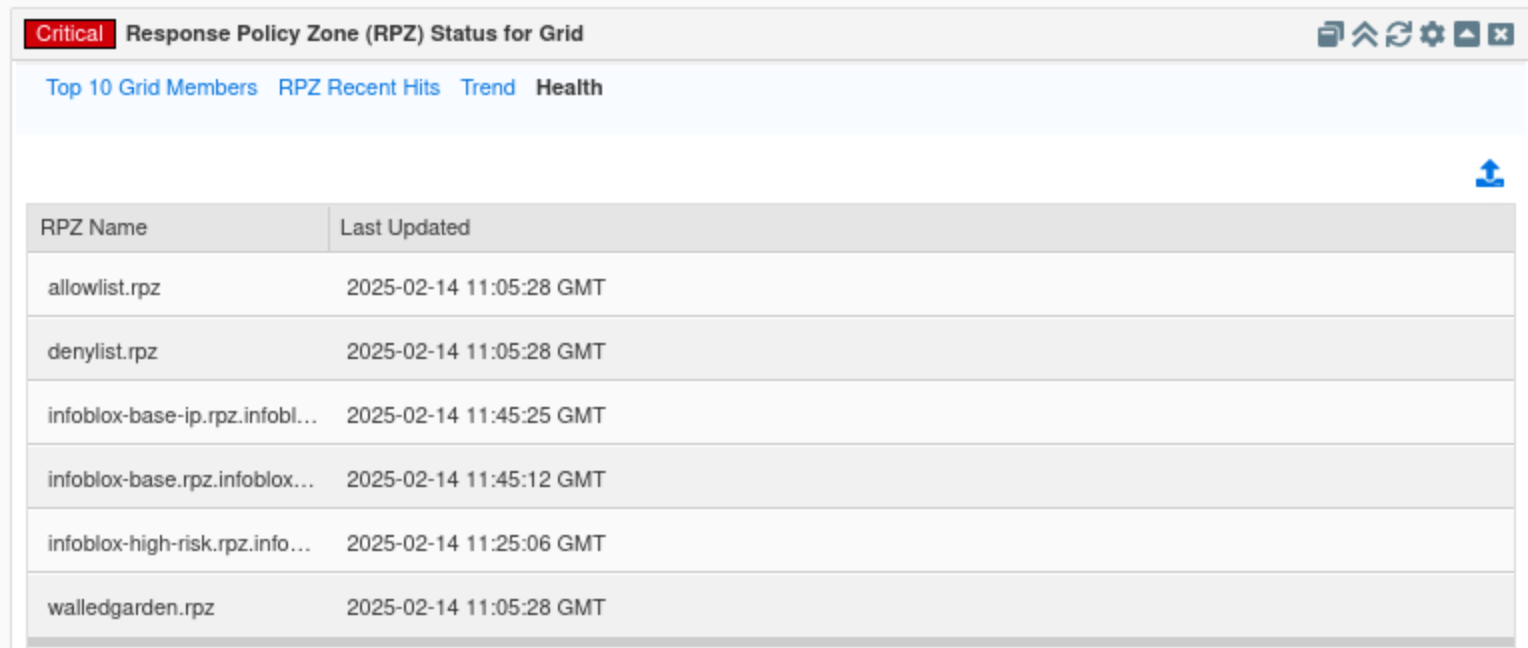
Click on the Health tab.
-
This tab displays the time of the latest updates made for each configured RPZ.
-
-
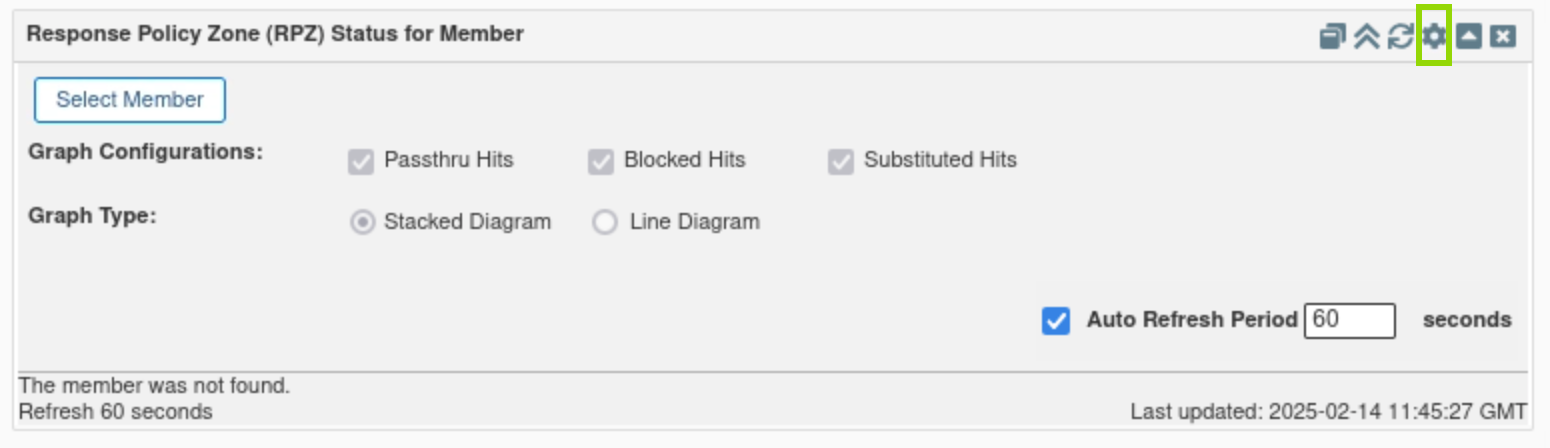
Find the Response Policy Zone (RPZ) Status for Member widget.
-
This widget displays similar information as the Policy Zone (RPZ) Status for Grid but for a selected Grid member.
-
The widget contains three tabs: RPZ Recent Hits, Trends and Health, specifically for the selected grid member.
-
-
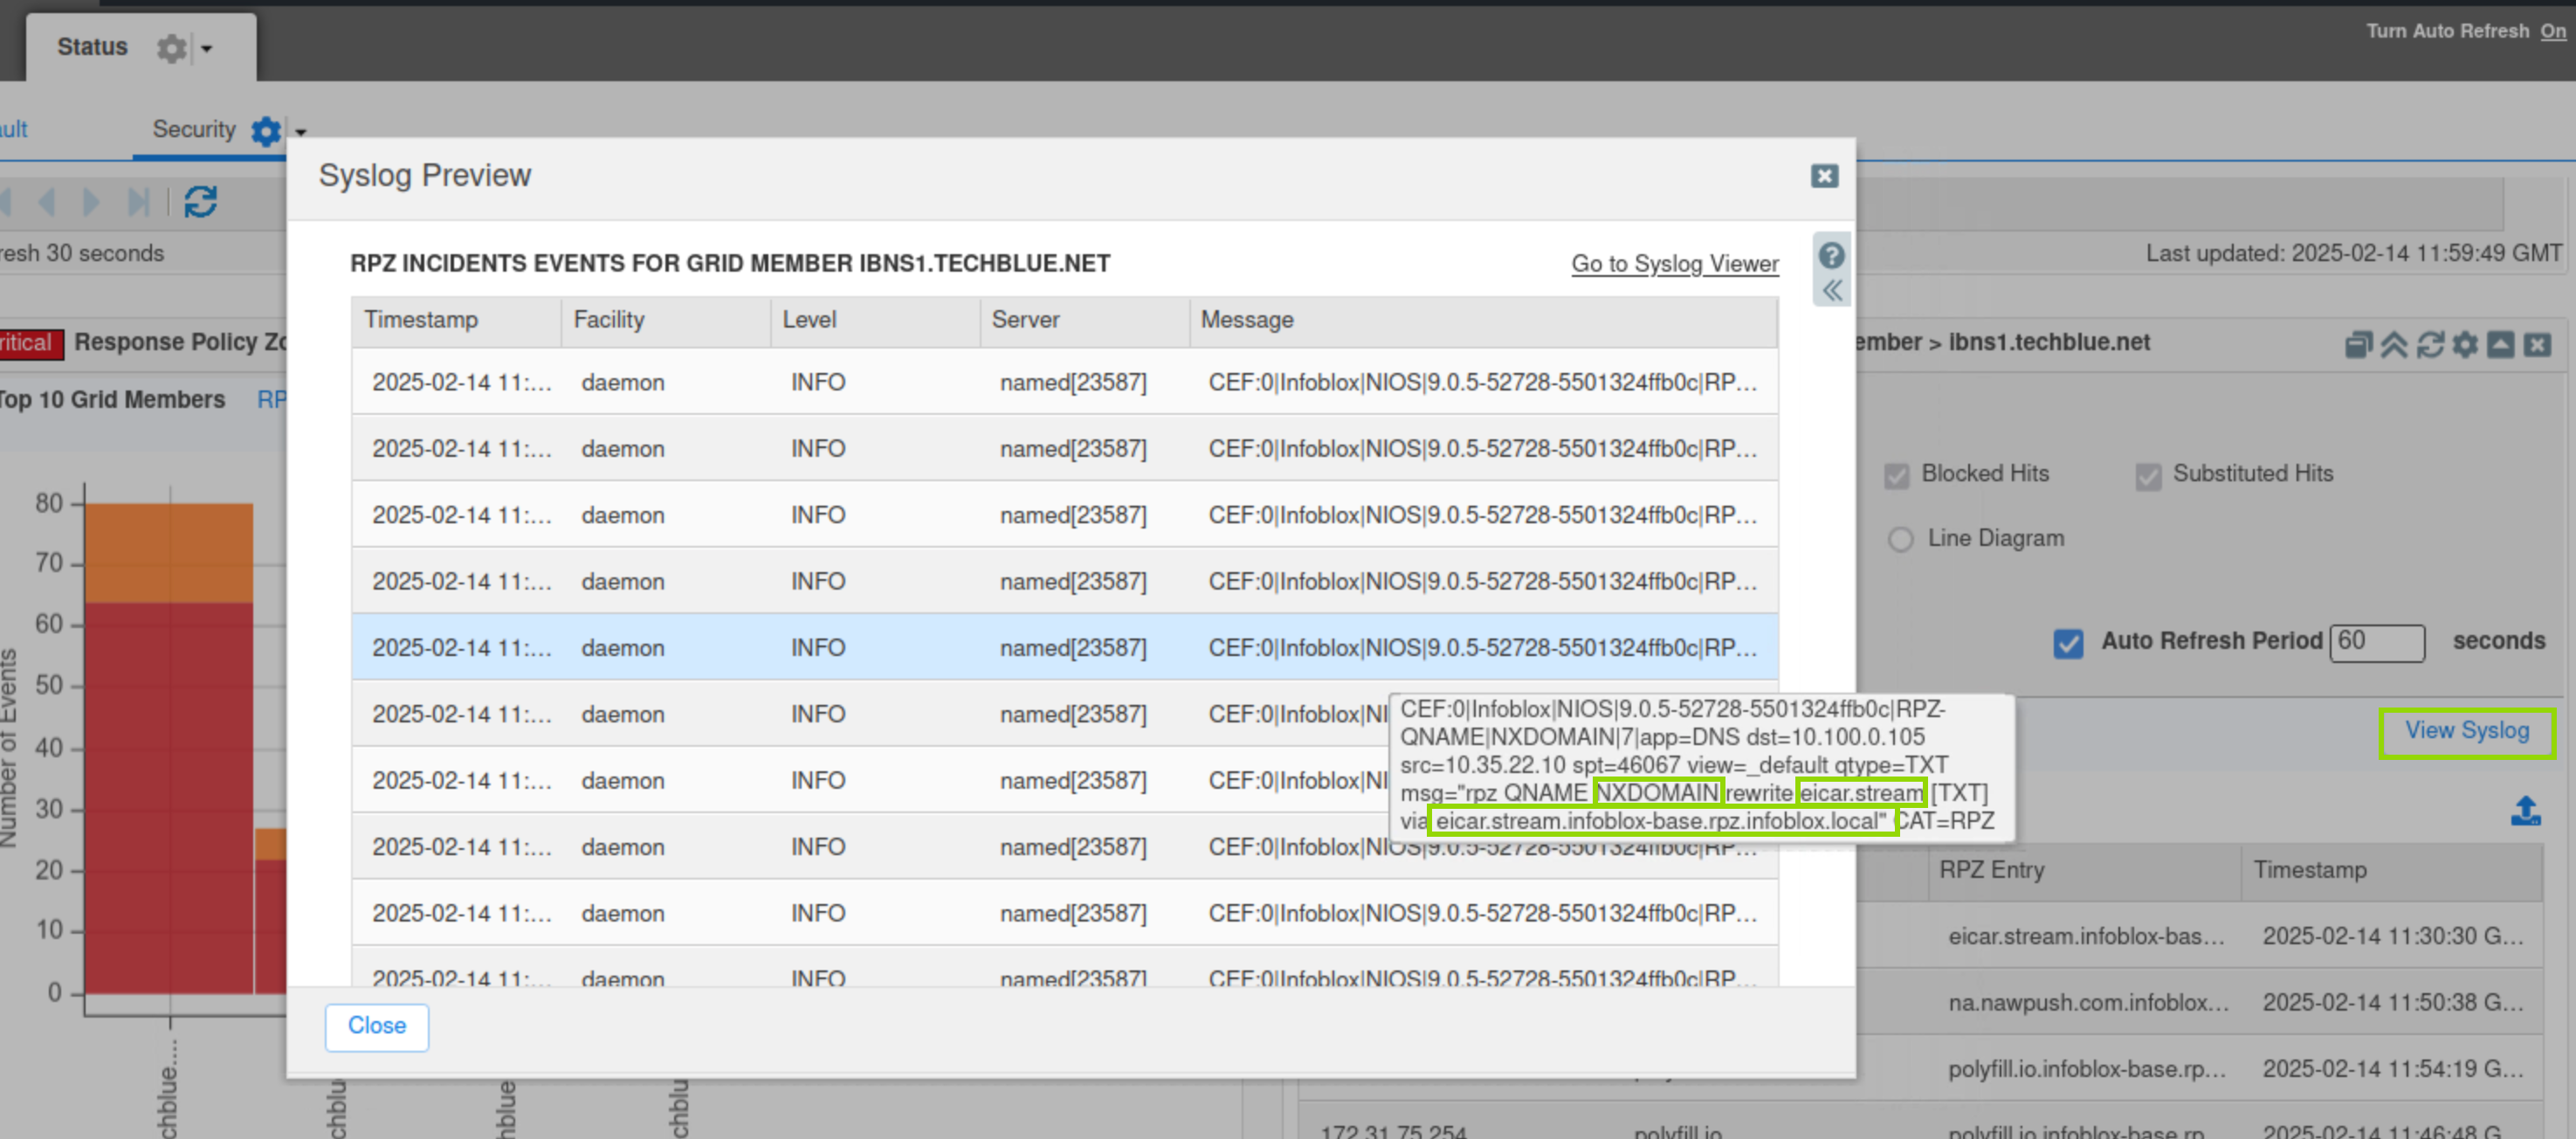
Click the cog wheel icon.
-
Select ibns1.techblue.net.
-
Click the View Syslog button.
-
This is a unique feature for this widget and will allow us to view syslogs for the selected Grid members quickly.
-
-
Hover the mouse over one of the message entries to view the full log message.
Task 2 Solution: Investigate the available Reporting Server Dashboards to identify DNS Top RPZ Hits
If the reporting server needs to be configured, use the following instructions to set it up:
-
Click Continue to the app setup page
-
Username: training
-
Password: infoblox
-
Protocol: SCP
-
Host/ IP Address: 10.100.0.205
-
Port: 22
-
Path: /home/training/Documents/ReportingData
-
In this task, you will investigate the reporting server for default reports and dashboards to help examine the grid security status and investigate the recent spike in RPZ hits.
Please allow 25 to 30 minutes for the Reporting Server to pull data off the Grid and populate its Dashboards and Reports. This waiting time is only required for this simulated lab environment, as the Grid and the Reporting Server haven’t had enough time to sync.
-
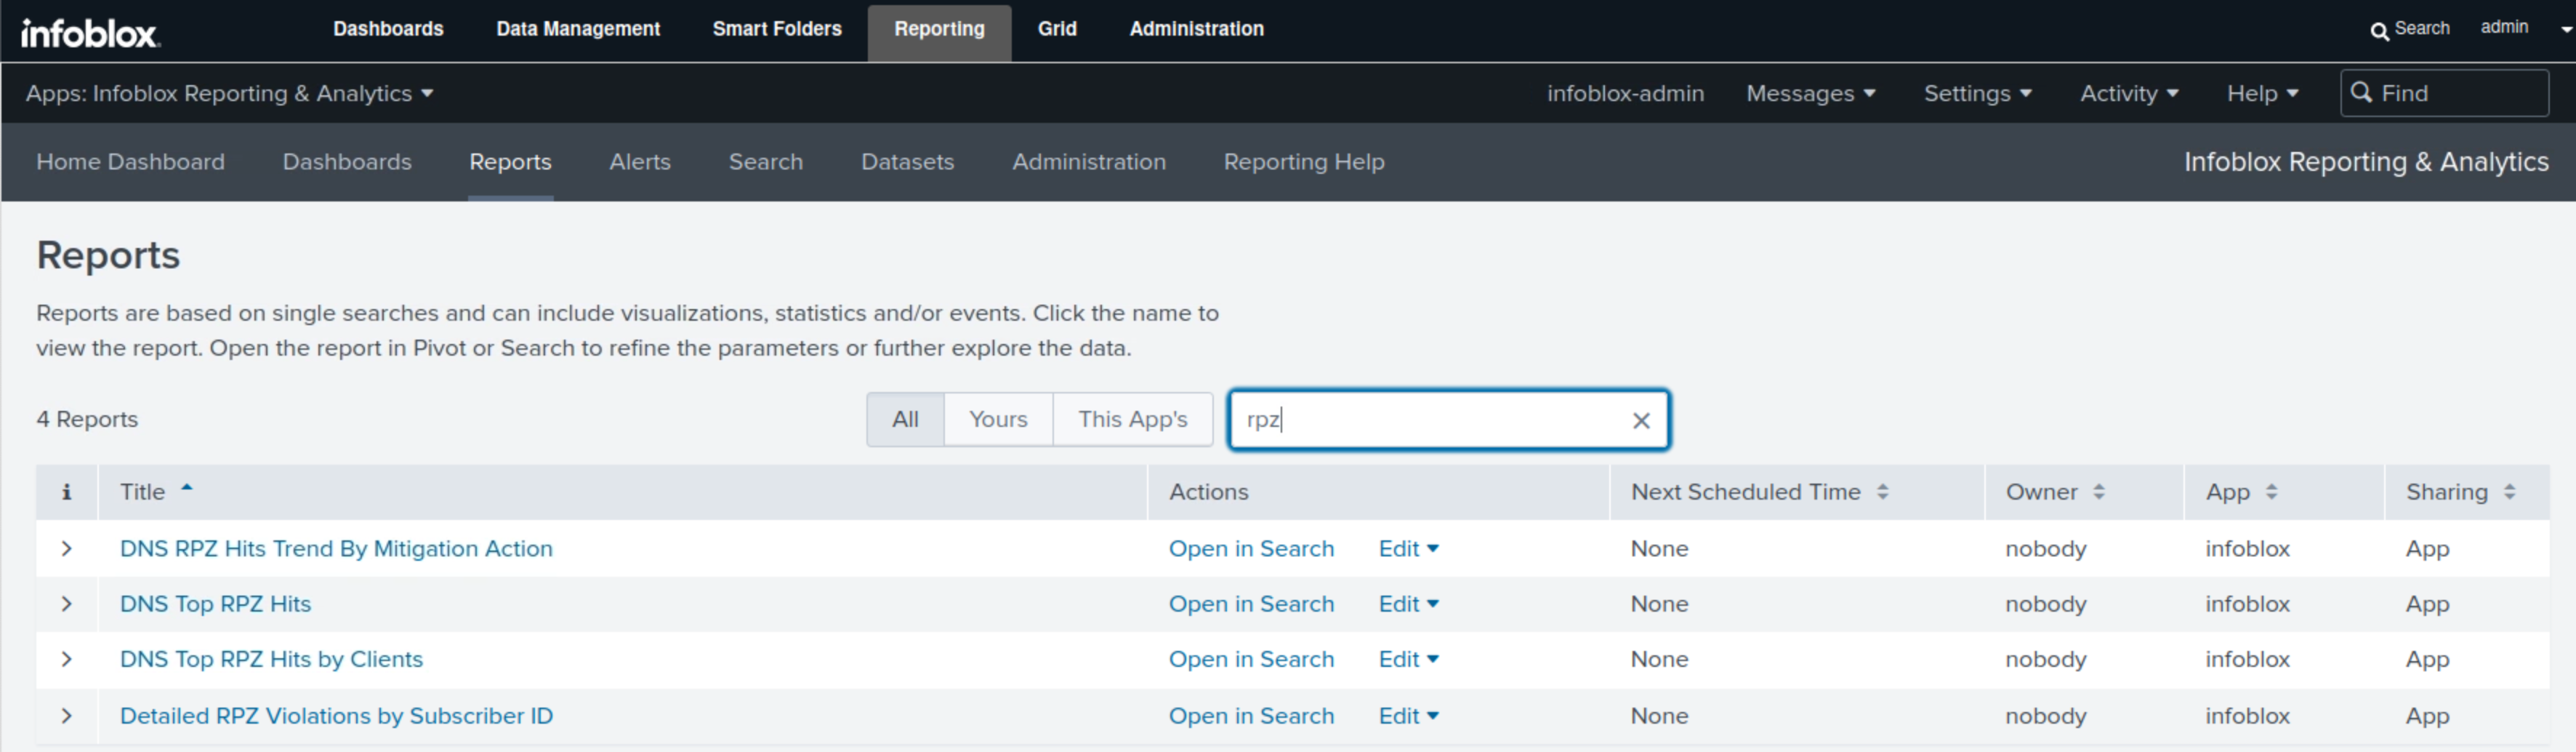
Navigate to Reporting → Reports.
-
Type RPZ in the filter box.
-
Click the DNS Top RPZ Trend By Mitigation Action report.
-
This report will use a bar chart to display the number of RPZ hits divided by action.
-
Click on any of the bars to view more details.
-
the actions are Block, Substitute, NULL or Allow and ClientHit or Passthru.

-
-
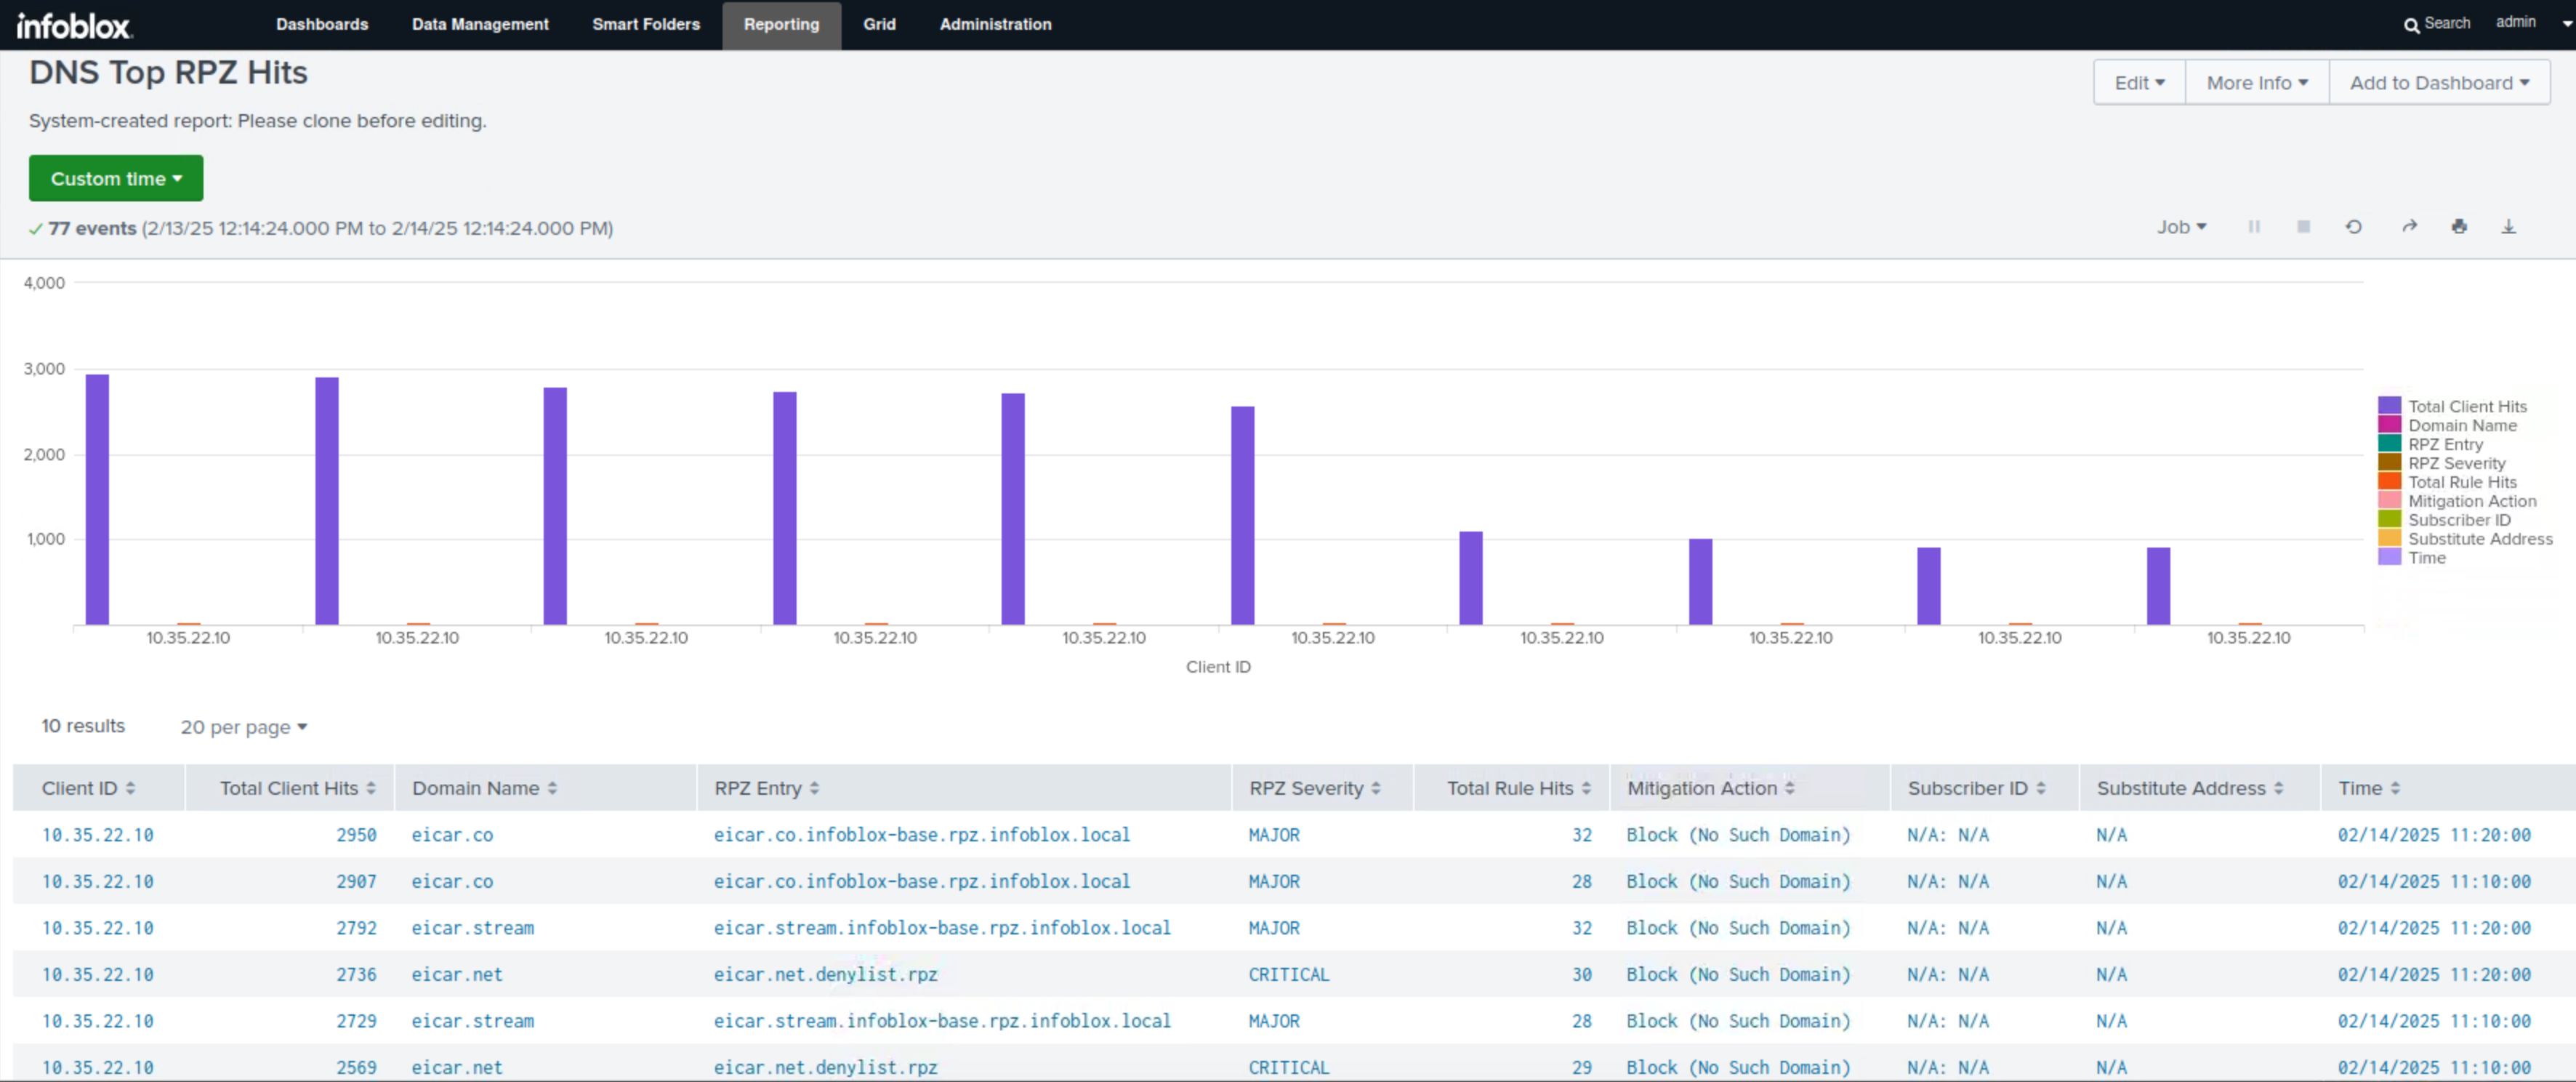
Click the DNS Top RPZ Hits report.
-
This report displays the total number RPZ hits per domain against the entire Grid, displayed in both a bar chart and table formats.
-
-
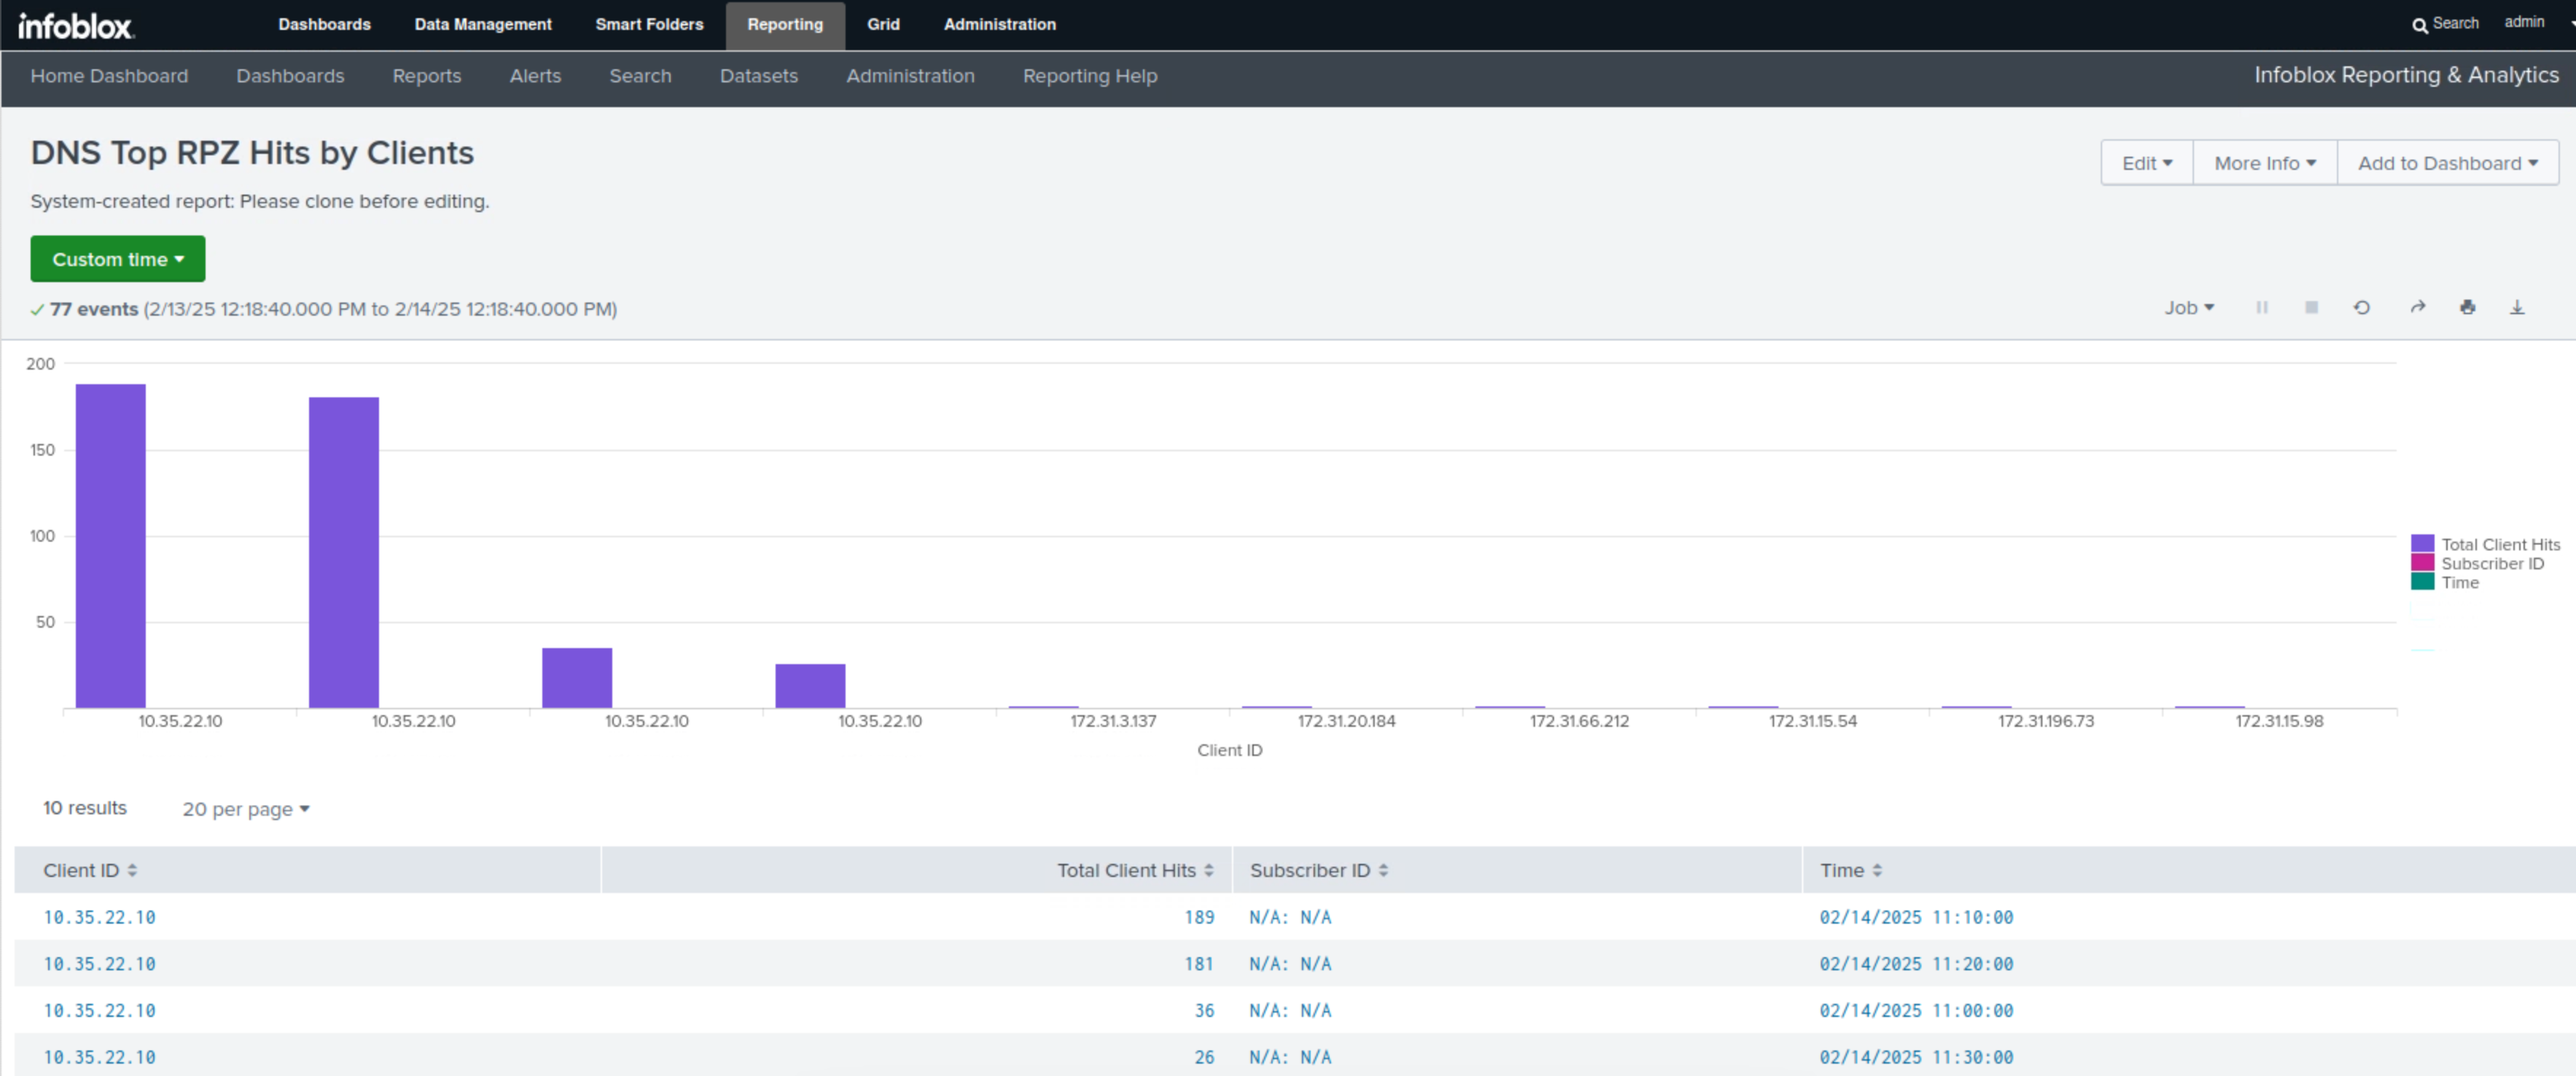
Click the DNS Top RPZ Hits by Clients report.
-
This report displays the total number of RPZ hits per IP address against the entire Grid, displayed in both a bar chart and table formats.
-
After your investigation, you determined that the cause for the recent spike in RPZ hits was due to a singular IP 10.35.22.10 which might be infected. You are now confident that the Grid handled the attempts from this device appropriately. You now can hand this information to the SOC team to investigate this device further and present it to your manager.
-
Task 3 Solution: Create a new Dashboard called DDI Security Dashboard
In this task, you create a new dashboard using XML source from the Infoblox Community. This Dashboard provides a good visual representation of DDI Security and will be popular with less technical senior staff, helping you with your presentation to the management team about the recent RPZ spike incident. The XML is stored in the Reporting - DDI Security Dashboard.xml file in the Shared Drive/NIOS Imports folder on the Linux Desktop.
-
Navigate to Reporting → Dashboards.
-
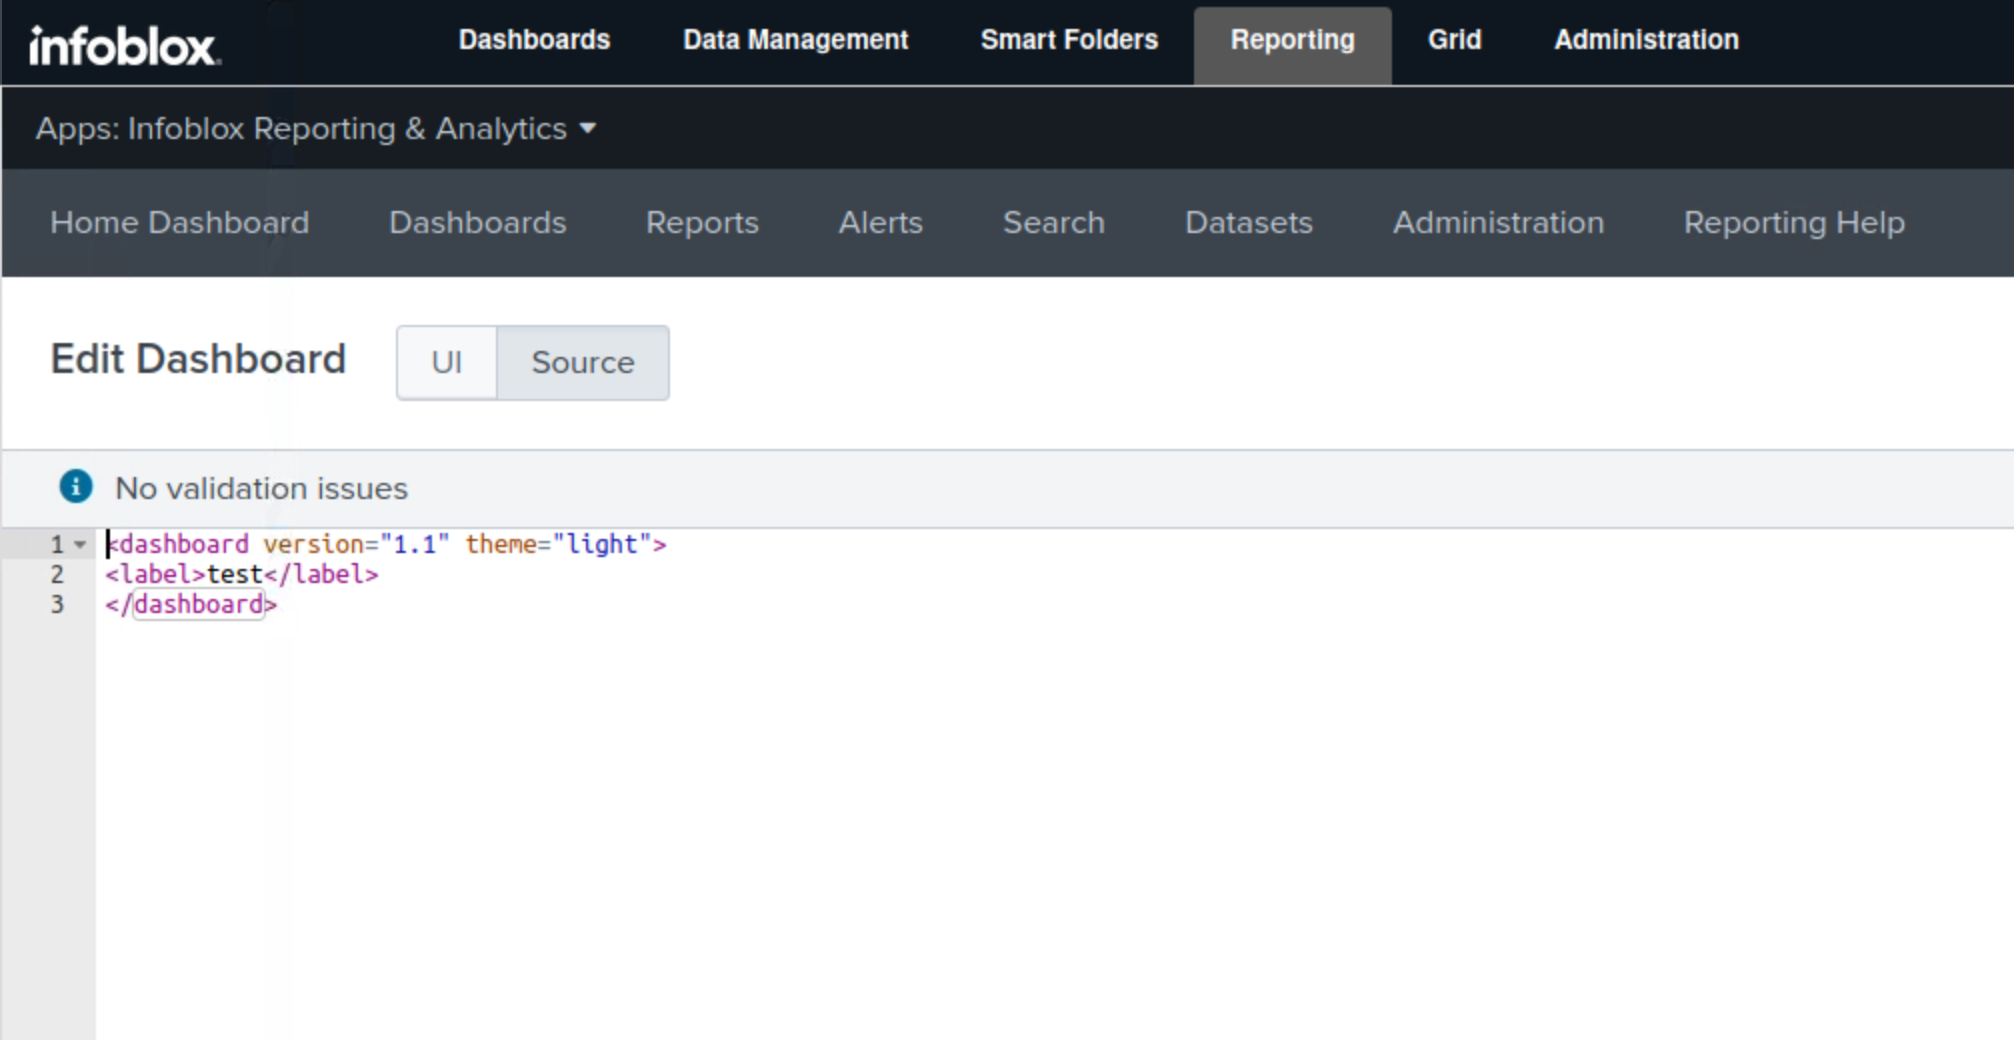
Click Create New Dashboard.
-
Type test in the Title field.
-
It will be replaced by the title in the XML file.
-
-
Change the Permissions to Shared in the App.
-
This will allow other admins and operators to view the dashboard you created.
-
-
Select Shared in App the dashboard is available to others.
-
Select Classic Dashboards.
-
Click Create.

-
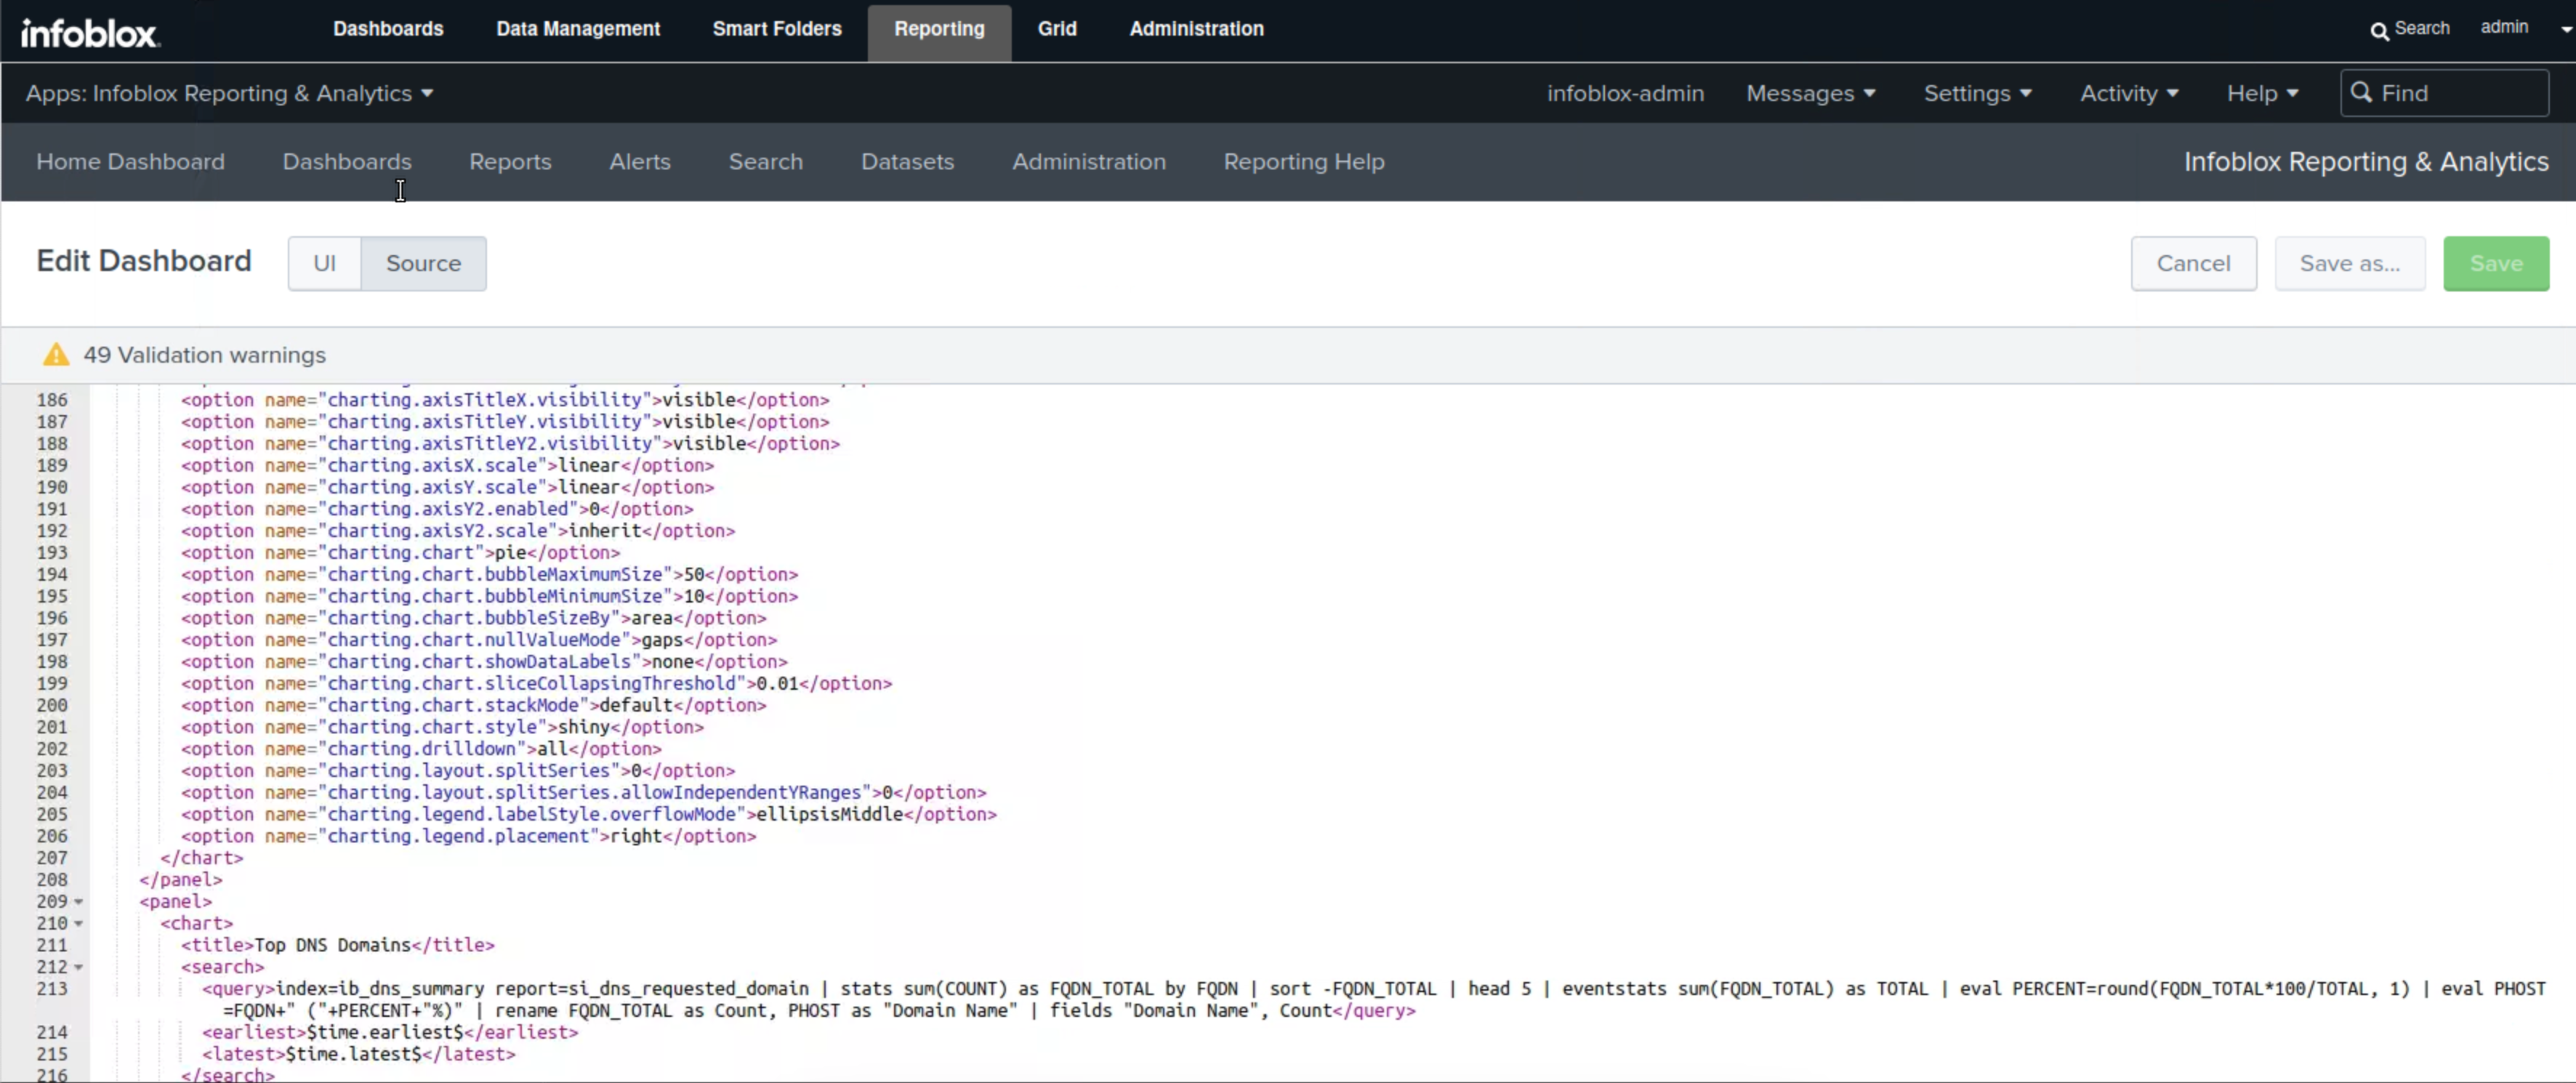
Click the Source button.
-
This will allow us to directly add the XML script to the dashboard.
-
-
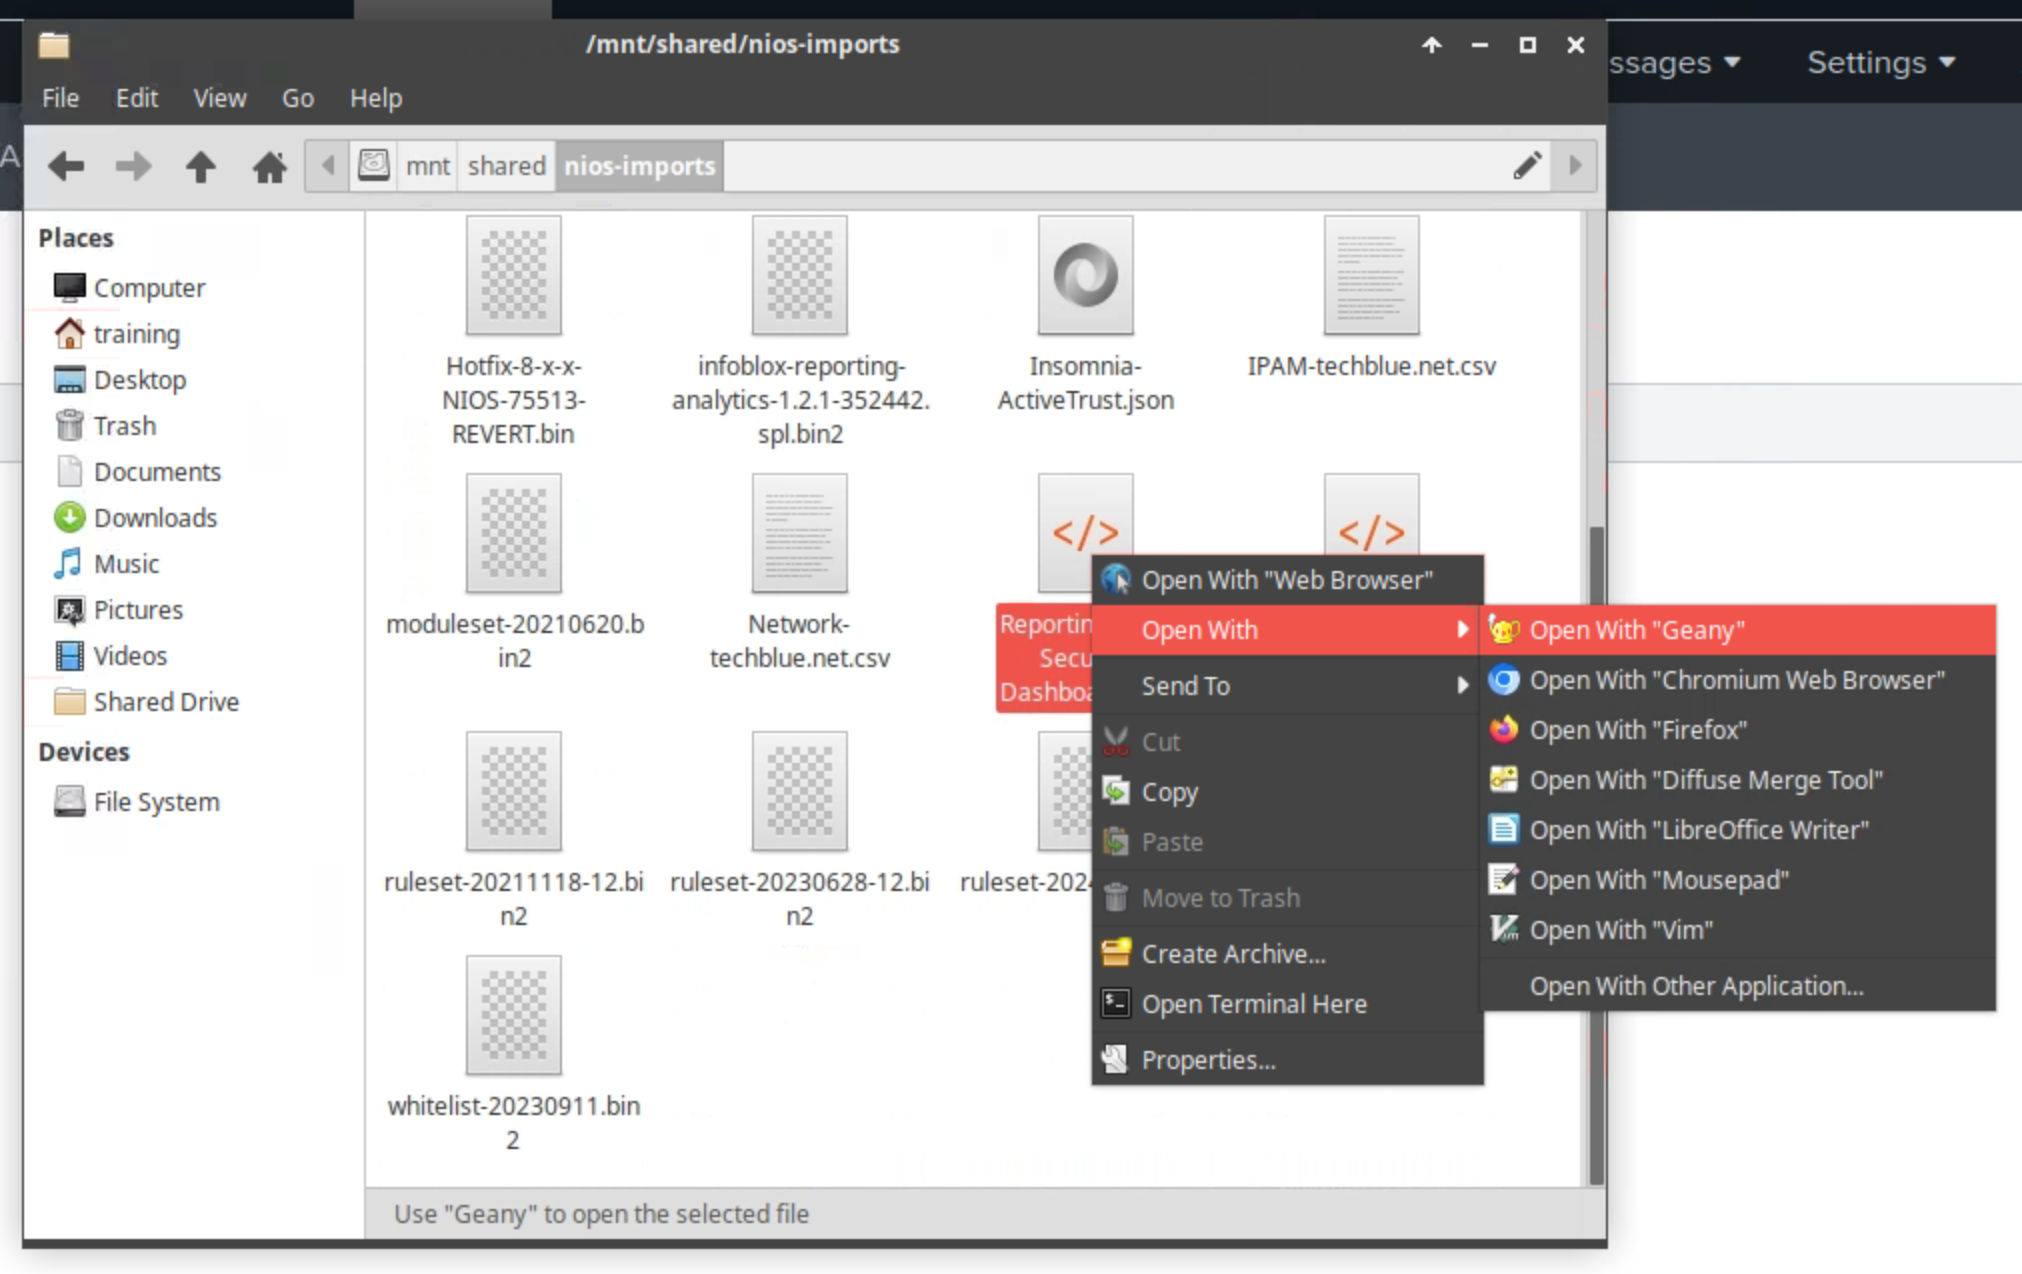
Navigate to the
Shared Drive/NIOS Importsdirectory on jump-desktop. -
Right-click on the Reporting - DNS Firewall Dashboard.xml file.
-
Open the file with the Geany application.
-
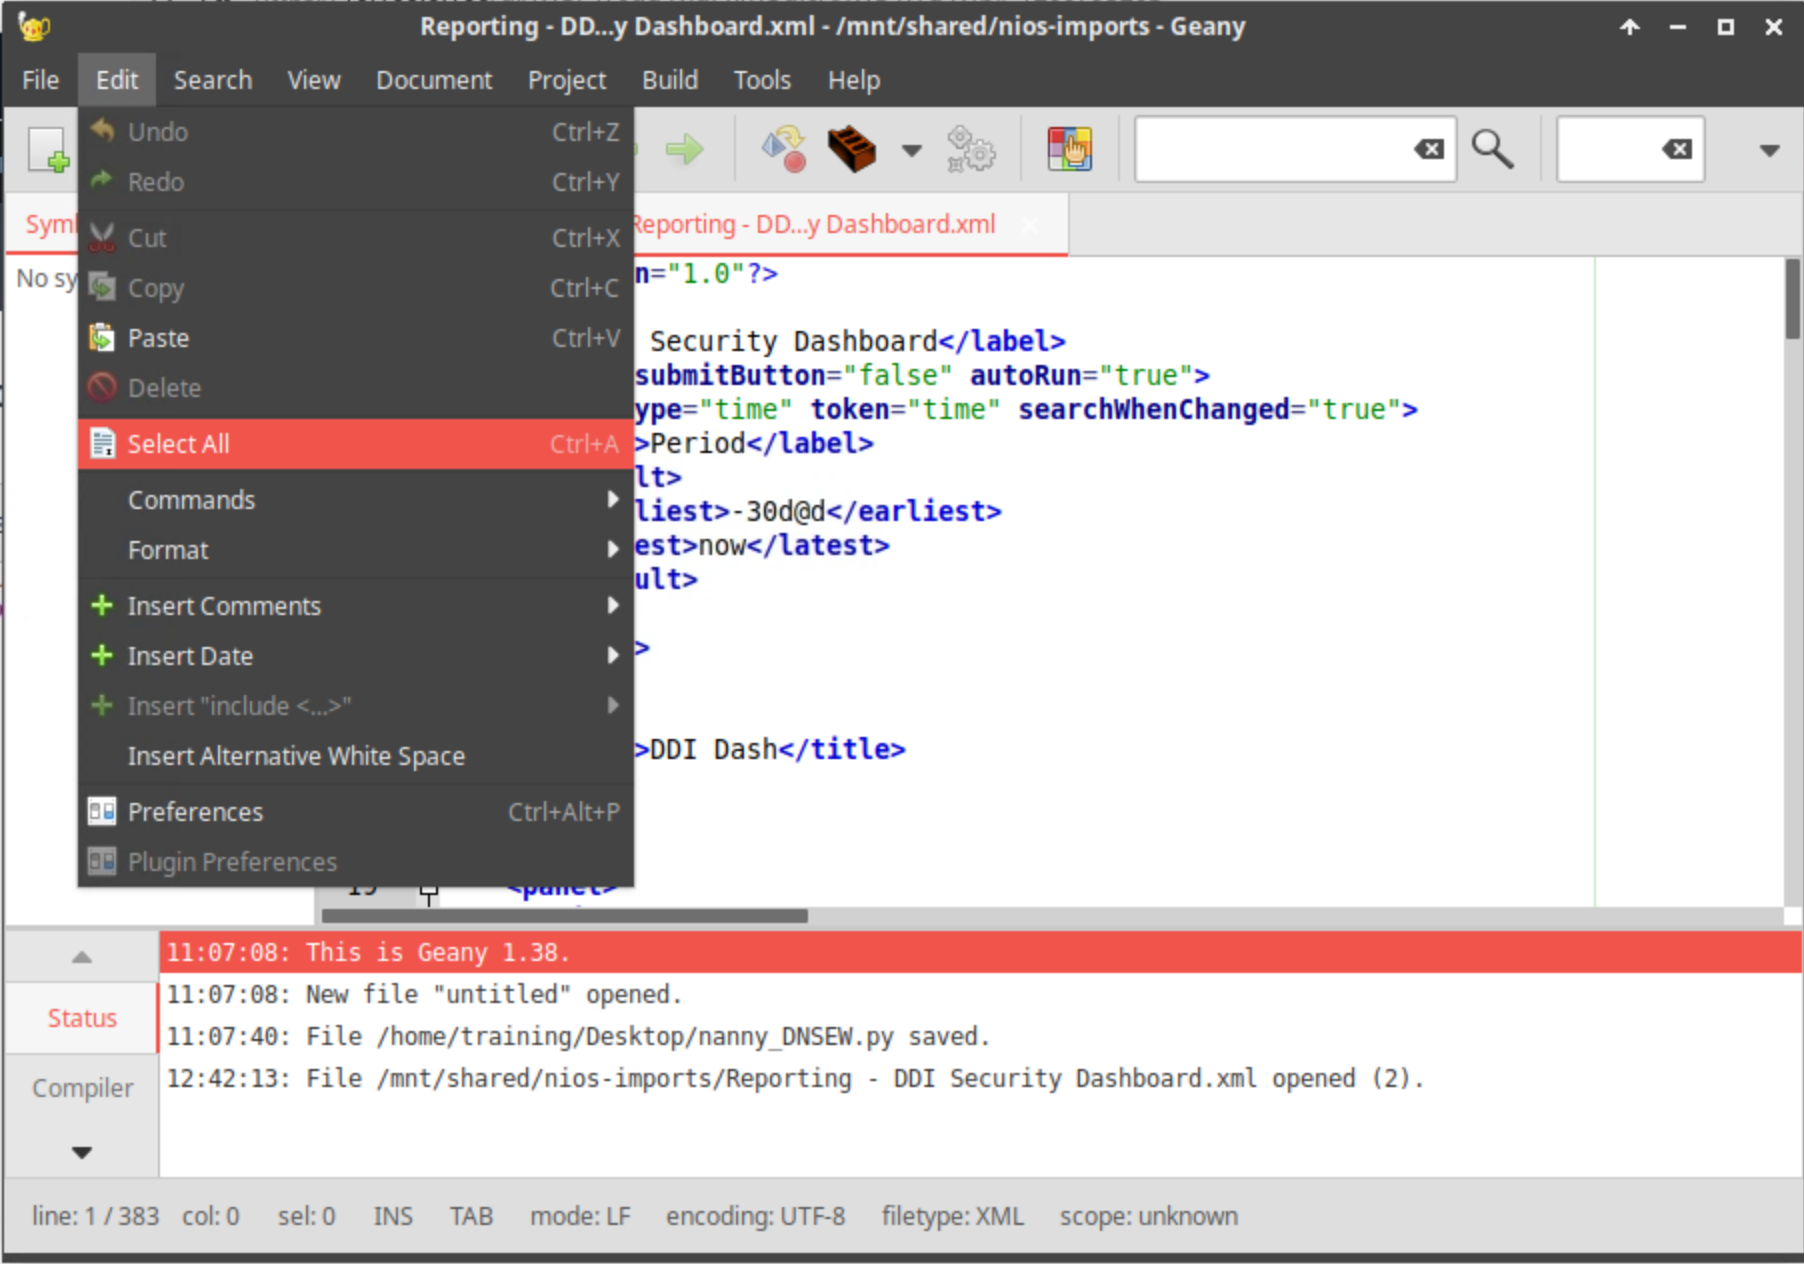
Click Edit and choose Select All.
-
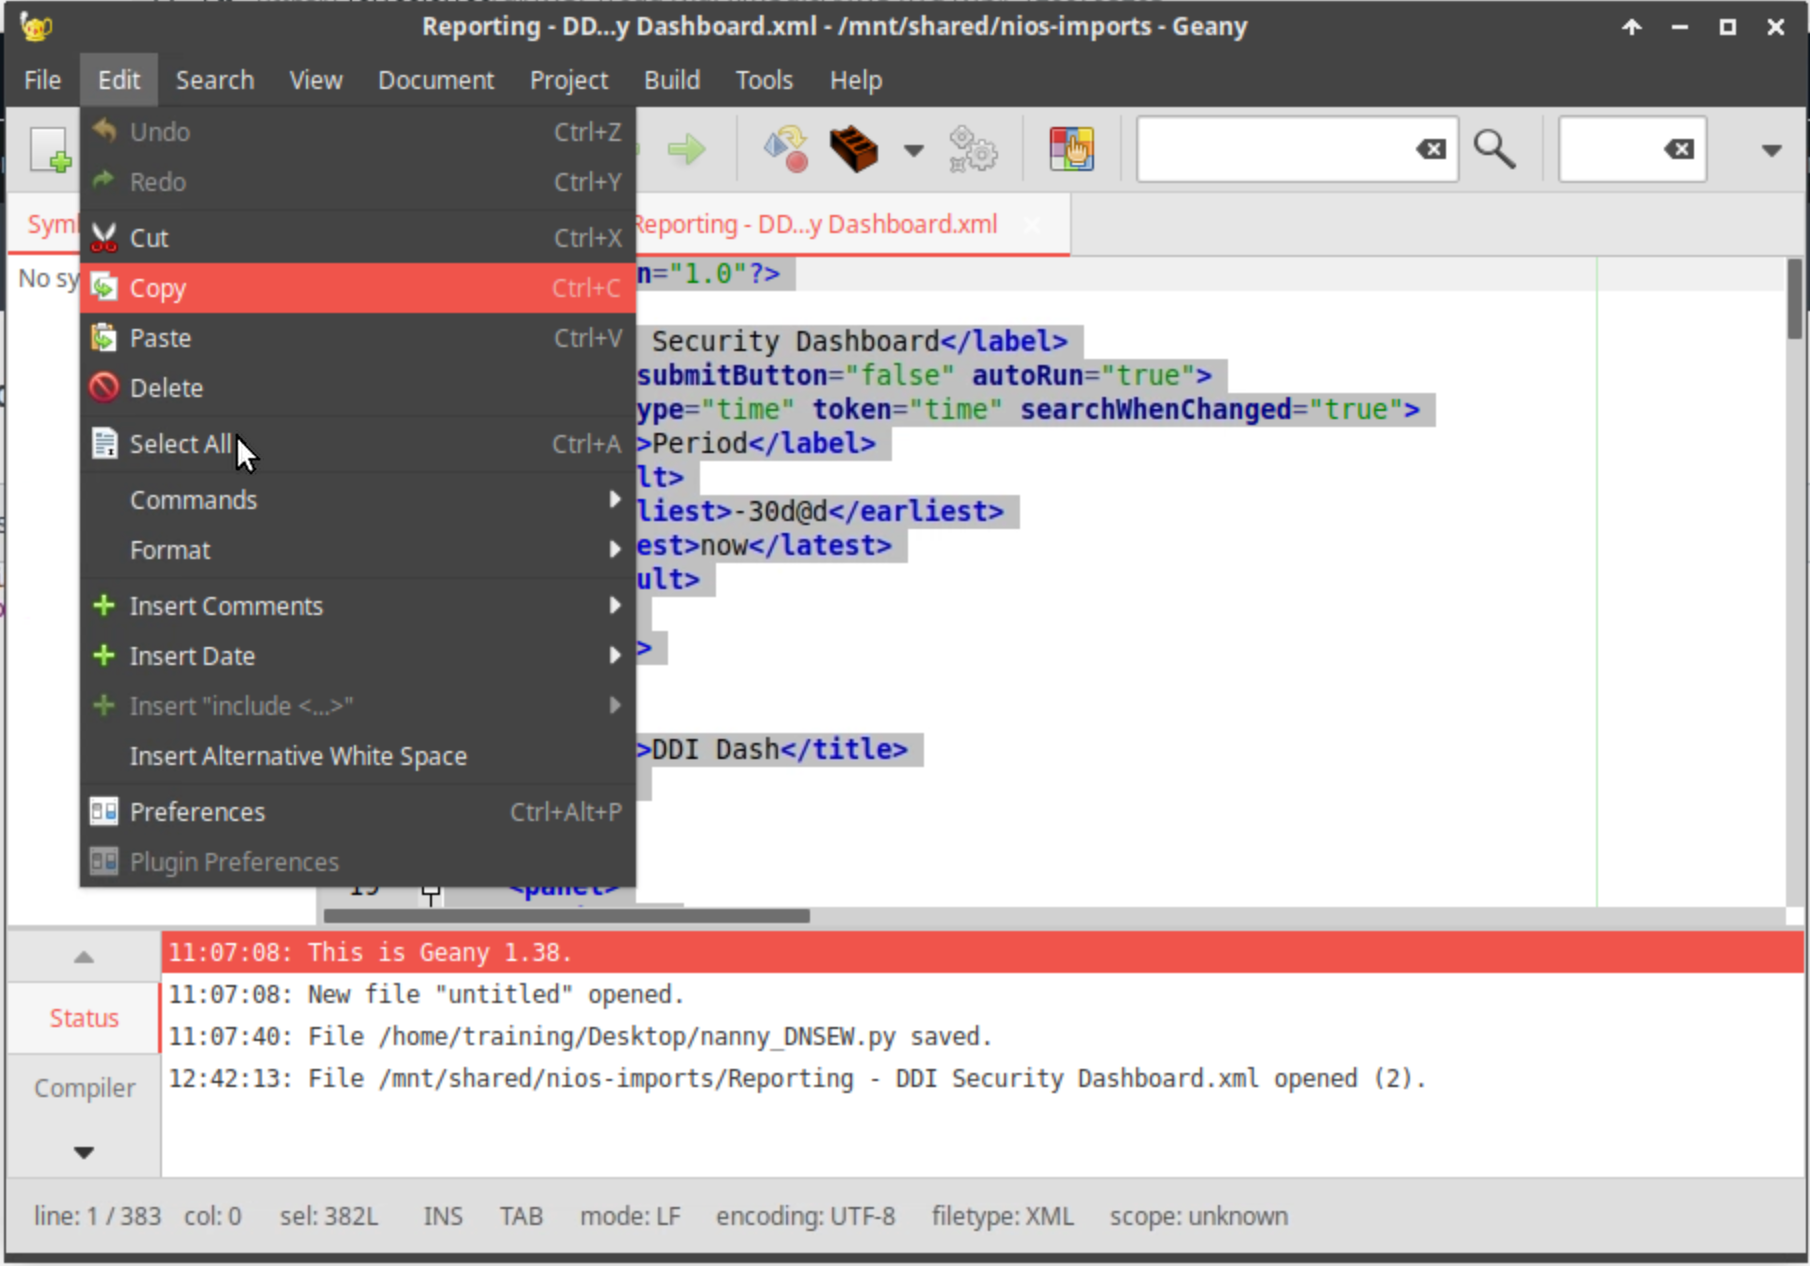
Click Edit and choose Copy.
-
Switch back to the Grid Manager.
-
Highlight the existing text in the dashboard source window.
-
Right-click to paste the XML you copied over the top of the existing XML.
-
Click Save, then Refresh.
Task 4 Solution: Create a DDI Security Dashboard Panel and a Report based on RPZ Hits
In this task, you are adding an extra element to the custom dashboard you created earlier, which is to highlight the usage of a specific RPZ infoblox-base.rpz.infoblox.local. Since this was the most hit RPZ in the recent RPZ spike incident, this will be an effective way to communicate your team’s work when presenting to the management. You will use the search function as it is the easiest way to get exactly the output you’re looking for, and then add the search result as a dashboard panel. You will also generate a report off the same search query highlighting the infoblox-base.rpz.infoblox.local RPZ.
-
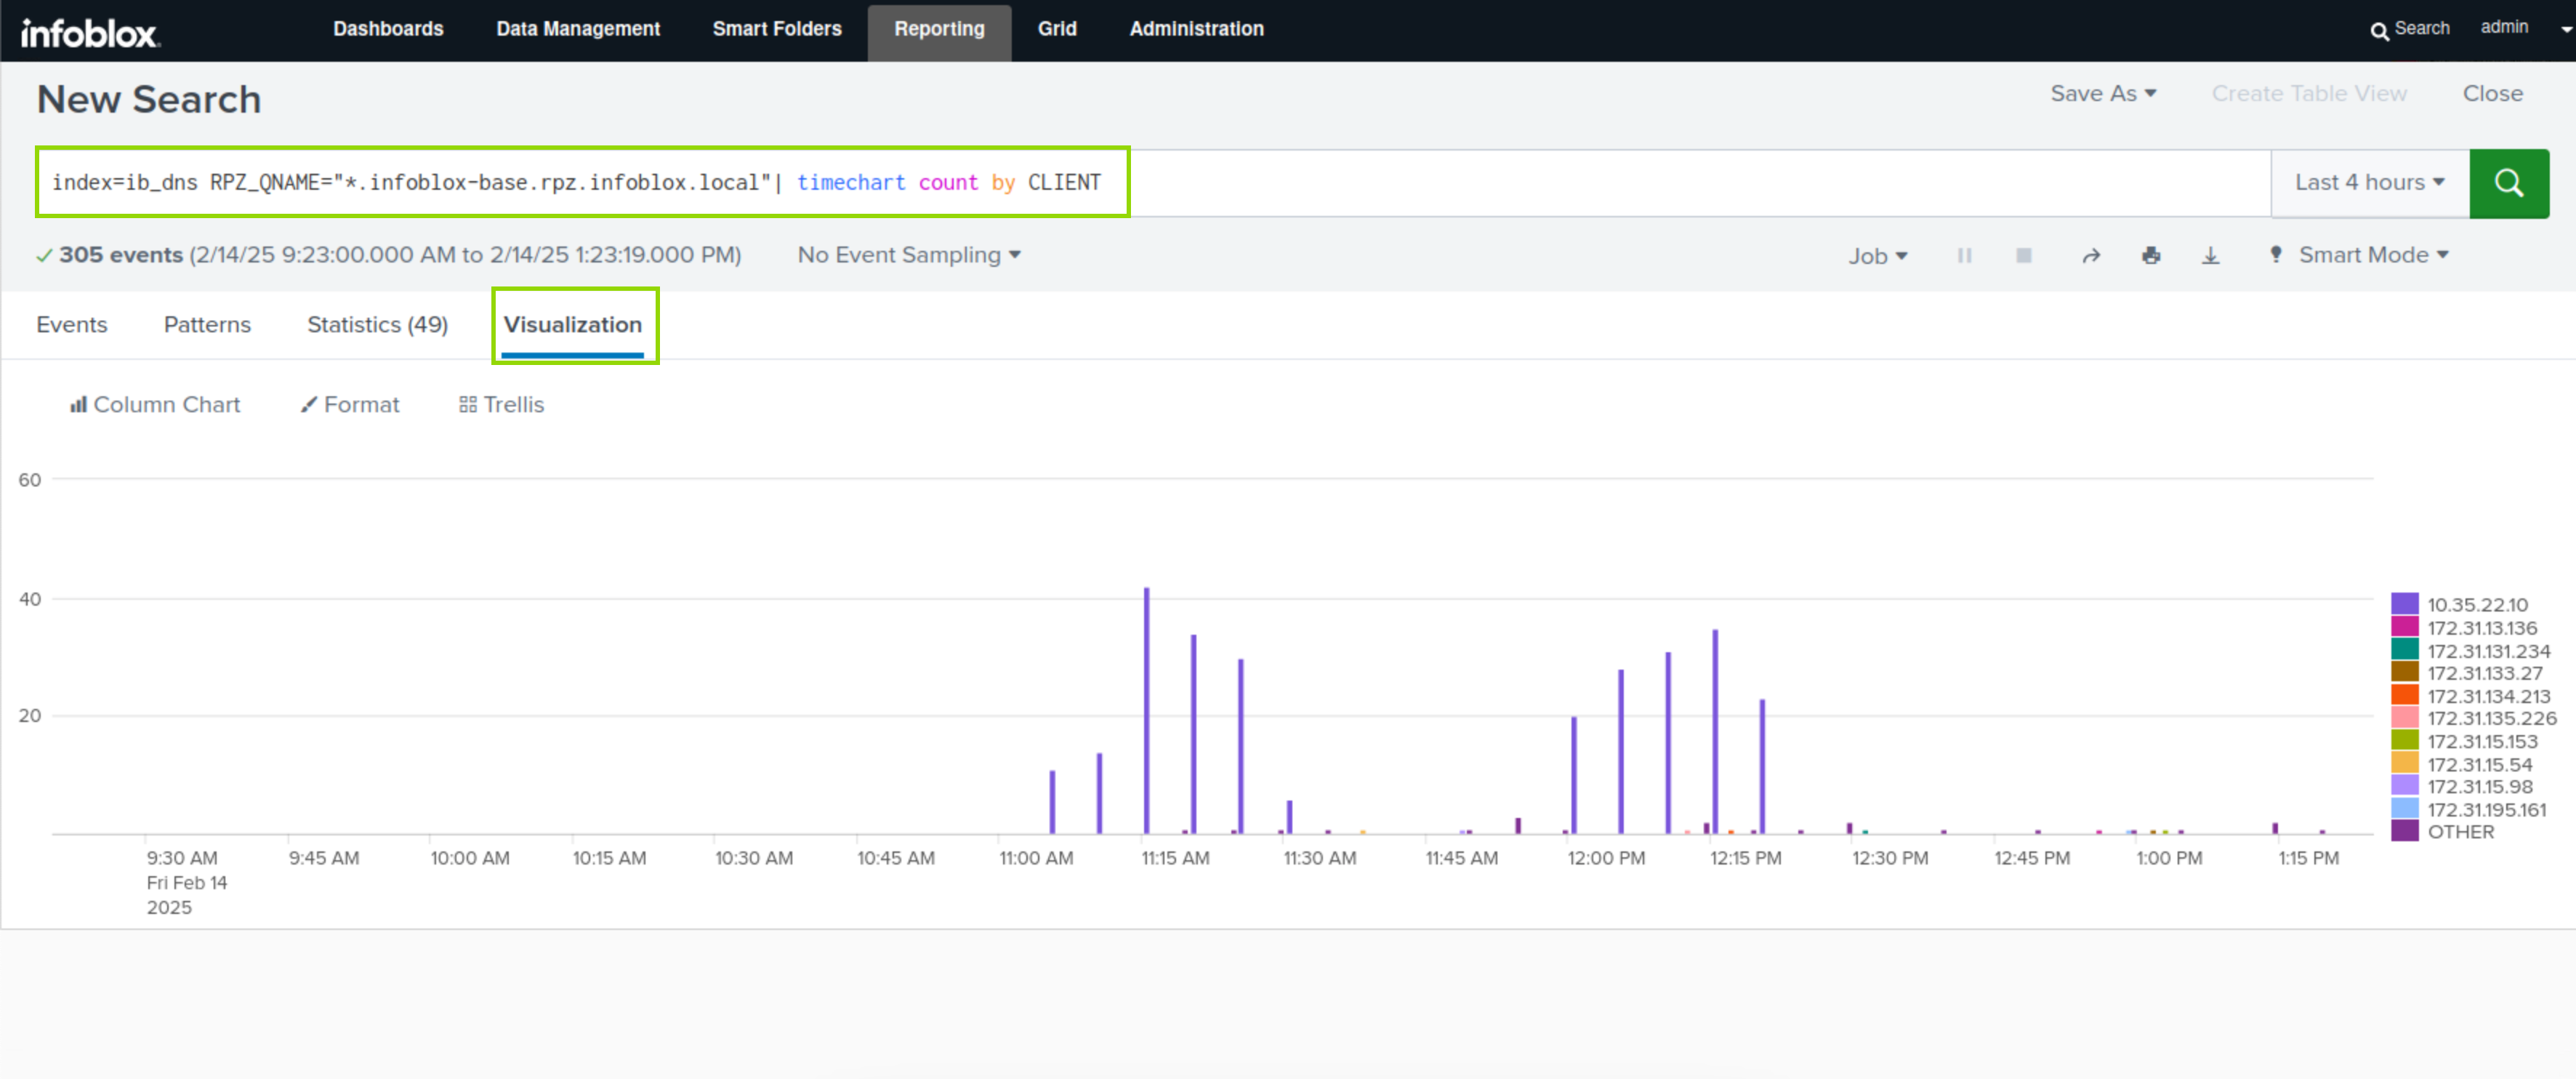
Navigate to Reporting → Search.
-
Enter the following text as the Search command:
index=ib_dns RPZ_QNAME="*.infoblox-base.rpz.infoblox.local"| timechart count by CLIENT -
Click the Search button.
-
Click the Visualization button.
-
This search result will visualise the use of the infoblox-base over a selected period.
-
-
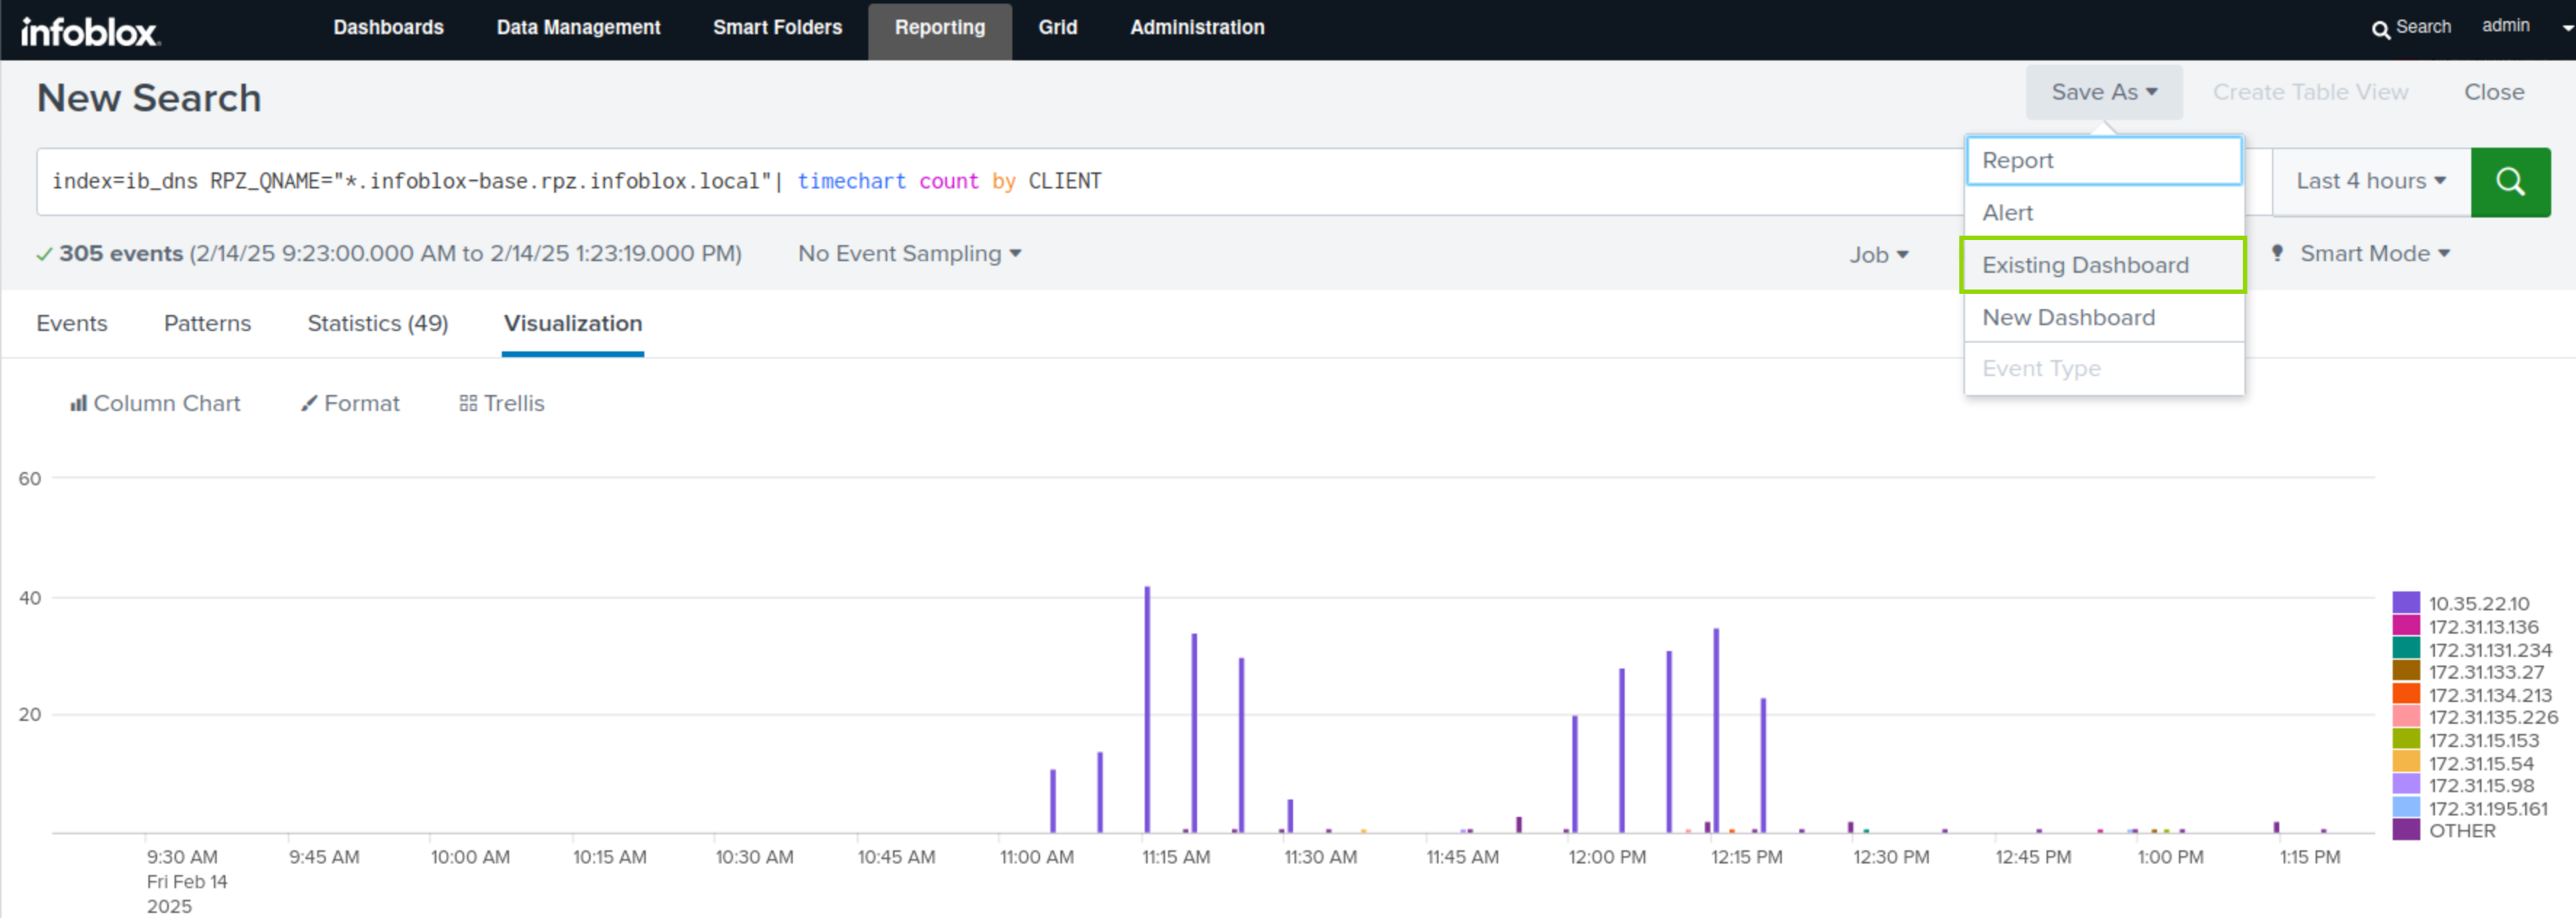
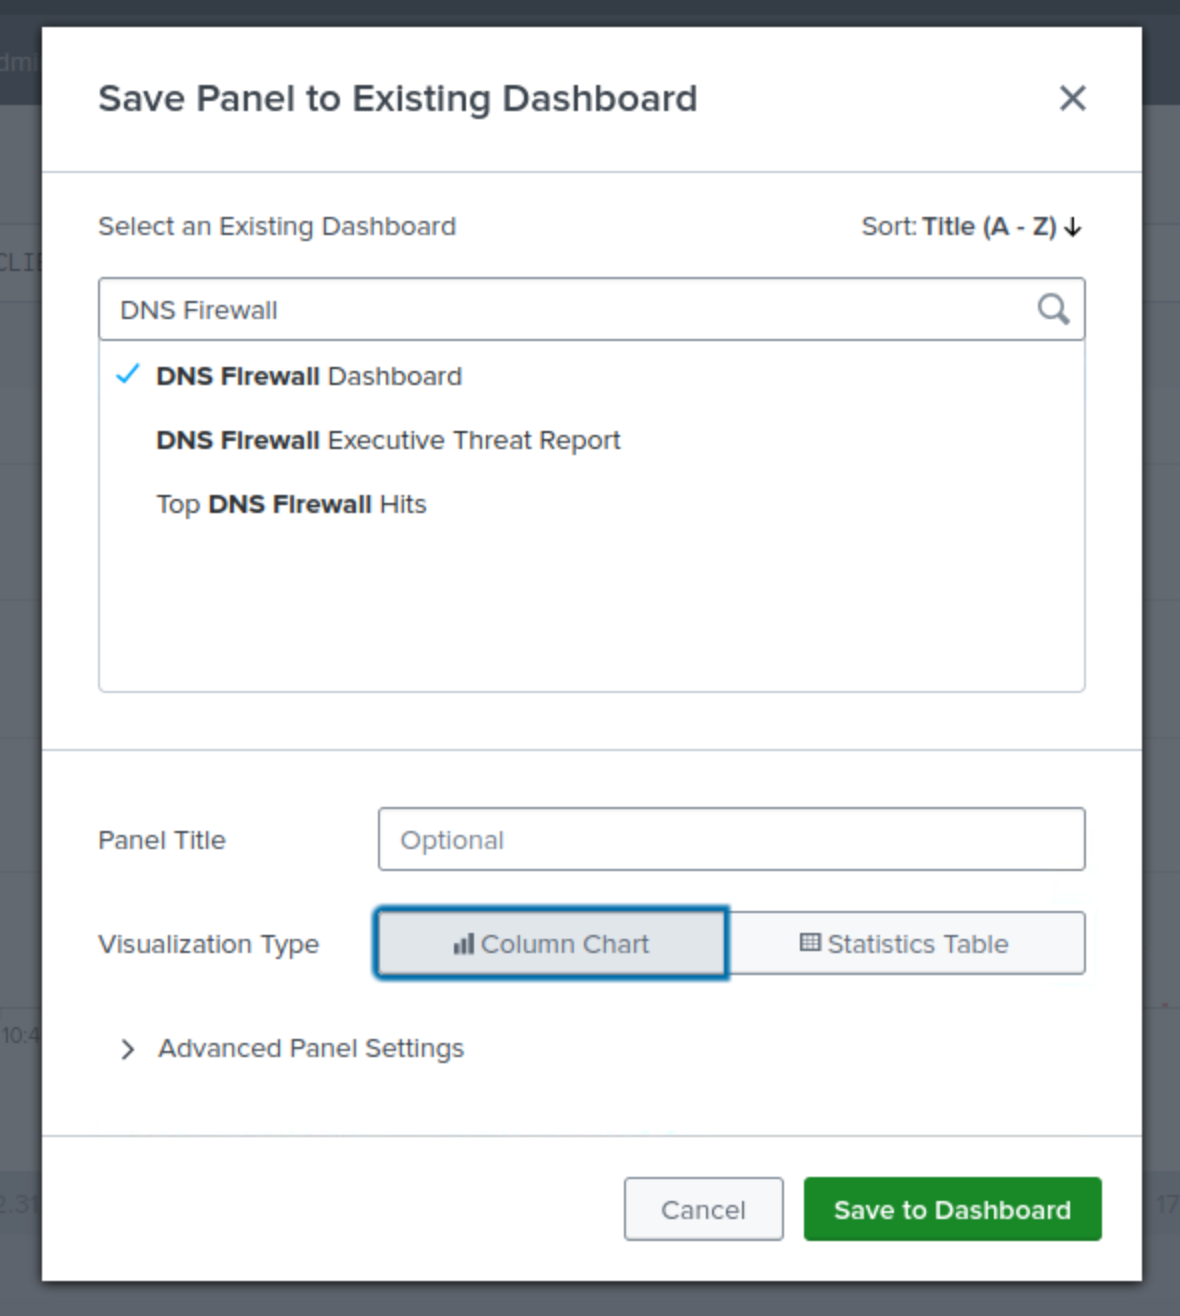
Click the Save As button.
-
Select the Existing Dashboard link.
-
Select DNS Firewall Dashboard as the dashboard where the panel will go.
-
Select Column as the Panel content.
-
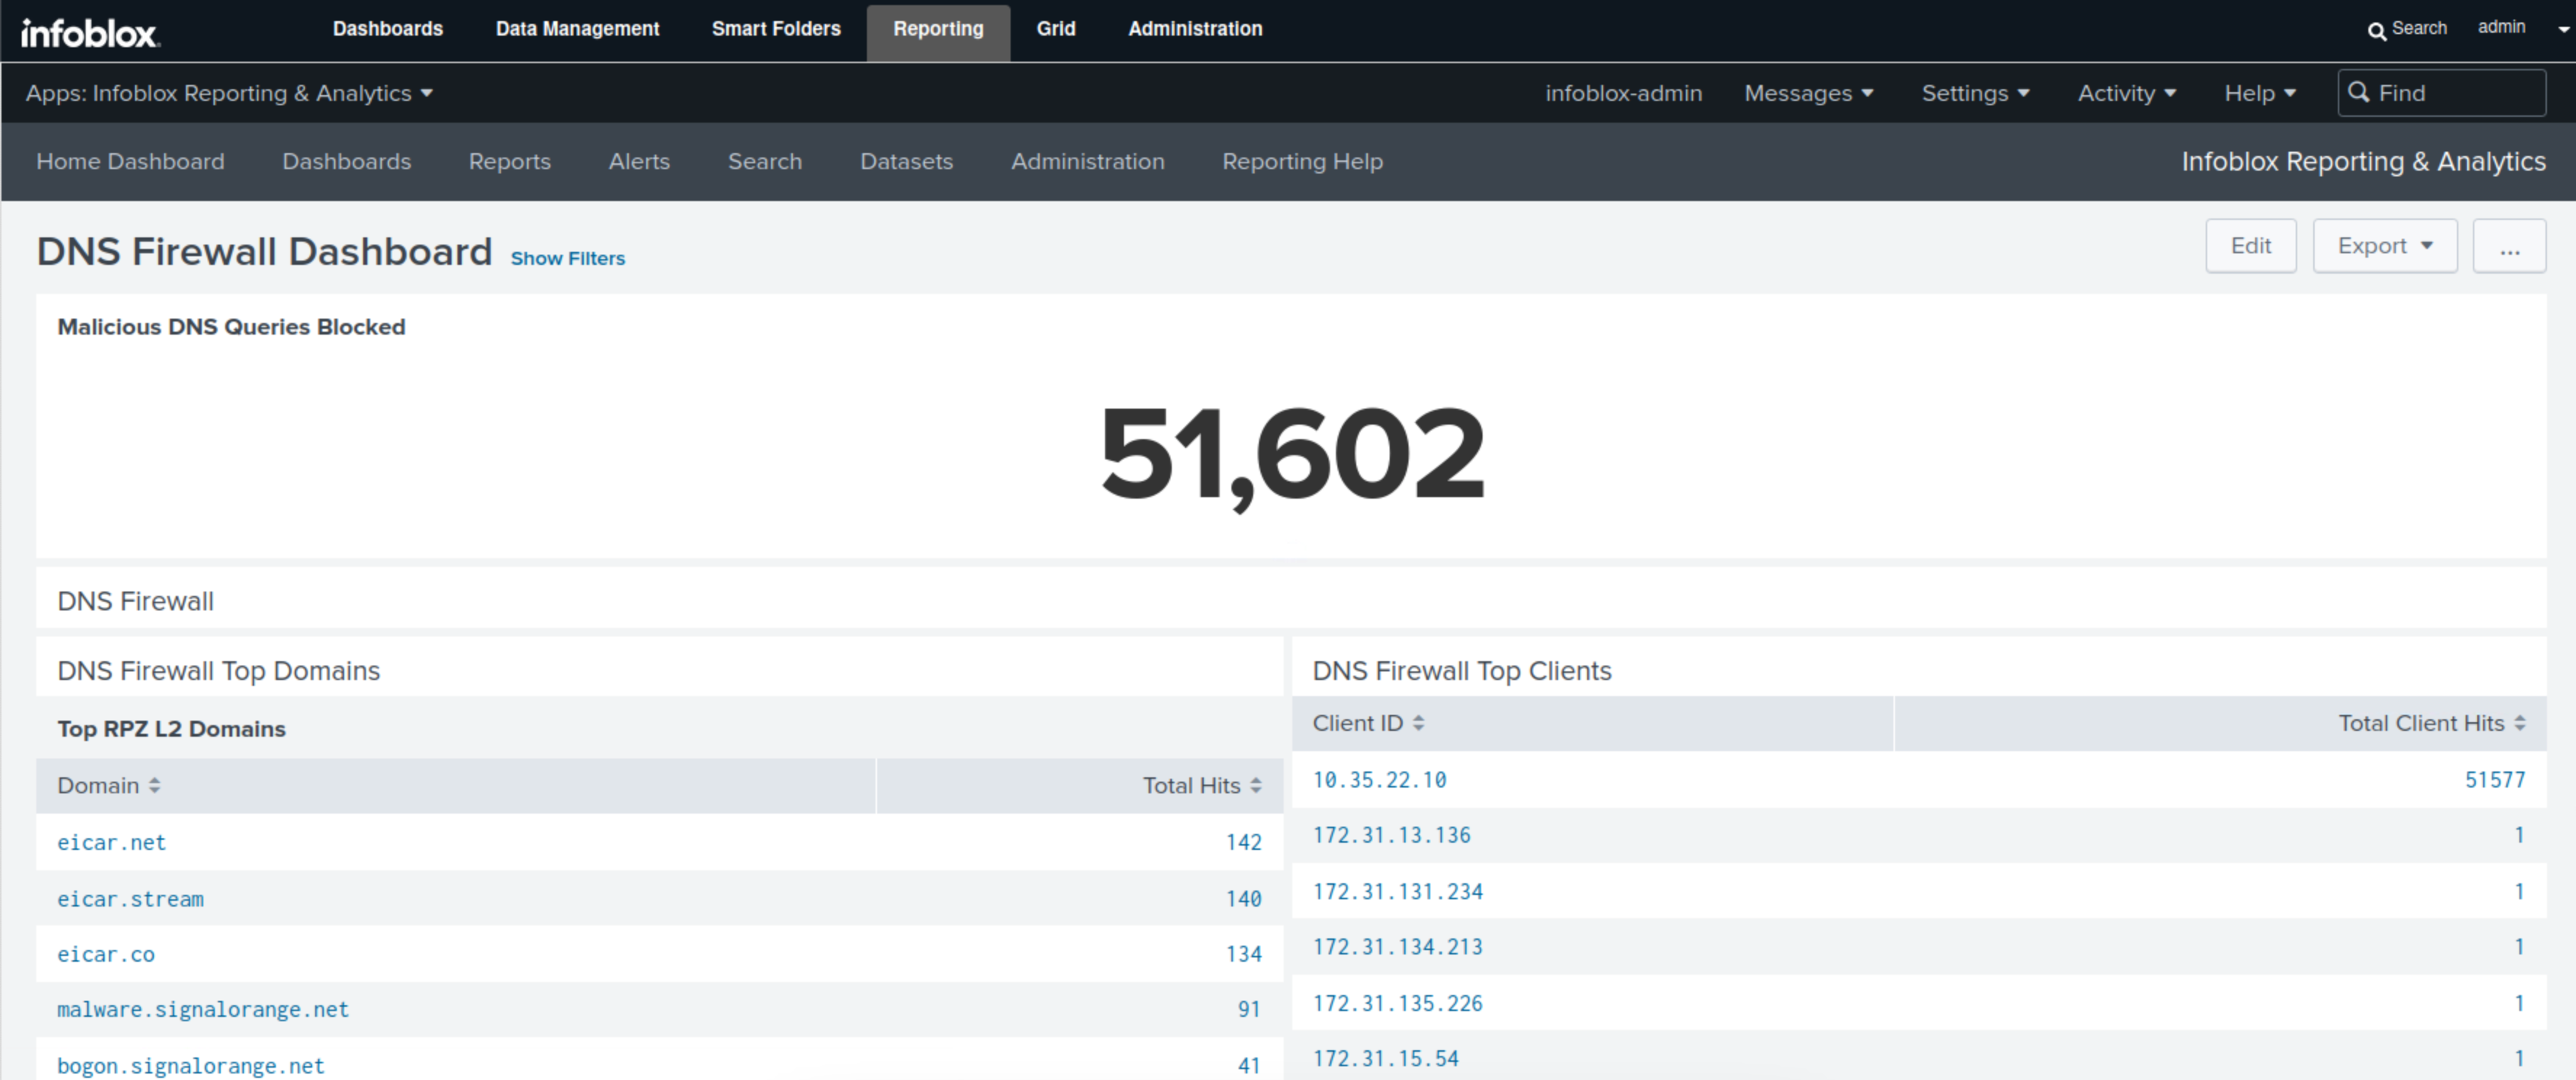
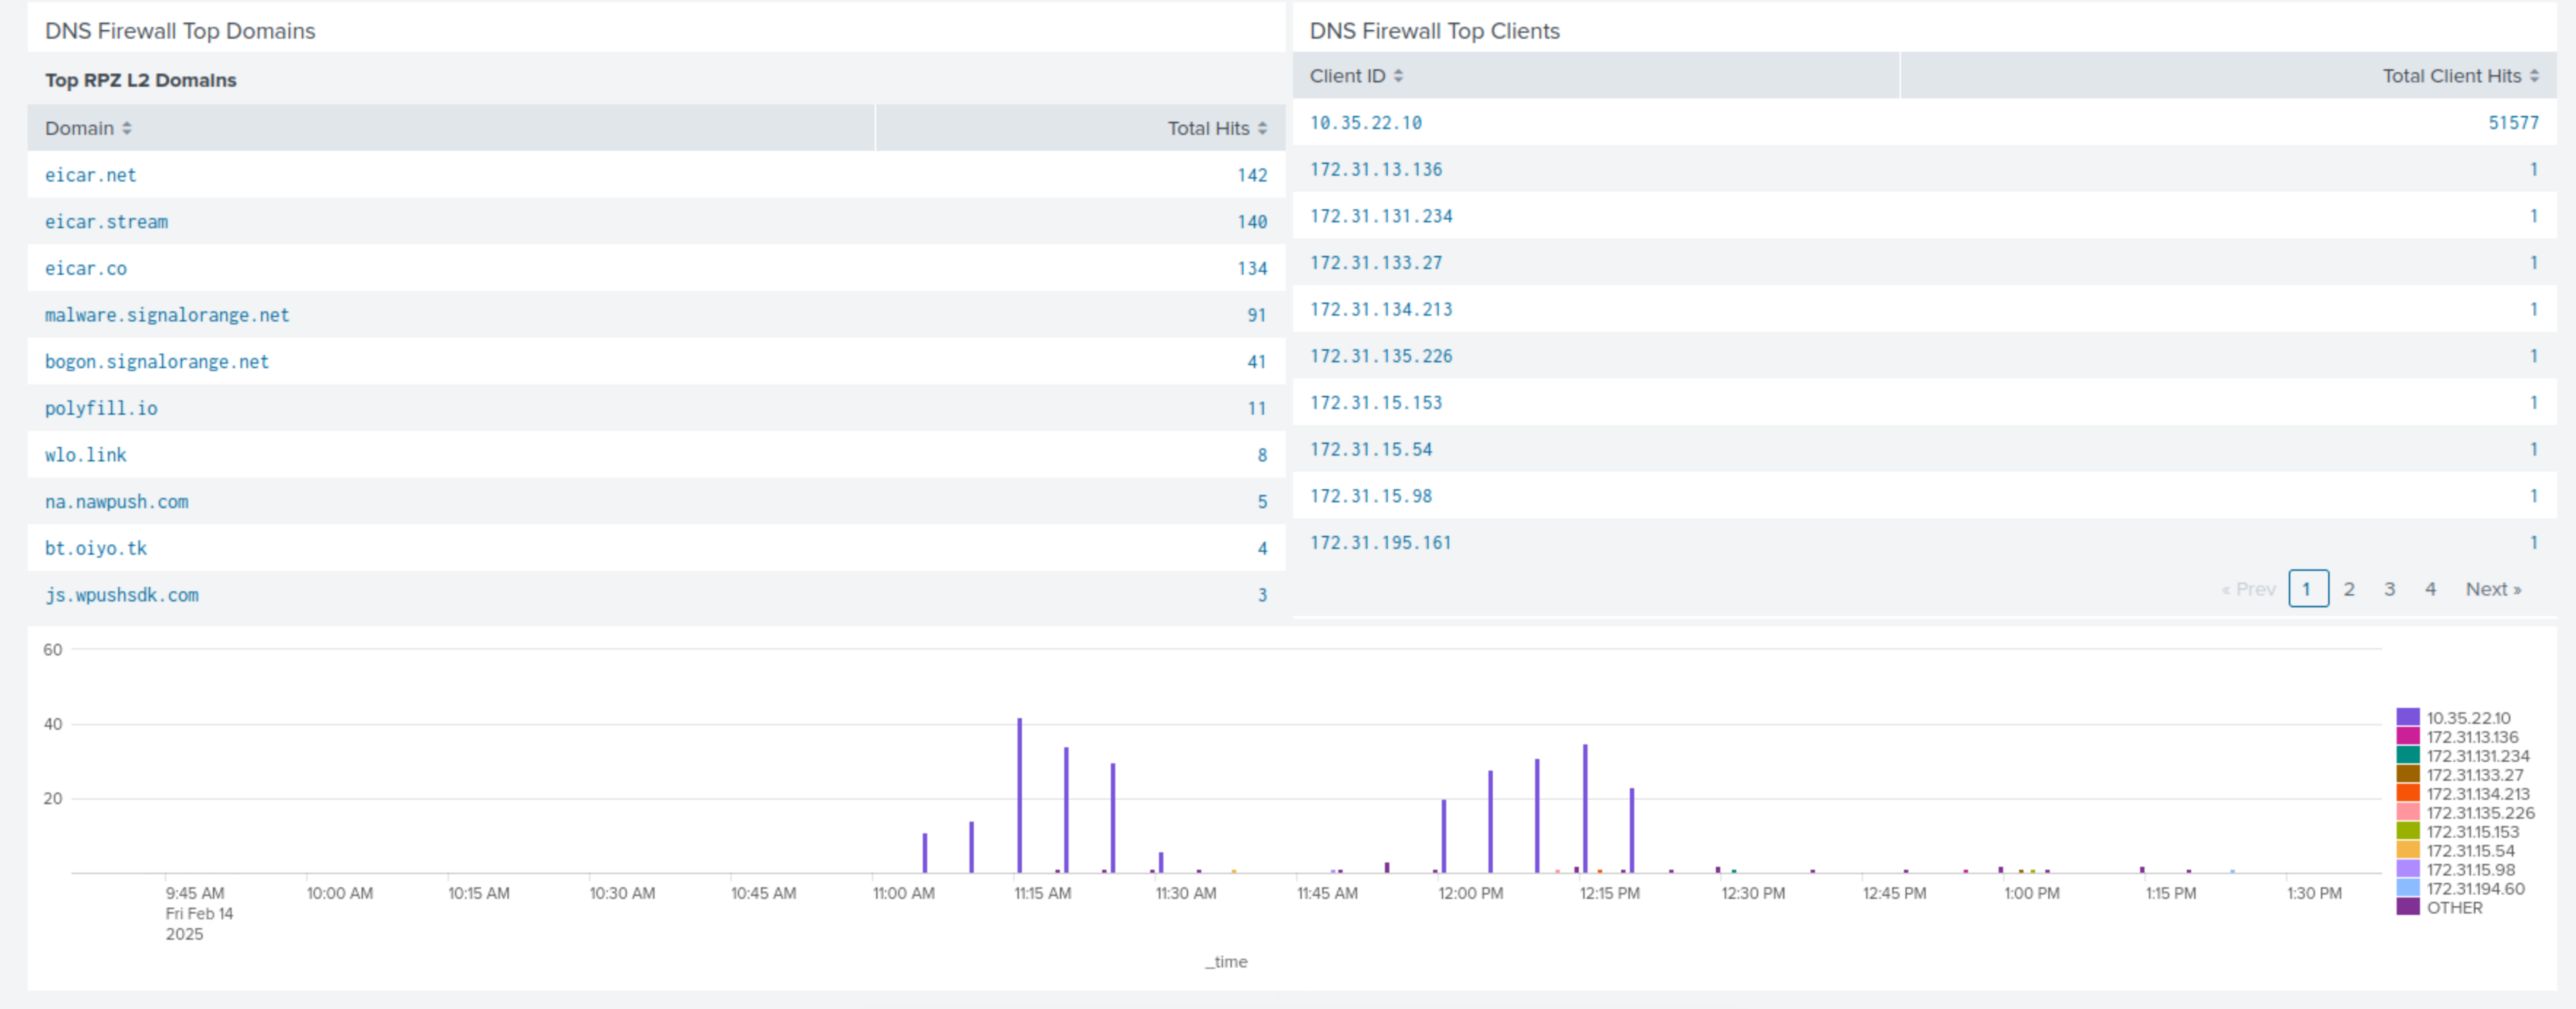
Click Save, then View Dashboard to look at the panel on your customized dashboard.
-
Scroll to the bottom of the dashboard to view the new panel.
-
-
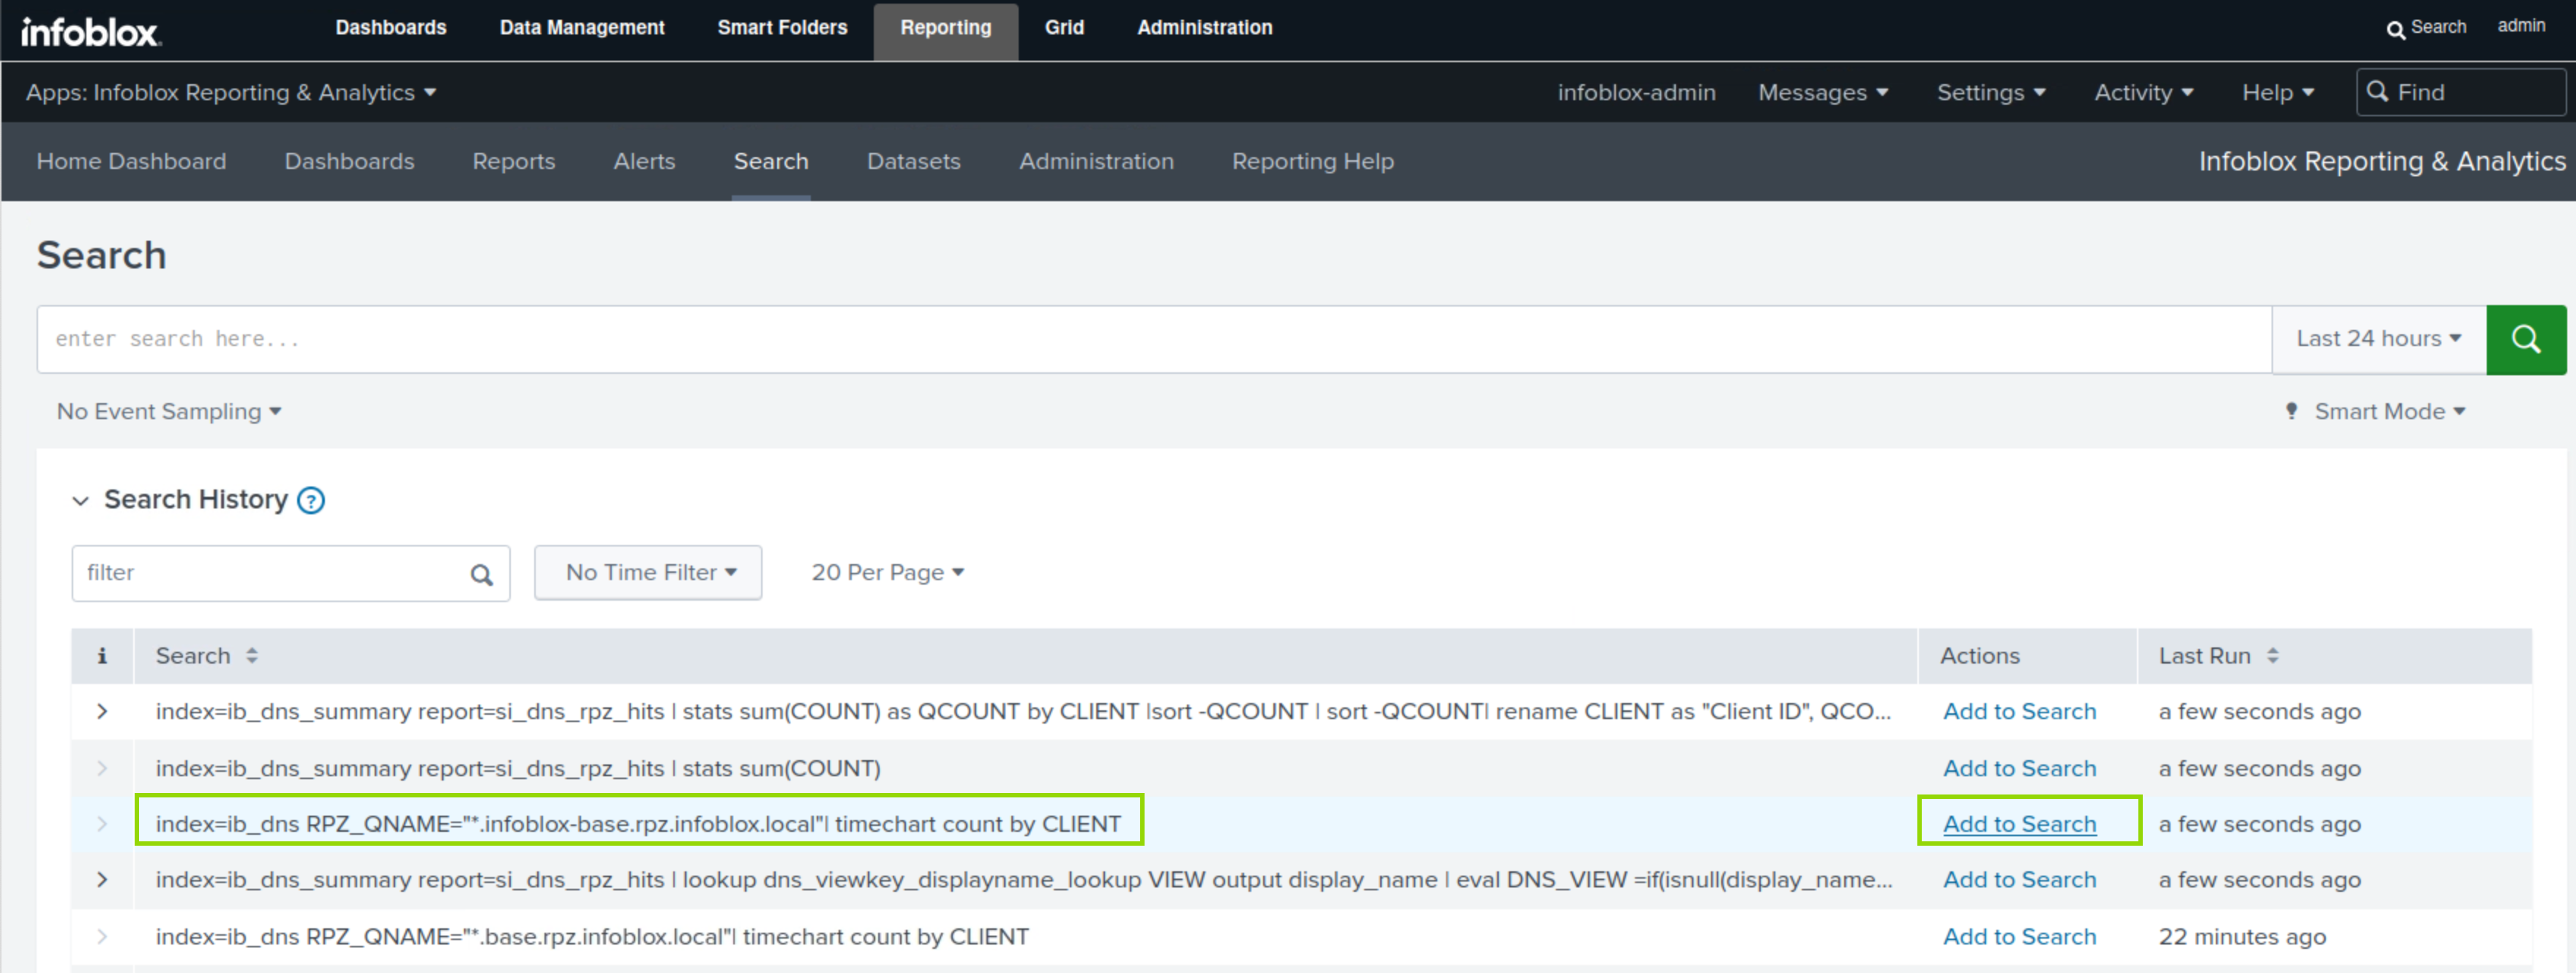
Navigate back to Reporting → Search.
-
Expand the Search history panel and locate the search query.
-
Click the Add to Search button.
-
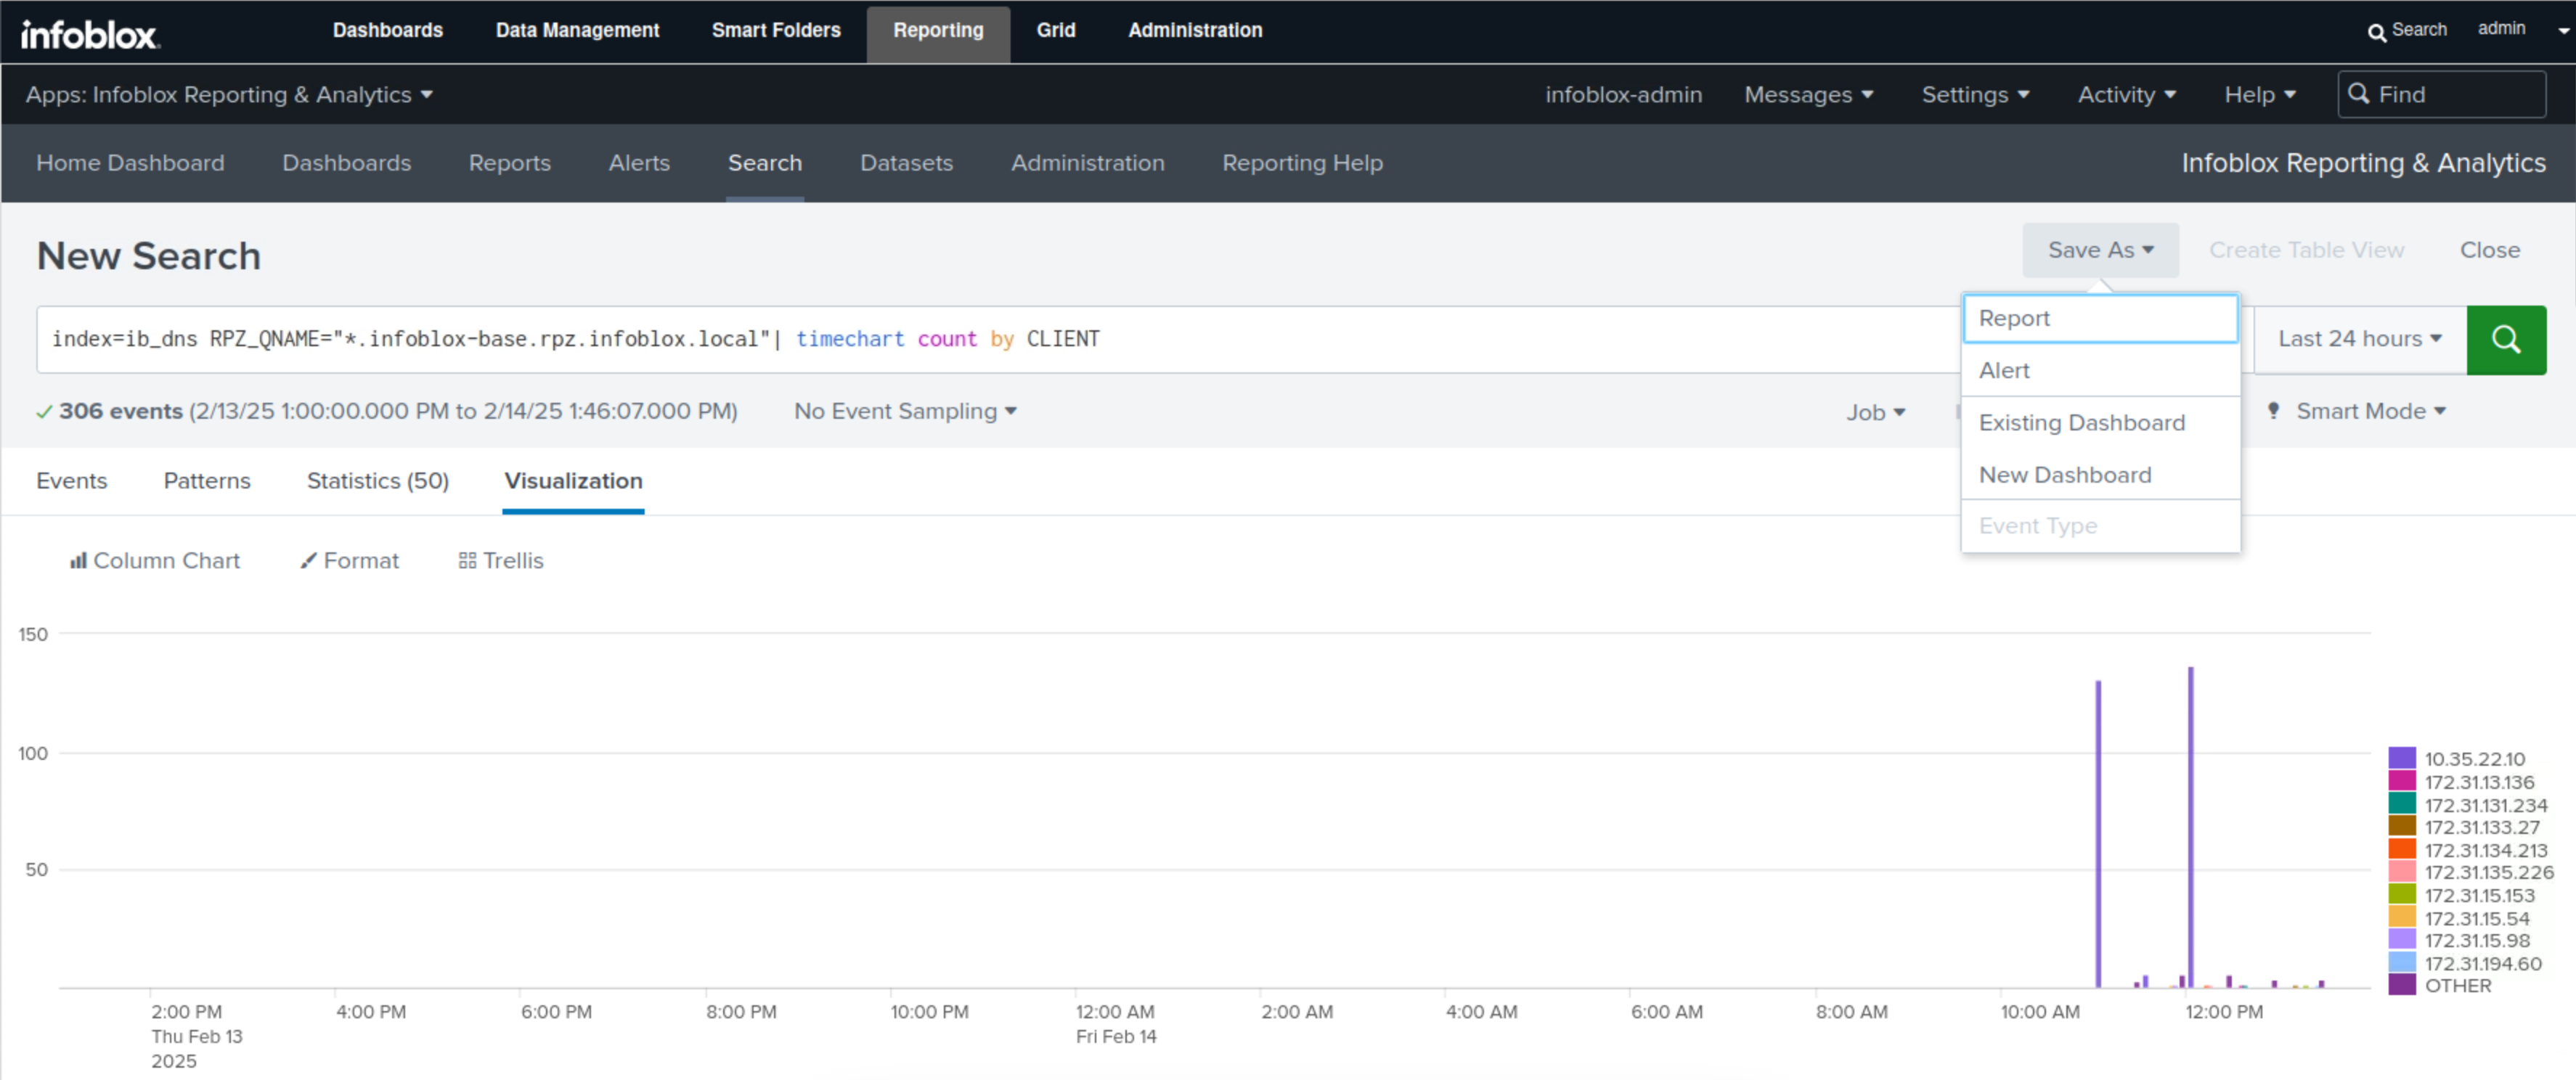
Click the Search button, then the Visualization button.
-
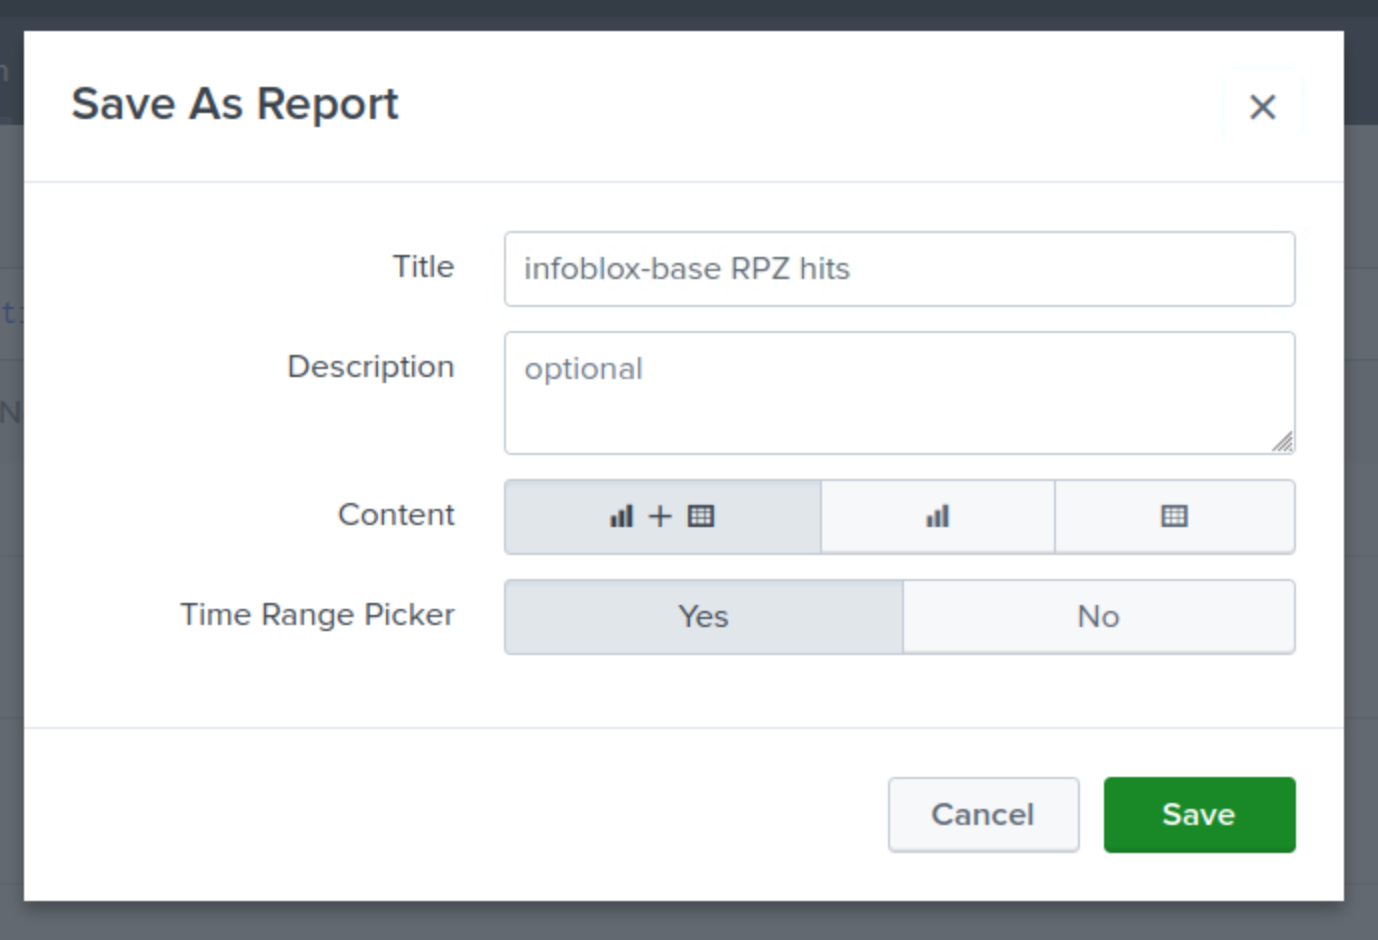
Click Save As and select Report.
-
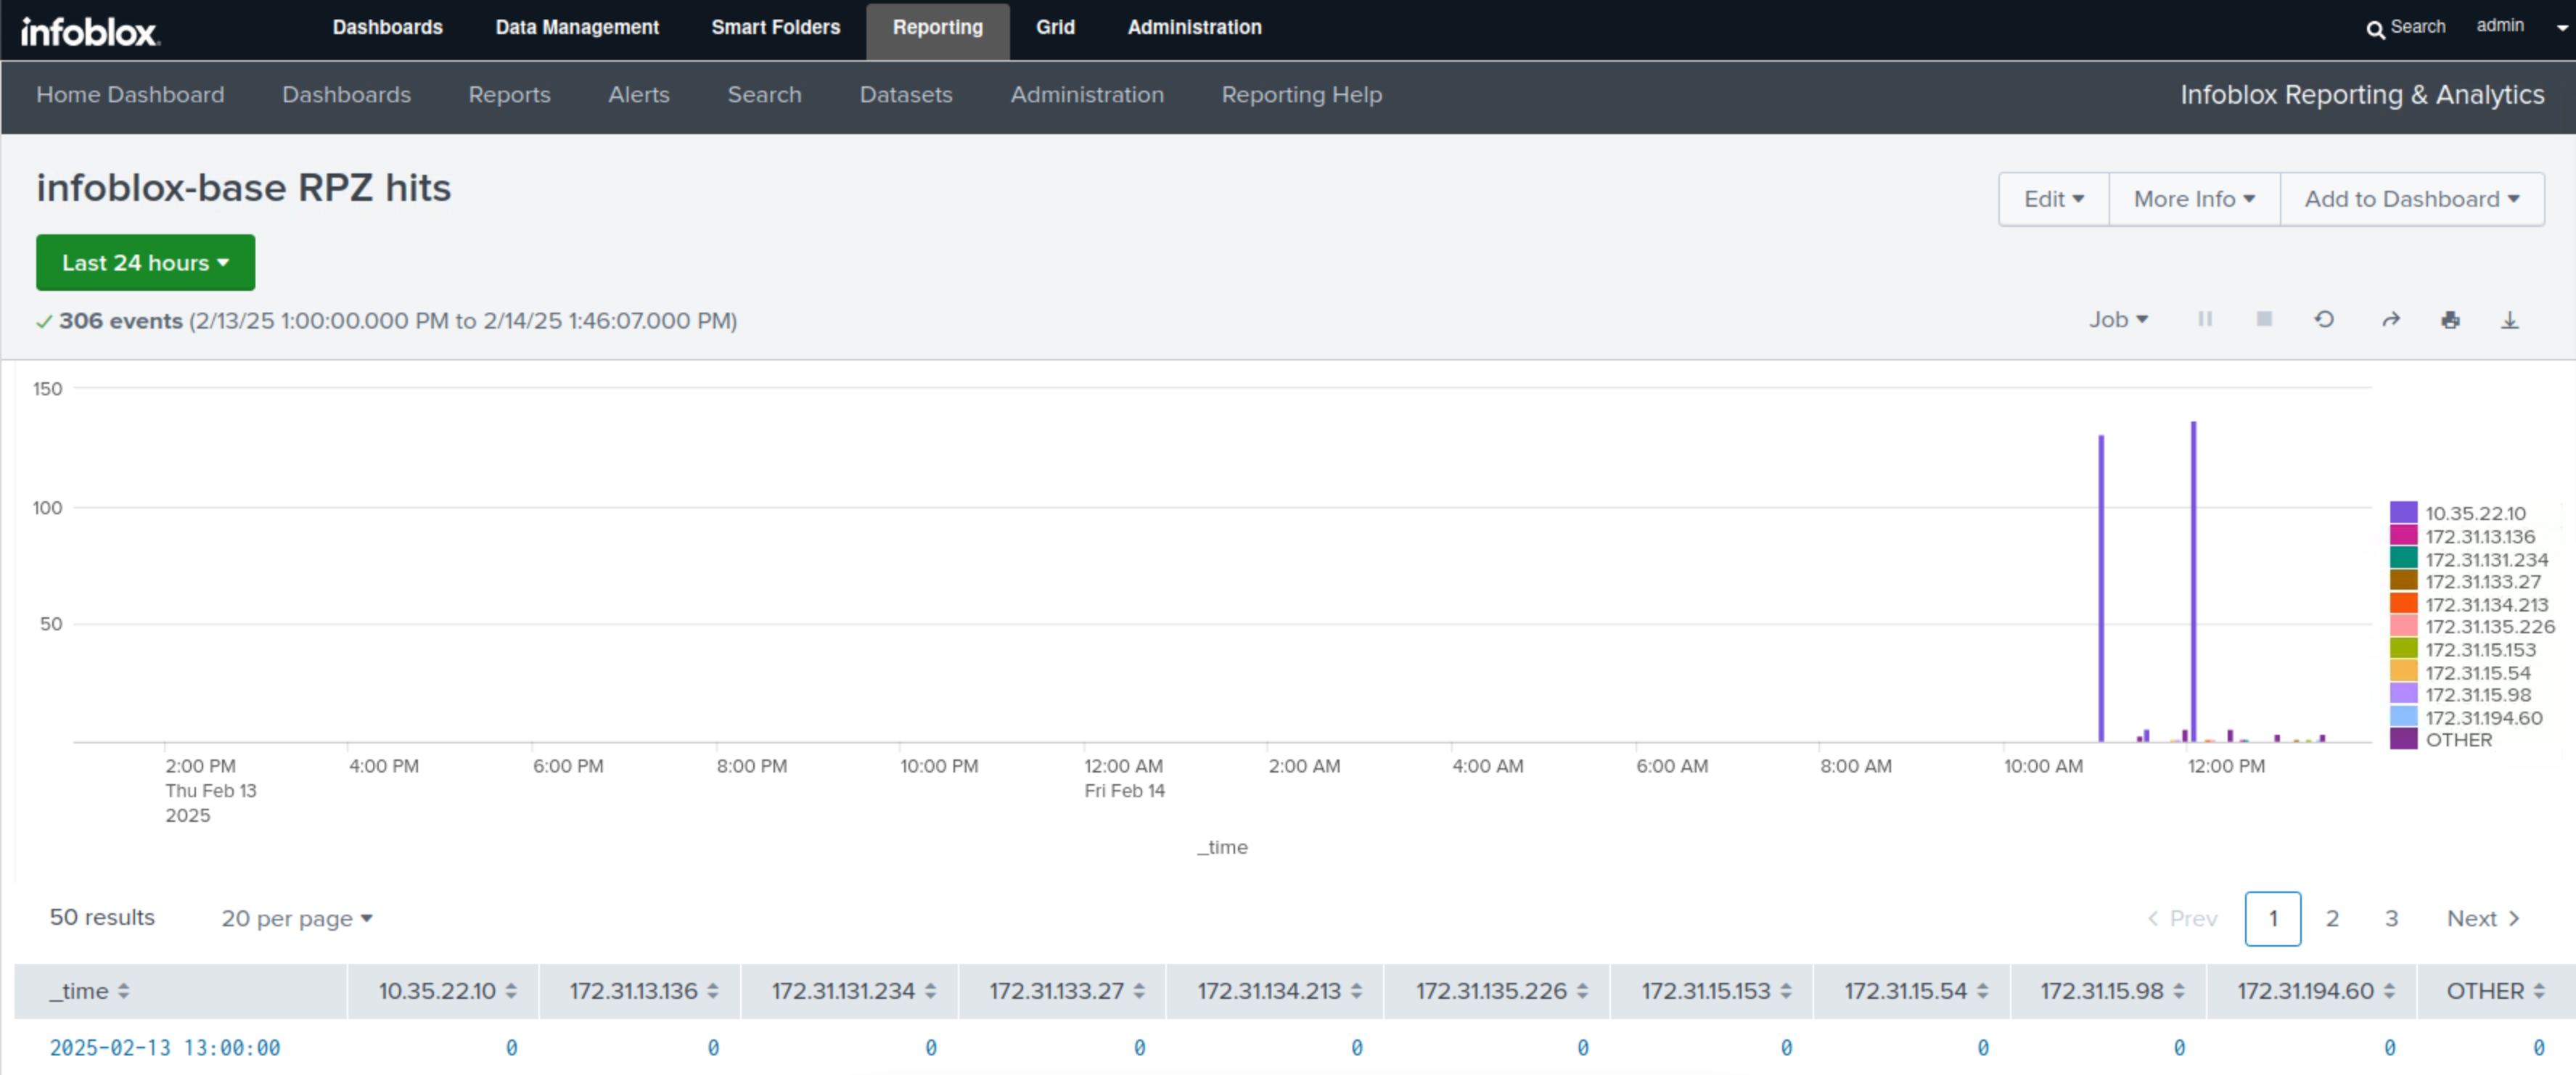
Enter infoblox-base RPZ hits for your report name.
-
Choose Chart+Table for Content.
-
Select Yes for Time Range Picker.
-
Click Save.
-
Click View to see the Report.
Task 5 Solution: Create an Email Alert triggered by RPZ Hits
In this task, you create an Alert for hits on the infoblox-base RPZ. When the Alert triggers, an email is sent to the NOC team. This is to help your organization to be more responsive to security incidents in the future.
-
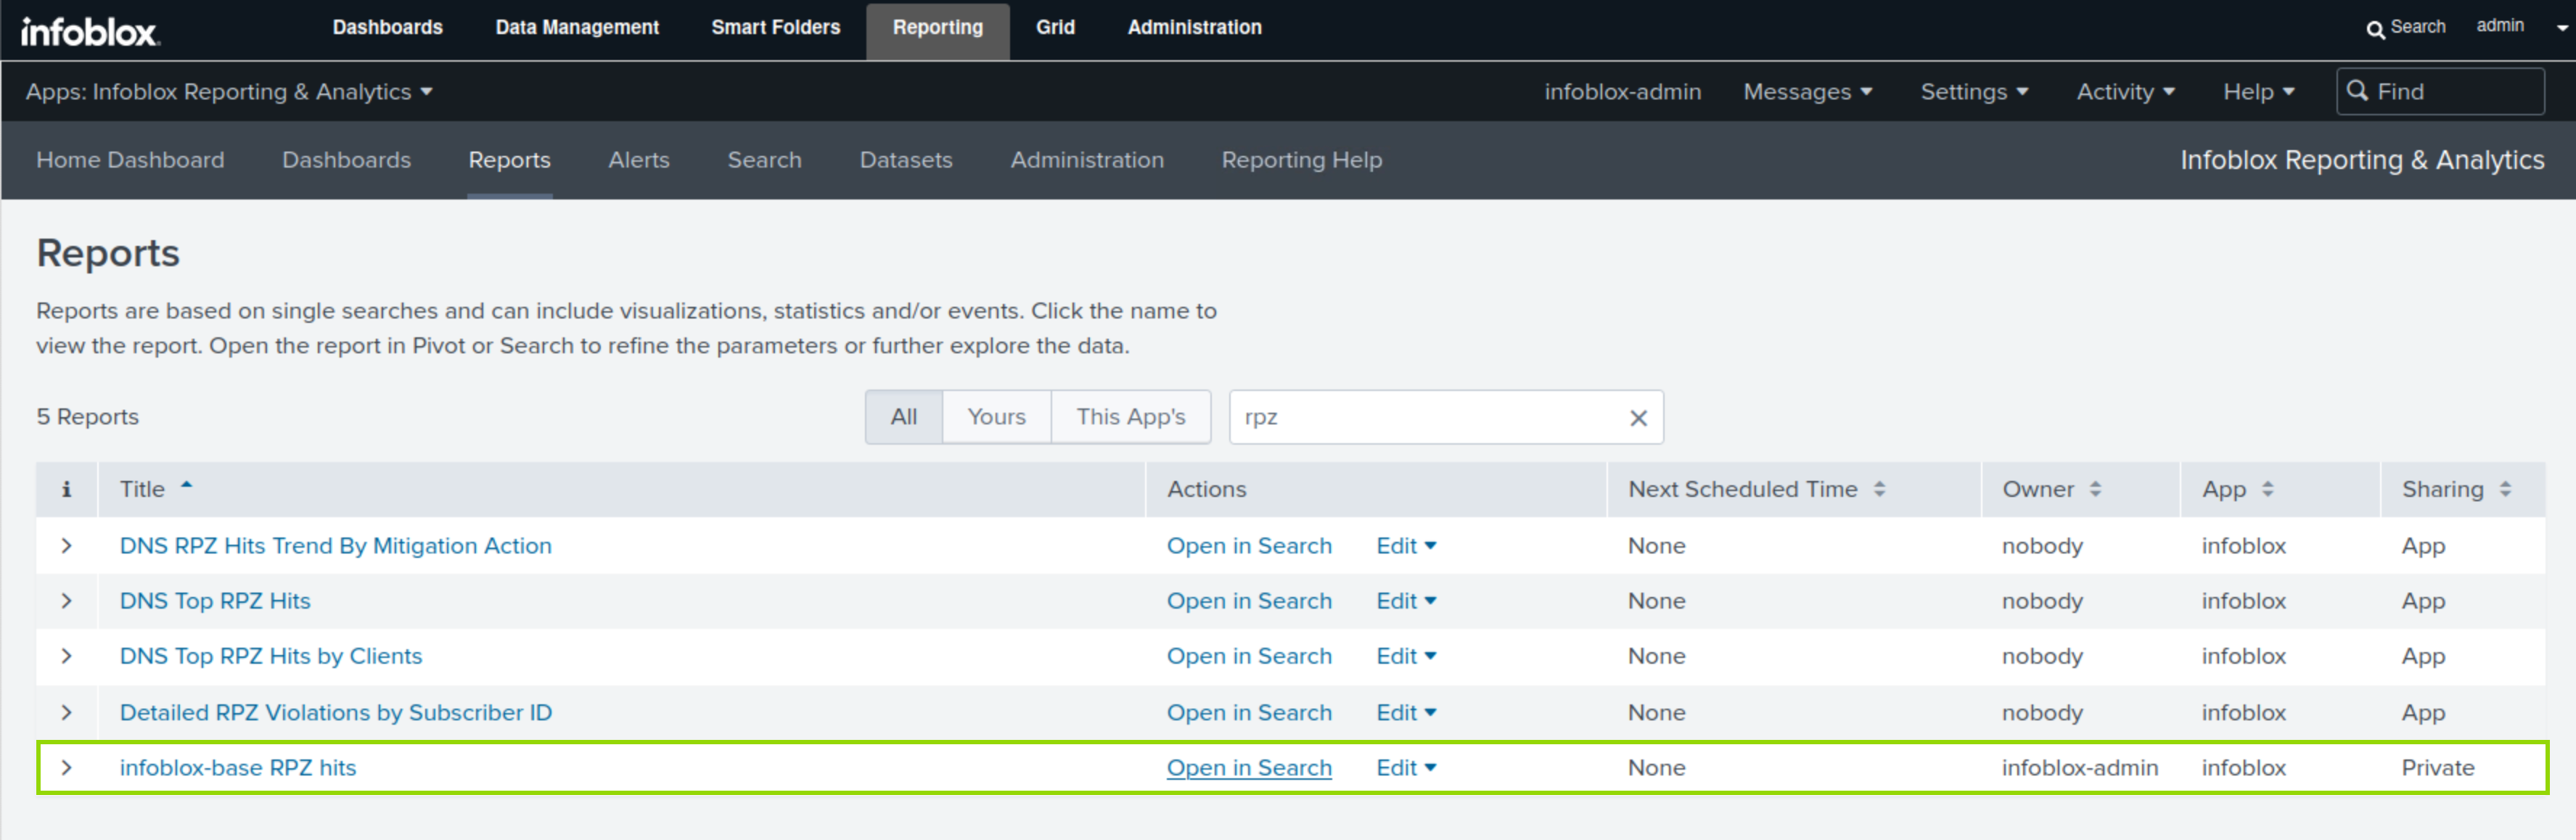
Navigate to Reporting → Reports.
-
filter down results to rpz using the search bar.
-
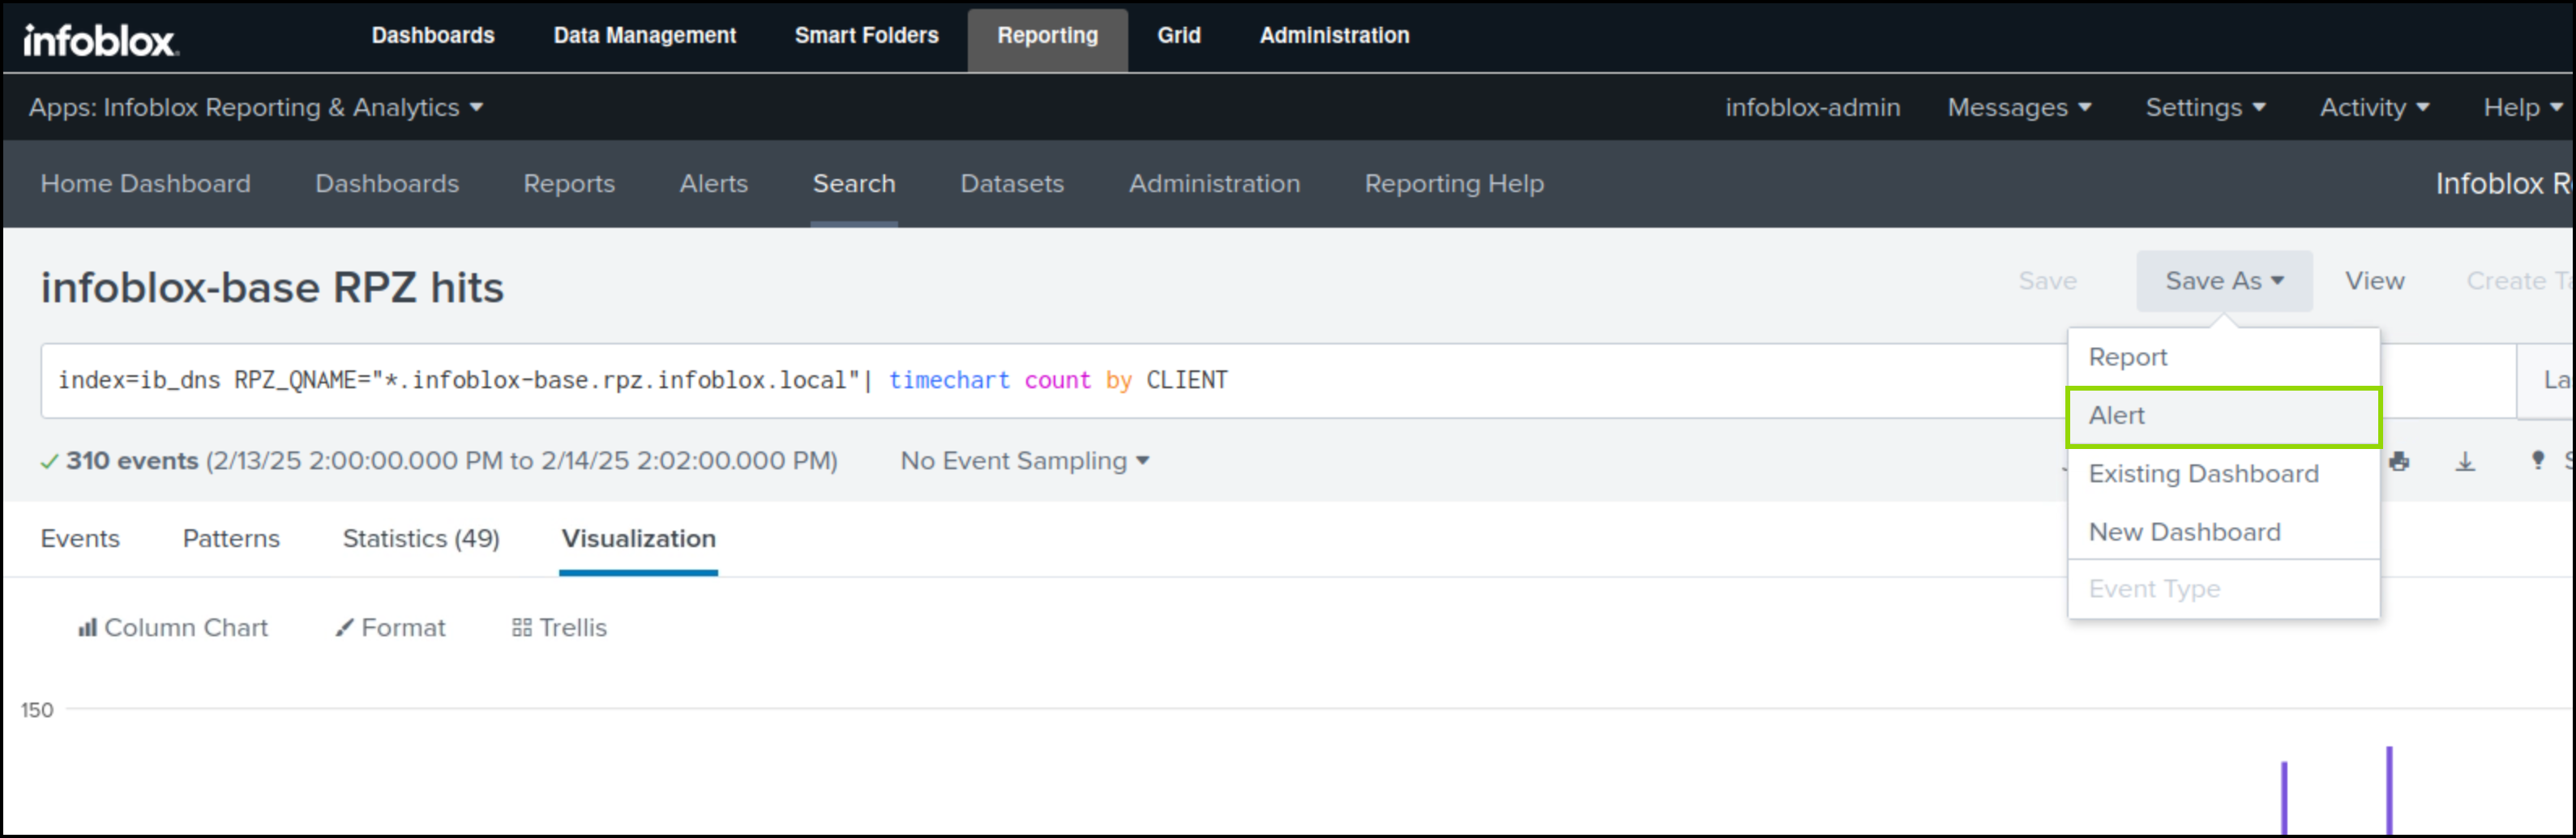
Click Open in Search for the infoblox-base RPZ Hits report.
-
Click Alert in the Save As list.
-
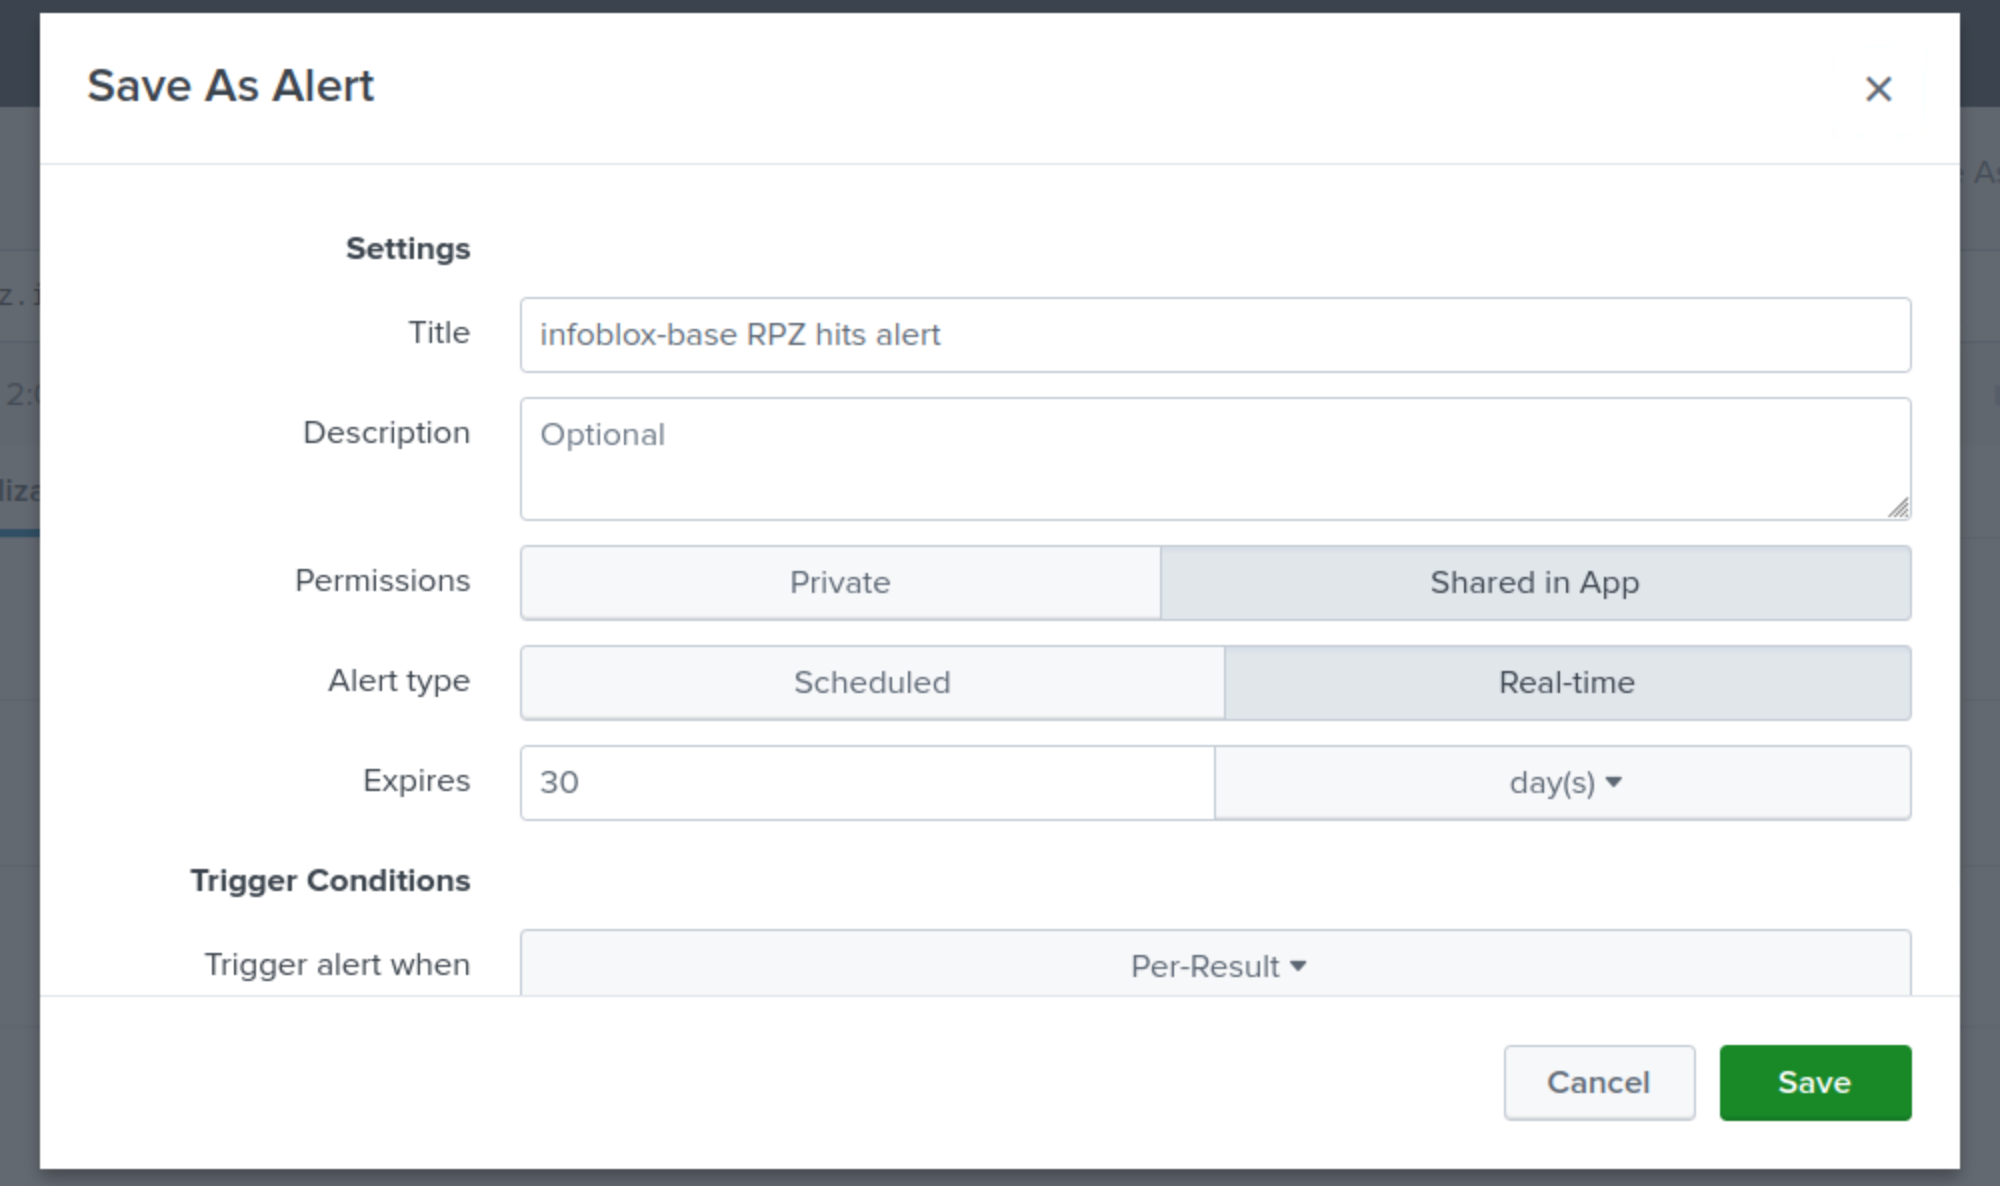
Specify a Title for the Alert infoblox-base RPZ hits Alert.
-
Choose Shared in App for Permissions,
-
Choose Real-Time for Alert Type.
-
Set the Expire value to 30 days.
-
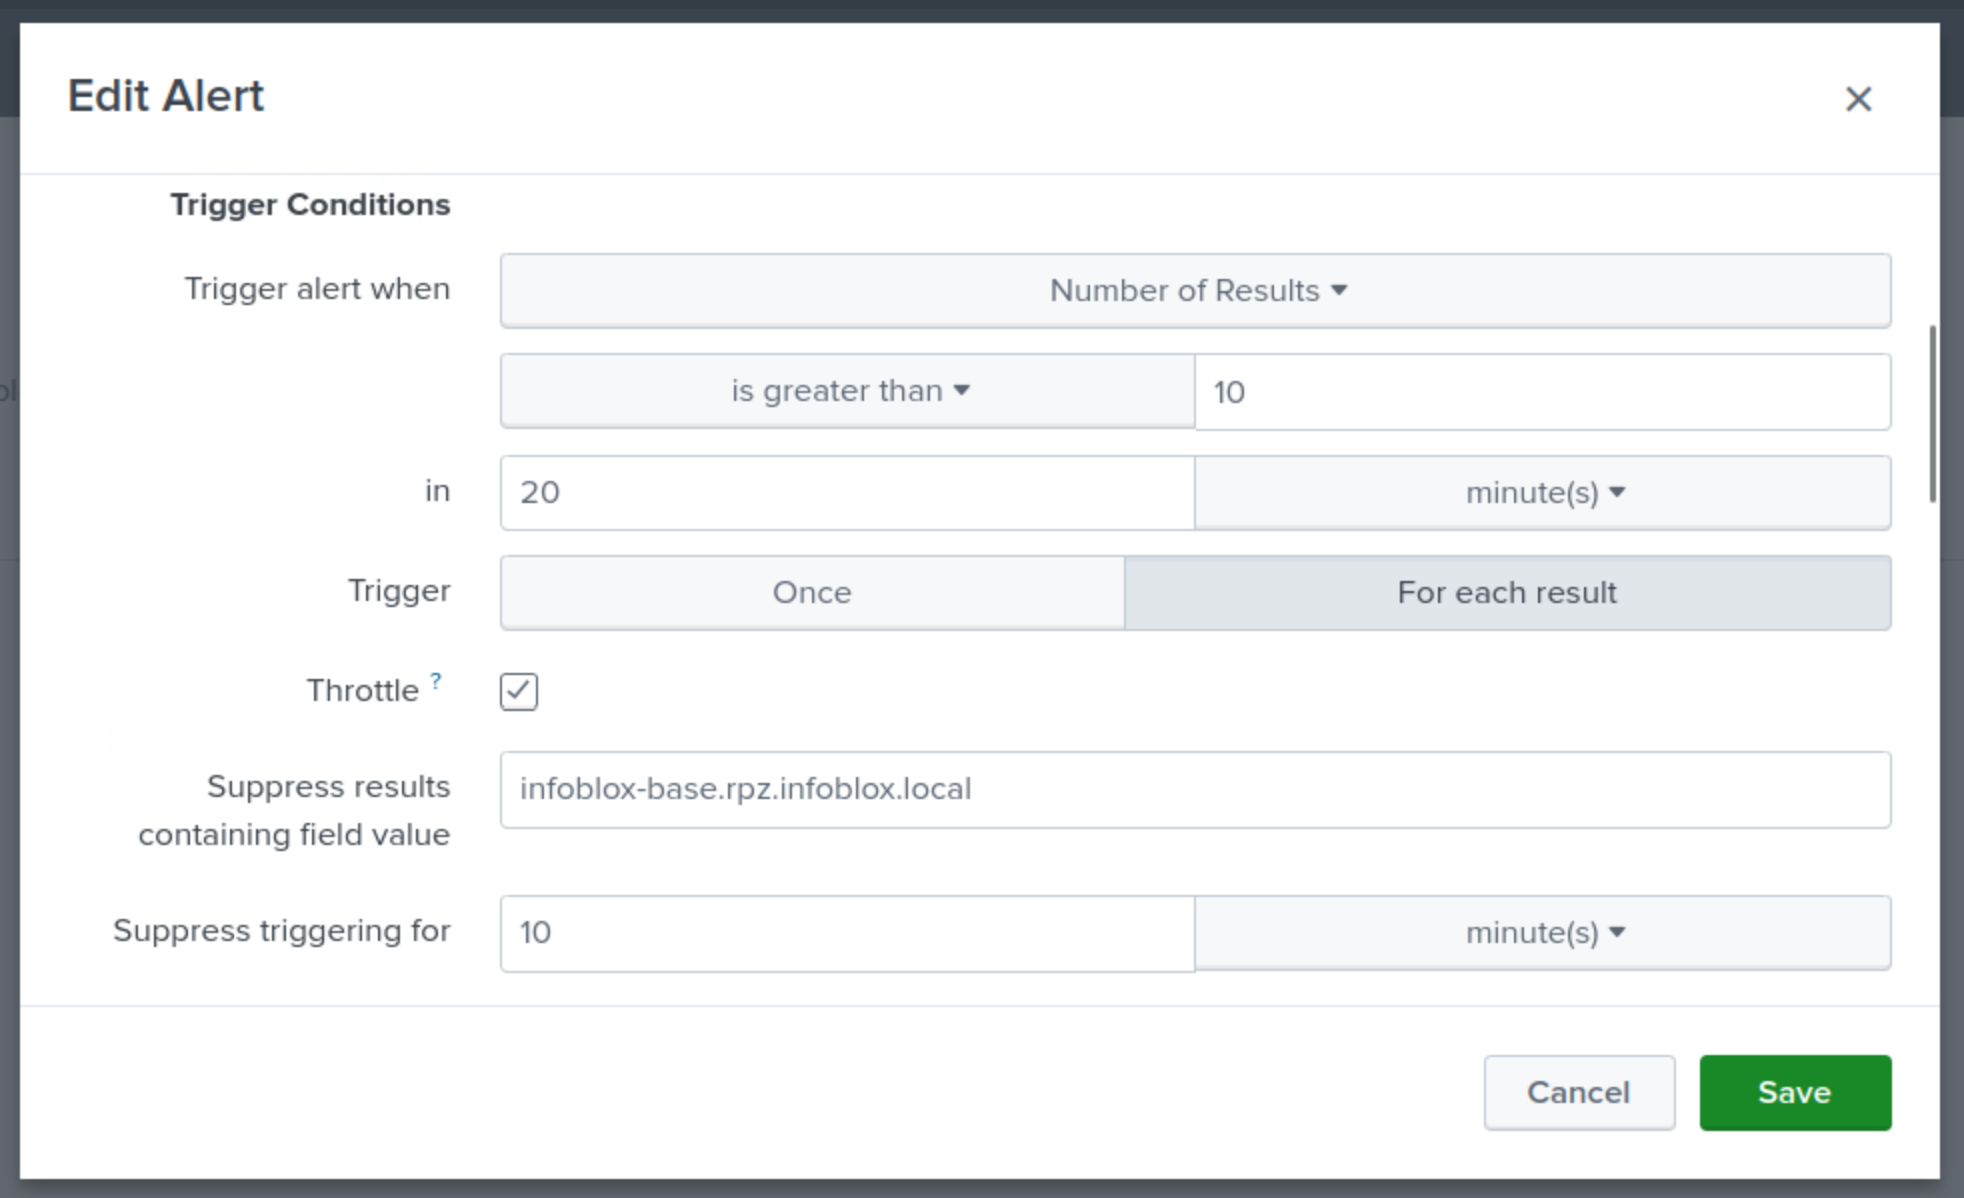
Set the Trigger alert when value to Number of Results is greater than 10 in 20 minutes.
-
Set Trigger value to For each Result.
-
Set the Suppress results containing field value field to infoblox-base.rpz.infoblox.local
-
Set the Throttle value to suppress triggering for 10 minutes.
-
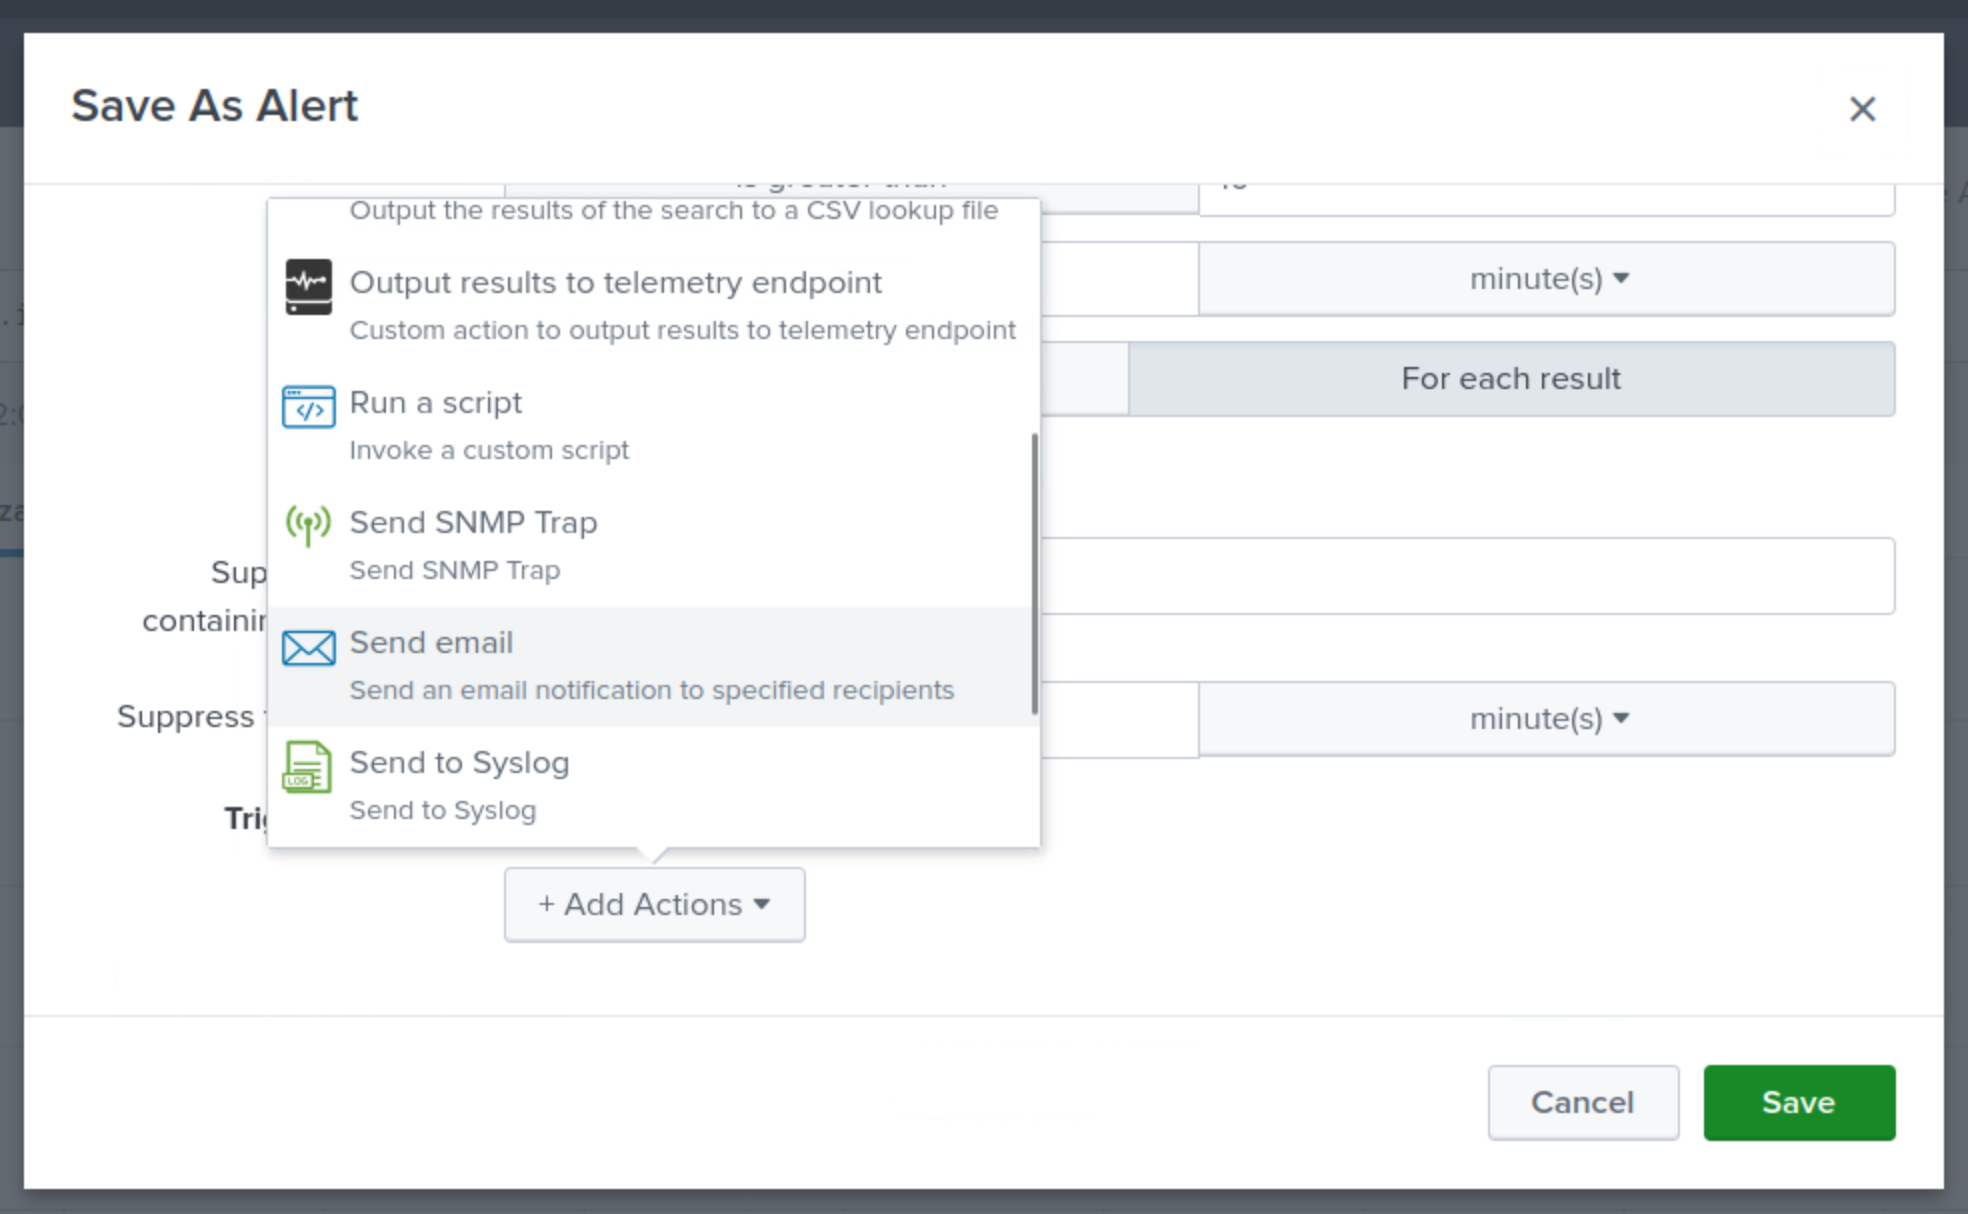
Click the Trigger Action button.
-
Select Send Email.
-
Send the email to noc@techblue.net
-
Set the Priority to High.
-
Select the check boxes to include Search String, Trigger Condition, and Attach PDF.

-
Click Save.