Using NIOS Advanced DNS Protection (ADP) Monitoring and Reporting (1528)
This lab requires a lab environment with Advanced DNS Protection capability!
Please ensure that you have deployed a NIOS 9.0 Lab Environment (with DNS Infrastructure Protection) lab environment.
In NIOS version 9.0.8, Advanced DNS Protection (ADP)/Threat Protection was rebranded to DNS Infrastructure Protection (DNS-IP). Depending on your NIOS version, the feature may be displayed differently in the user interface.
Scenario
Your organization has enabled Advacned DNS Portection (ADP) on DNS servers. In this lab, you will observe ADP activity, Grid health and review dashboards and reports to understand traffic patterns and identify potential issues.
Estimate Completion Time
35 to 40 Minutes
Credentials
Description | Username | Password | URL or IP |
|---|---|---|---|
Grid Manager UI | admin | infoblox |
Learning Content
Lab Initiation
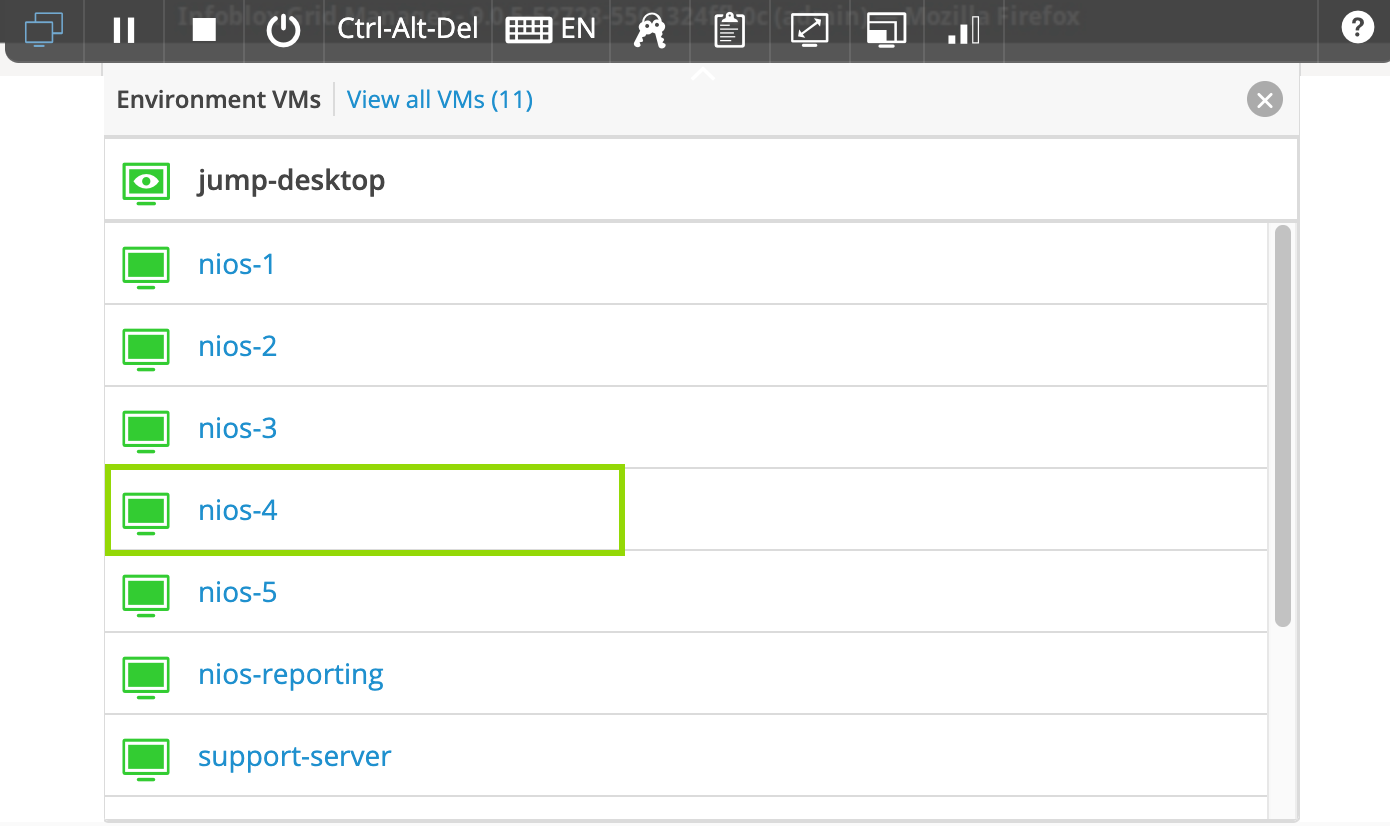
Access jump-desktop
Once the lab is deployed, you can access the virtual machines required to complete this lab activity. To initiate the lab, click on the jump-desktop tile and login to the Linux UI:
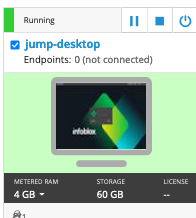
Username: training
Password: infoblox
Initiate lab
To initiate the lab, double-click the Launch Lab icon on the Desktop.

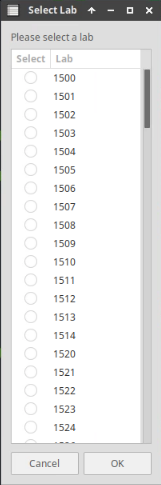
Launch Lab
Choose the lab number from the list and click OK.
After clicking OK, you will see a pop-up message with a brief description of the lab task. If the description looks correct, click Yes to continue lab initiation.
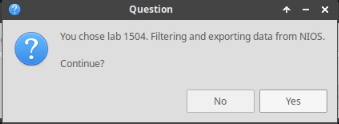
Lab initiation will take a couple of minutes to finish.
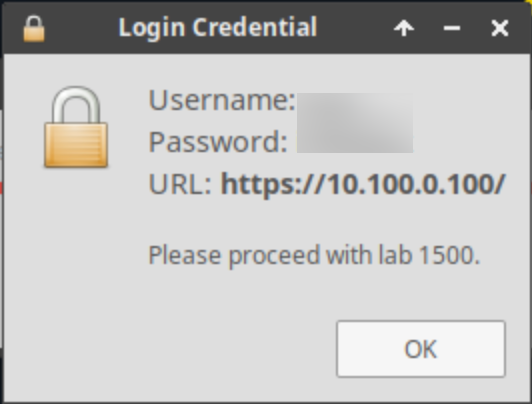
Once complete, you will see another pop-up message with the login credentials and the URL for the Grid Manager’s User Interface. Note that the credentials may differ from those from prior labs.
Tasks
Set up NIOS-4 to be a Threat Protection (ADP) enabled Grid Member
Verify Threat Protection events in Syslog
Analyze the Grid Status and Health using Security Dashboard Widgets
Investigate the available Reporting Server Dashboards for Threat Protection (ADP)
Configure SNMP traps
Task 1: Set up NIOS-4 to be a Threat Protection (ADP) enabled Grid Member
Log into NIOS-4 VM using the credentials (admin/infobox), reset the VM to factory settings using the command
reset all, and validate that it has been reset using the commandshow network.Edit the network settings using the following command
set networkand the information below:IP Address: 203.0.113.105
Netmask: 255.255.255.0
Gateway: 203.0.113.1
VLAN Tag: Untagged [Enter]
IPv6 settings: n
Become a grid member: n
Set the management interface settings using the command
set interface mgmtand the information below:Enable Management port: y
IP address: 10.35.22.105
Gateway: 10.35.22.1
IPv6 settings: n
Restrict access: y
Add the VM to the grid using the command
set membershipand the information below:Grid Master VIP: 10.100.0.100
Grid name: Infoblox [Enter]
Grid Secret: test
Enable grid services on Management interface: y
Load Threat Protection(ADP) licenses into the grid from the directory:
/mnt/shared/licenses/9.0/, and load the file ADP.lic
Task 2: Verify Threat Protection events in Syslog
View Syslog records generated on the extibns.techblue.net member to verify that Threat Protection rules are being triggered.
Task 3: Analyze the Grid Status and Health using Security Dashboard Widgets
Use the Security Dashboard to investigate the status of the Grid name servers, ibns1.techblue.net and extibns.techblue.net
Use the Security Dashboard to investigate the recent spike in DNS traffic.
Task 4: Investigate the available Reporting Server Dashboards for Threat Protection (ADP)
Please allow 25 to 30 minutes for the Reporting Server to pull data off the Grid and populate its Dashboards and Reports. This waiting time is only required for this simulated lab environment, as the Grid and the Reporting Server haven’t had enough time to sync.
Use the Reporting Server to provide information about recent DNS spikes and what Threat Protection rules were triggered. If prompted to setup the reporting server, enter the following File Server Settings:
Configuration | Value |
Username | training |
Password | infoblox |
Protocol | SCP |
Host/ IP Address | 10.100.0.205 |
Port | 22 |
Path | /home/training/Documents/ReportingData |
Task 5: Configure SNMP traps
Enable SNMP Traps for the Grid, enable SNMP v1/v2, and Enter public for the community string.
Use the IP address 10.100.0.10 for the trap receiver.
Solutions
Task 1 Solution: Set up NIOS-4 to be a Threat Protection (ADP) enabled Grid Member
In this task, we are setting the NIOS-4 virtual machine to join the Grid by resetting its configurations, then setting the correct networking settings on the LAN1 interface and enabling its management interface to be used for remote management by the Grid master after setting the interface’s networking settings. After verifying that NIOS-4 is part of the grid under the name extibns.techblue.net, we will add ADP licenses to the Grid, ensuring extibns.techblue.net has Threat Protection enabled. This is only needed in this lab environment, as NIOS-4 is used for other purposes in different labs.
Log into NIOS-4 VM using the credentials (admin/infoblox).
Reset the VM to factory settings using the command
reset alland answering y to the confirmation question.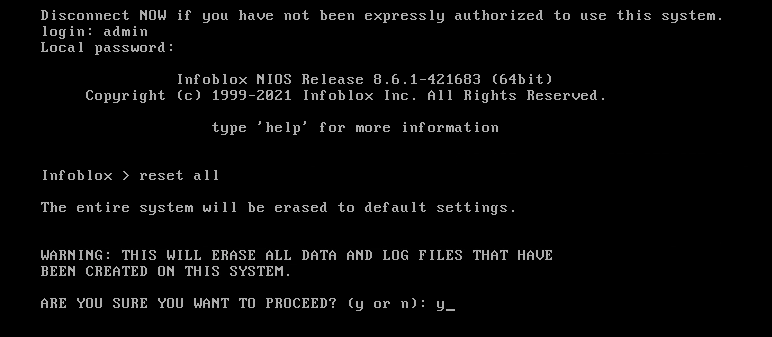
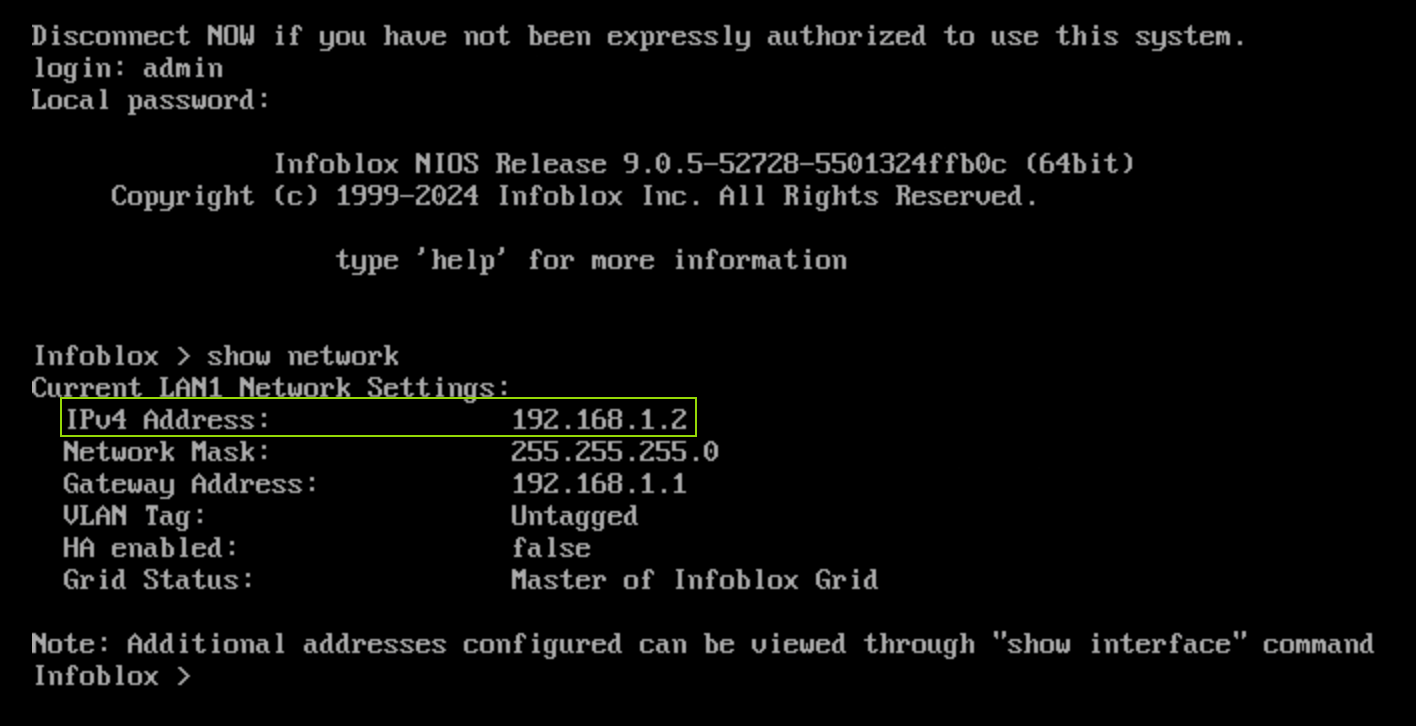
Log back into the NIOS-4 VM and validate that it has been reset by using the command
show network.The interface uses the default IP address 192.168.1.2, which confirms that the VM has been reset.
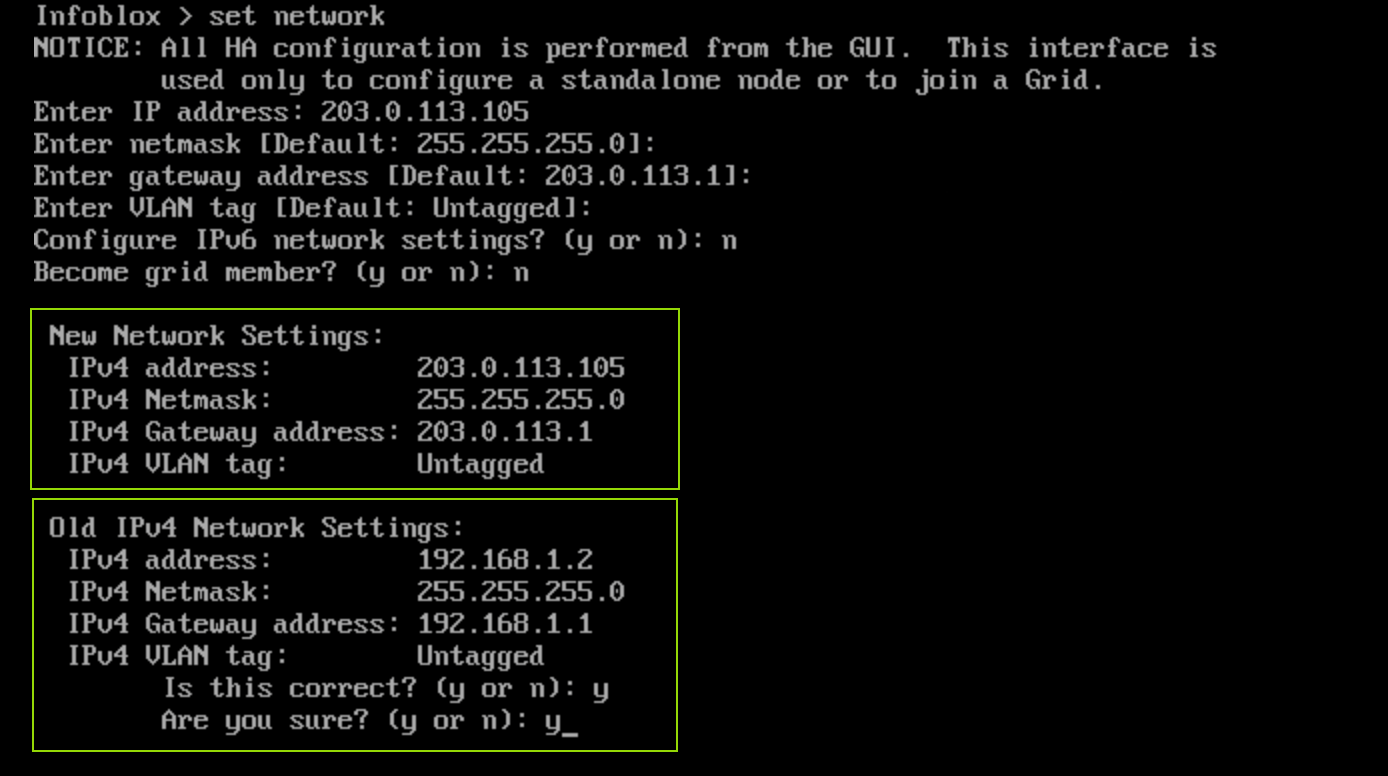
Log back into the NIOS-4 VM and edit the network settings using the command
set network, using the following information:IP Address: 203.0.113.105
Netmask: 255.255.255.0 [Enter]
Gateway: 203.0.113.1 [Enter]
VLAN Tag: Untagged [Enter]
IPv6 settings: n
Become a grid member: n
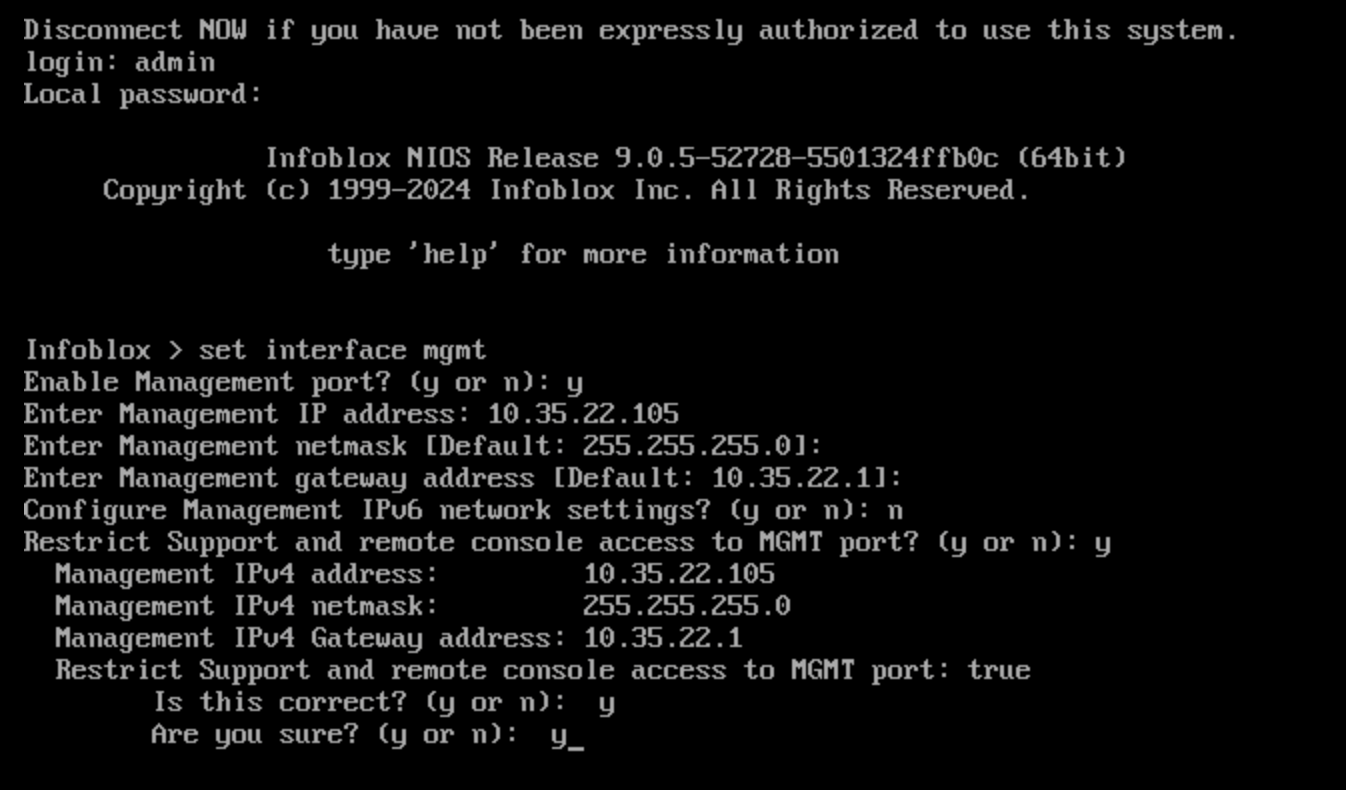
Set the management interface settings using the command
set interface mgmt, using the following information:Enable Management port: y
IP address: 10.35.22.105
Netmask: 255.255.255.0 [Enter]
Gateway: 10.35.22.1 [Enter]
IPv6 settings: n
Restrict access: y
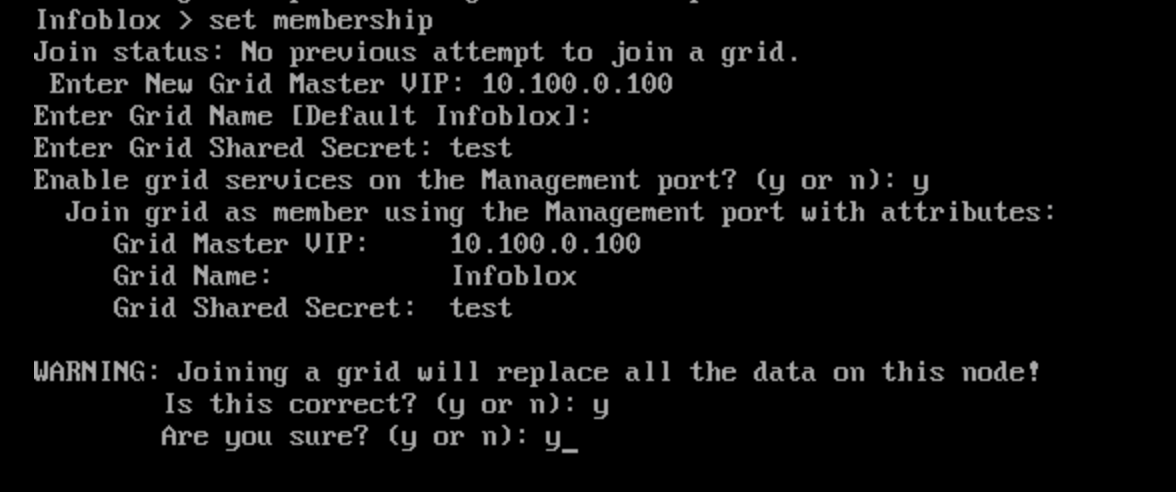
Add the VM to the grid using the command
set membership, using the following information:Grid Master VIP: 10.100.0.100
Grid name: Infoblox [Enter]
Grid Secret: test
Enable grid services on Management interface: y
Switch over to the jump-desktop machine.
Open a browser window to https://10.100.0.100
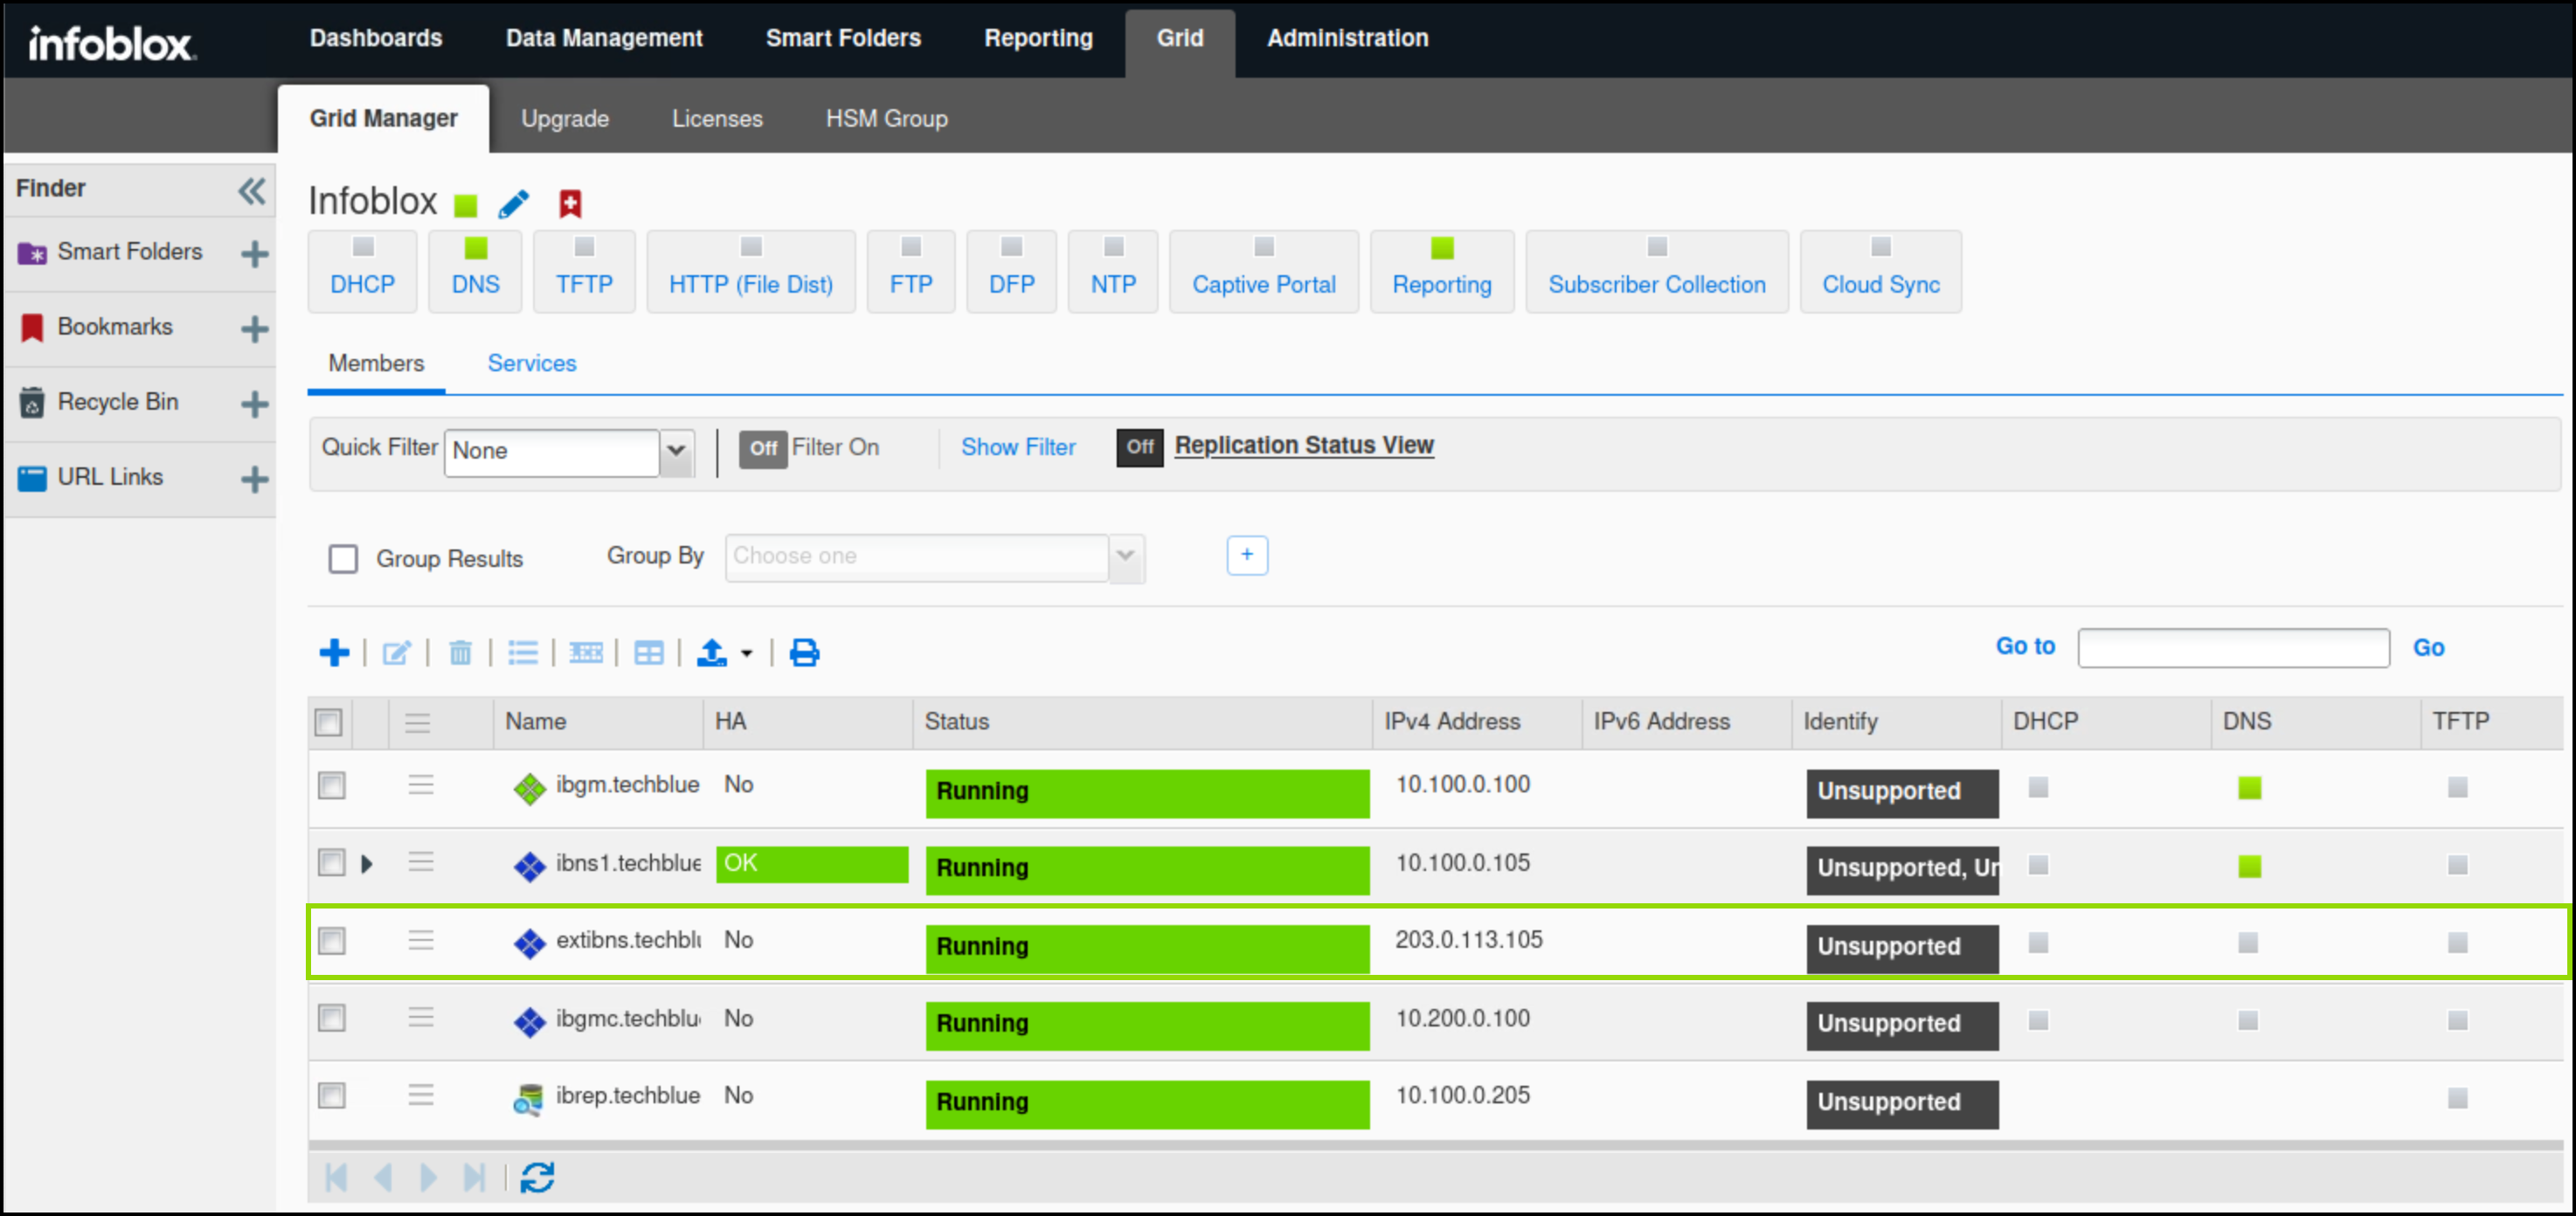
Navigate to Grid → Grid Manager
Verify that NIOS-4 has joined the grid under the name extibns.techblue.net
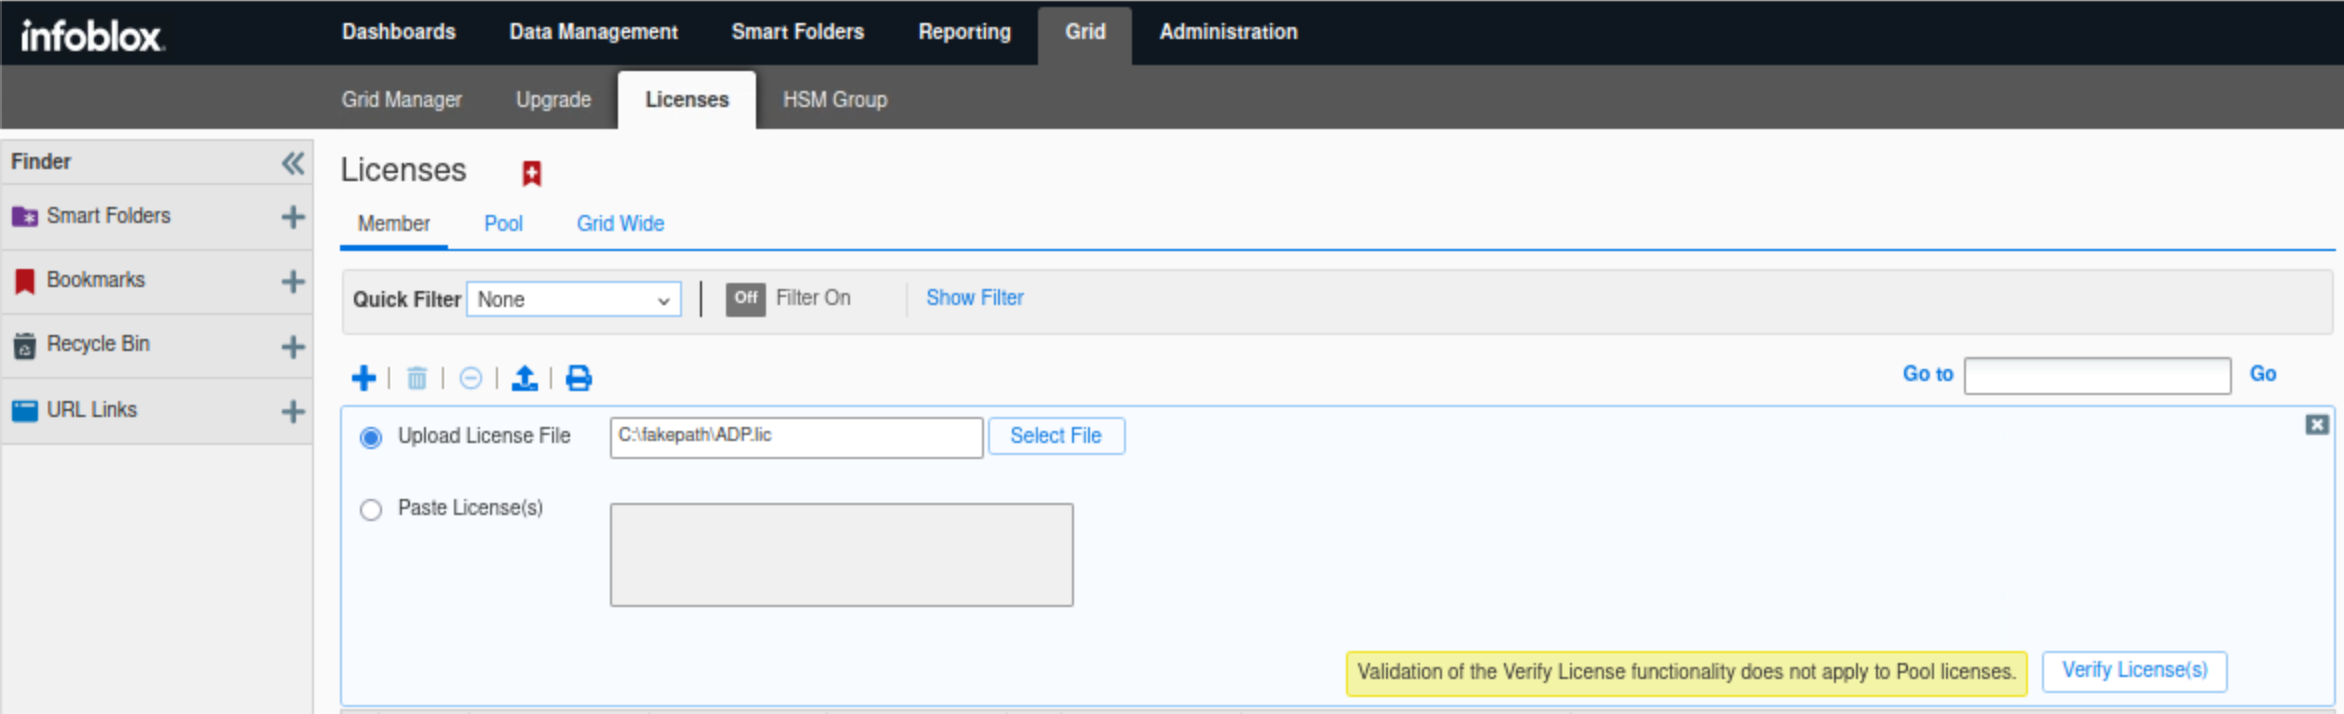
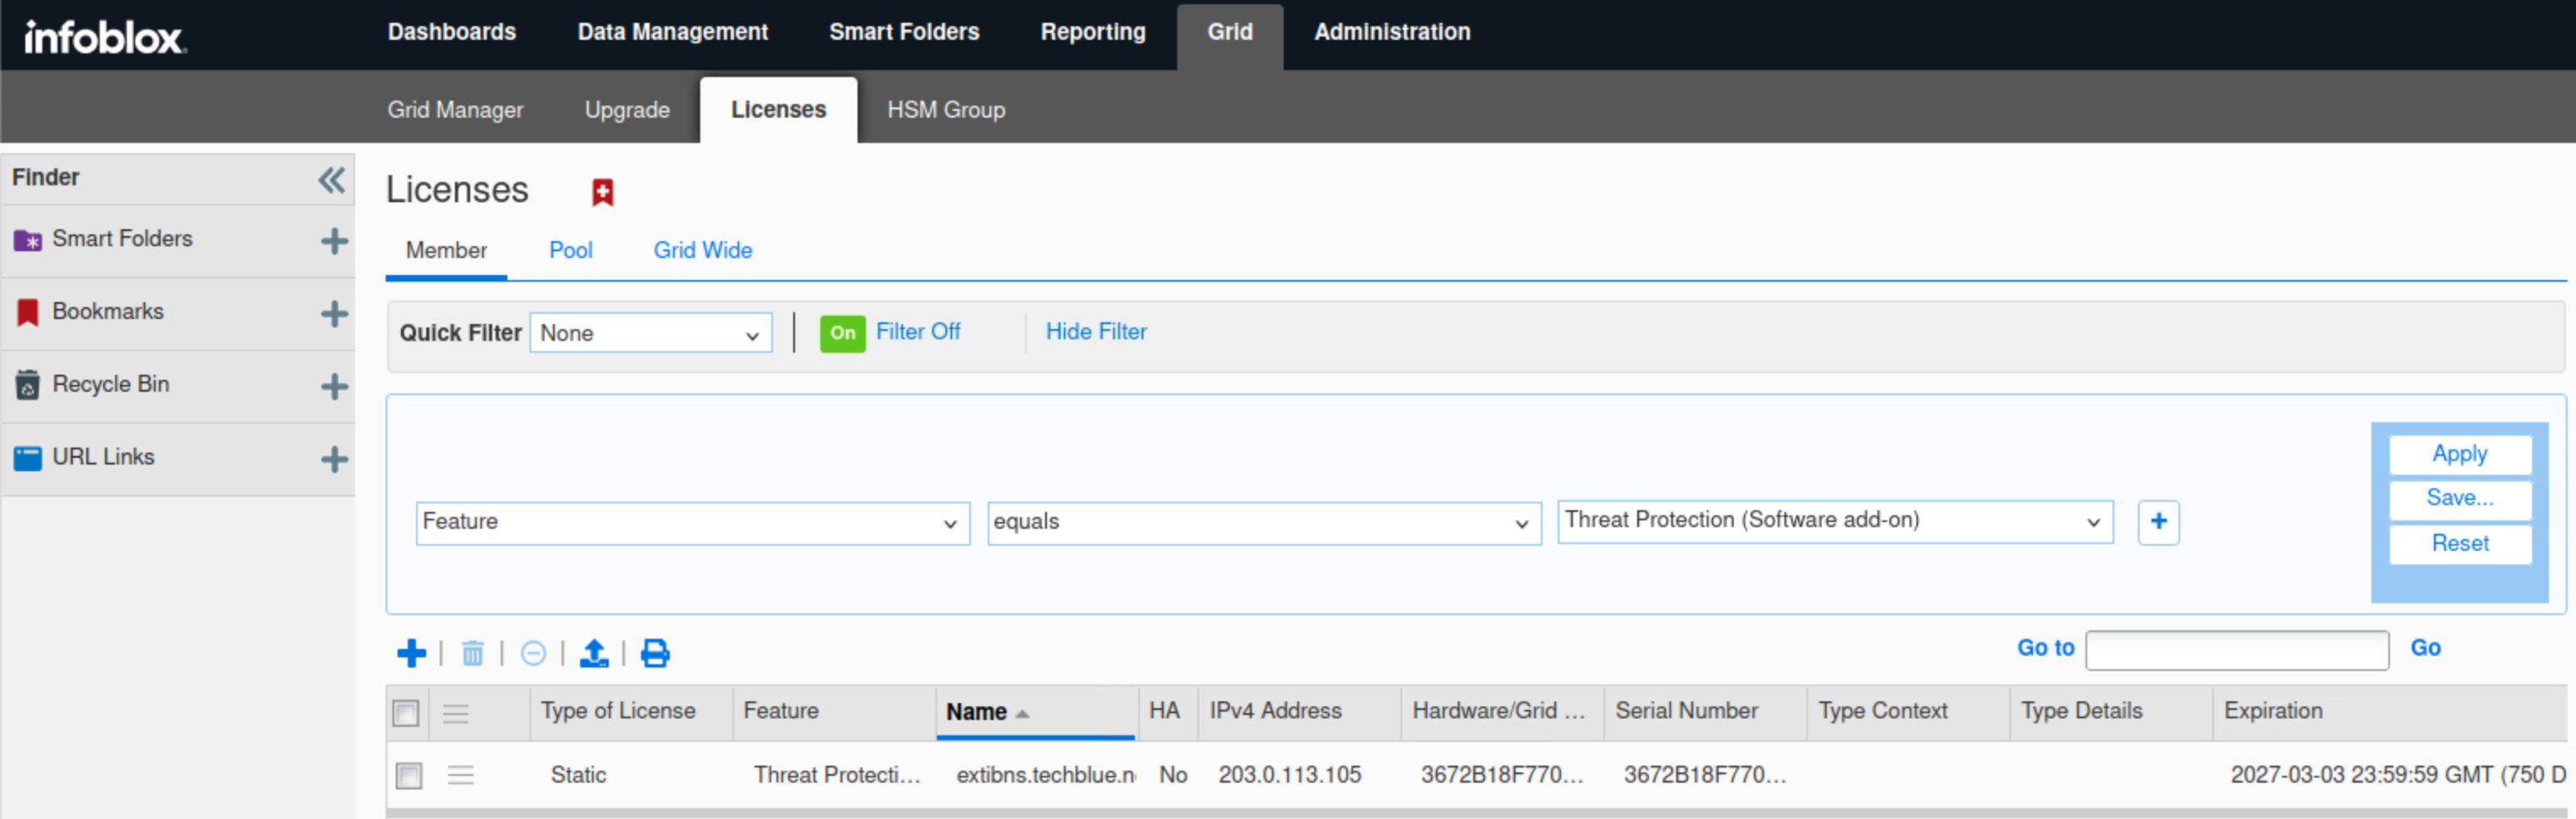
Navigate to Grid → Licenses → Members.
Click the plus (+) symbol to add a new license.
Click Select File to upload the license file.
Navigate to
Shared Drive/Licenses/9.0.Select the ADP.lic file and click Open.
Click Verify License(s), then Save All Valid Licenses.
Click on the Show Filter link
Select Feature equals Threat Protection (software add-on), then click Apply.
Since ADP in this lab is not running on hardware; it is running on a virtual machine, we need to use this filter.
Select Feature equals Threat Protection update, then click Apply.
This license allows ADP rulesets to be updated automatically if configured.

Wait for extibns.techblue.net to come back online with Threat Protection running.
This process should take 5-7 minutes.
Task 2 Solution: Verify Threat Protection events in Syslog
In this task, you will start your investigation on the ongoing DNS traffic spike triggering Threat Protection(ADP) to take action. We will start by investigating the Grid syslogs.
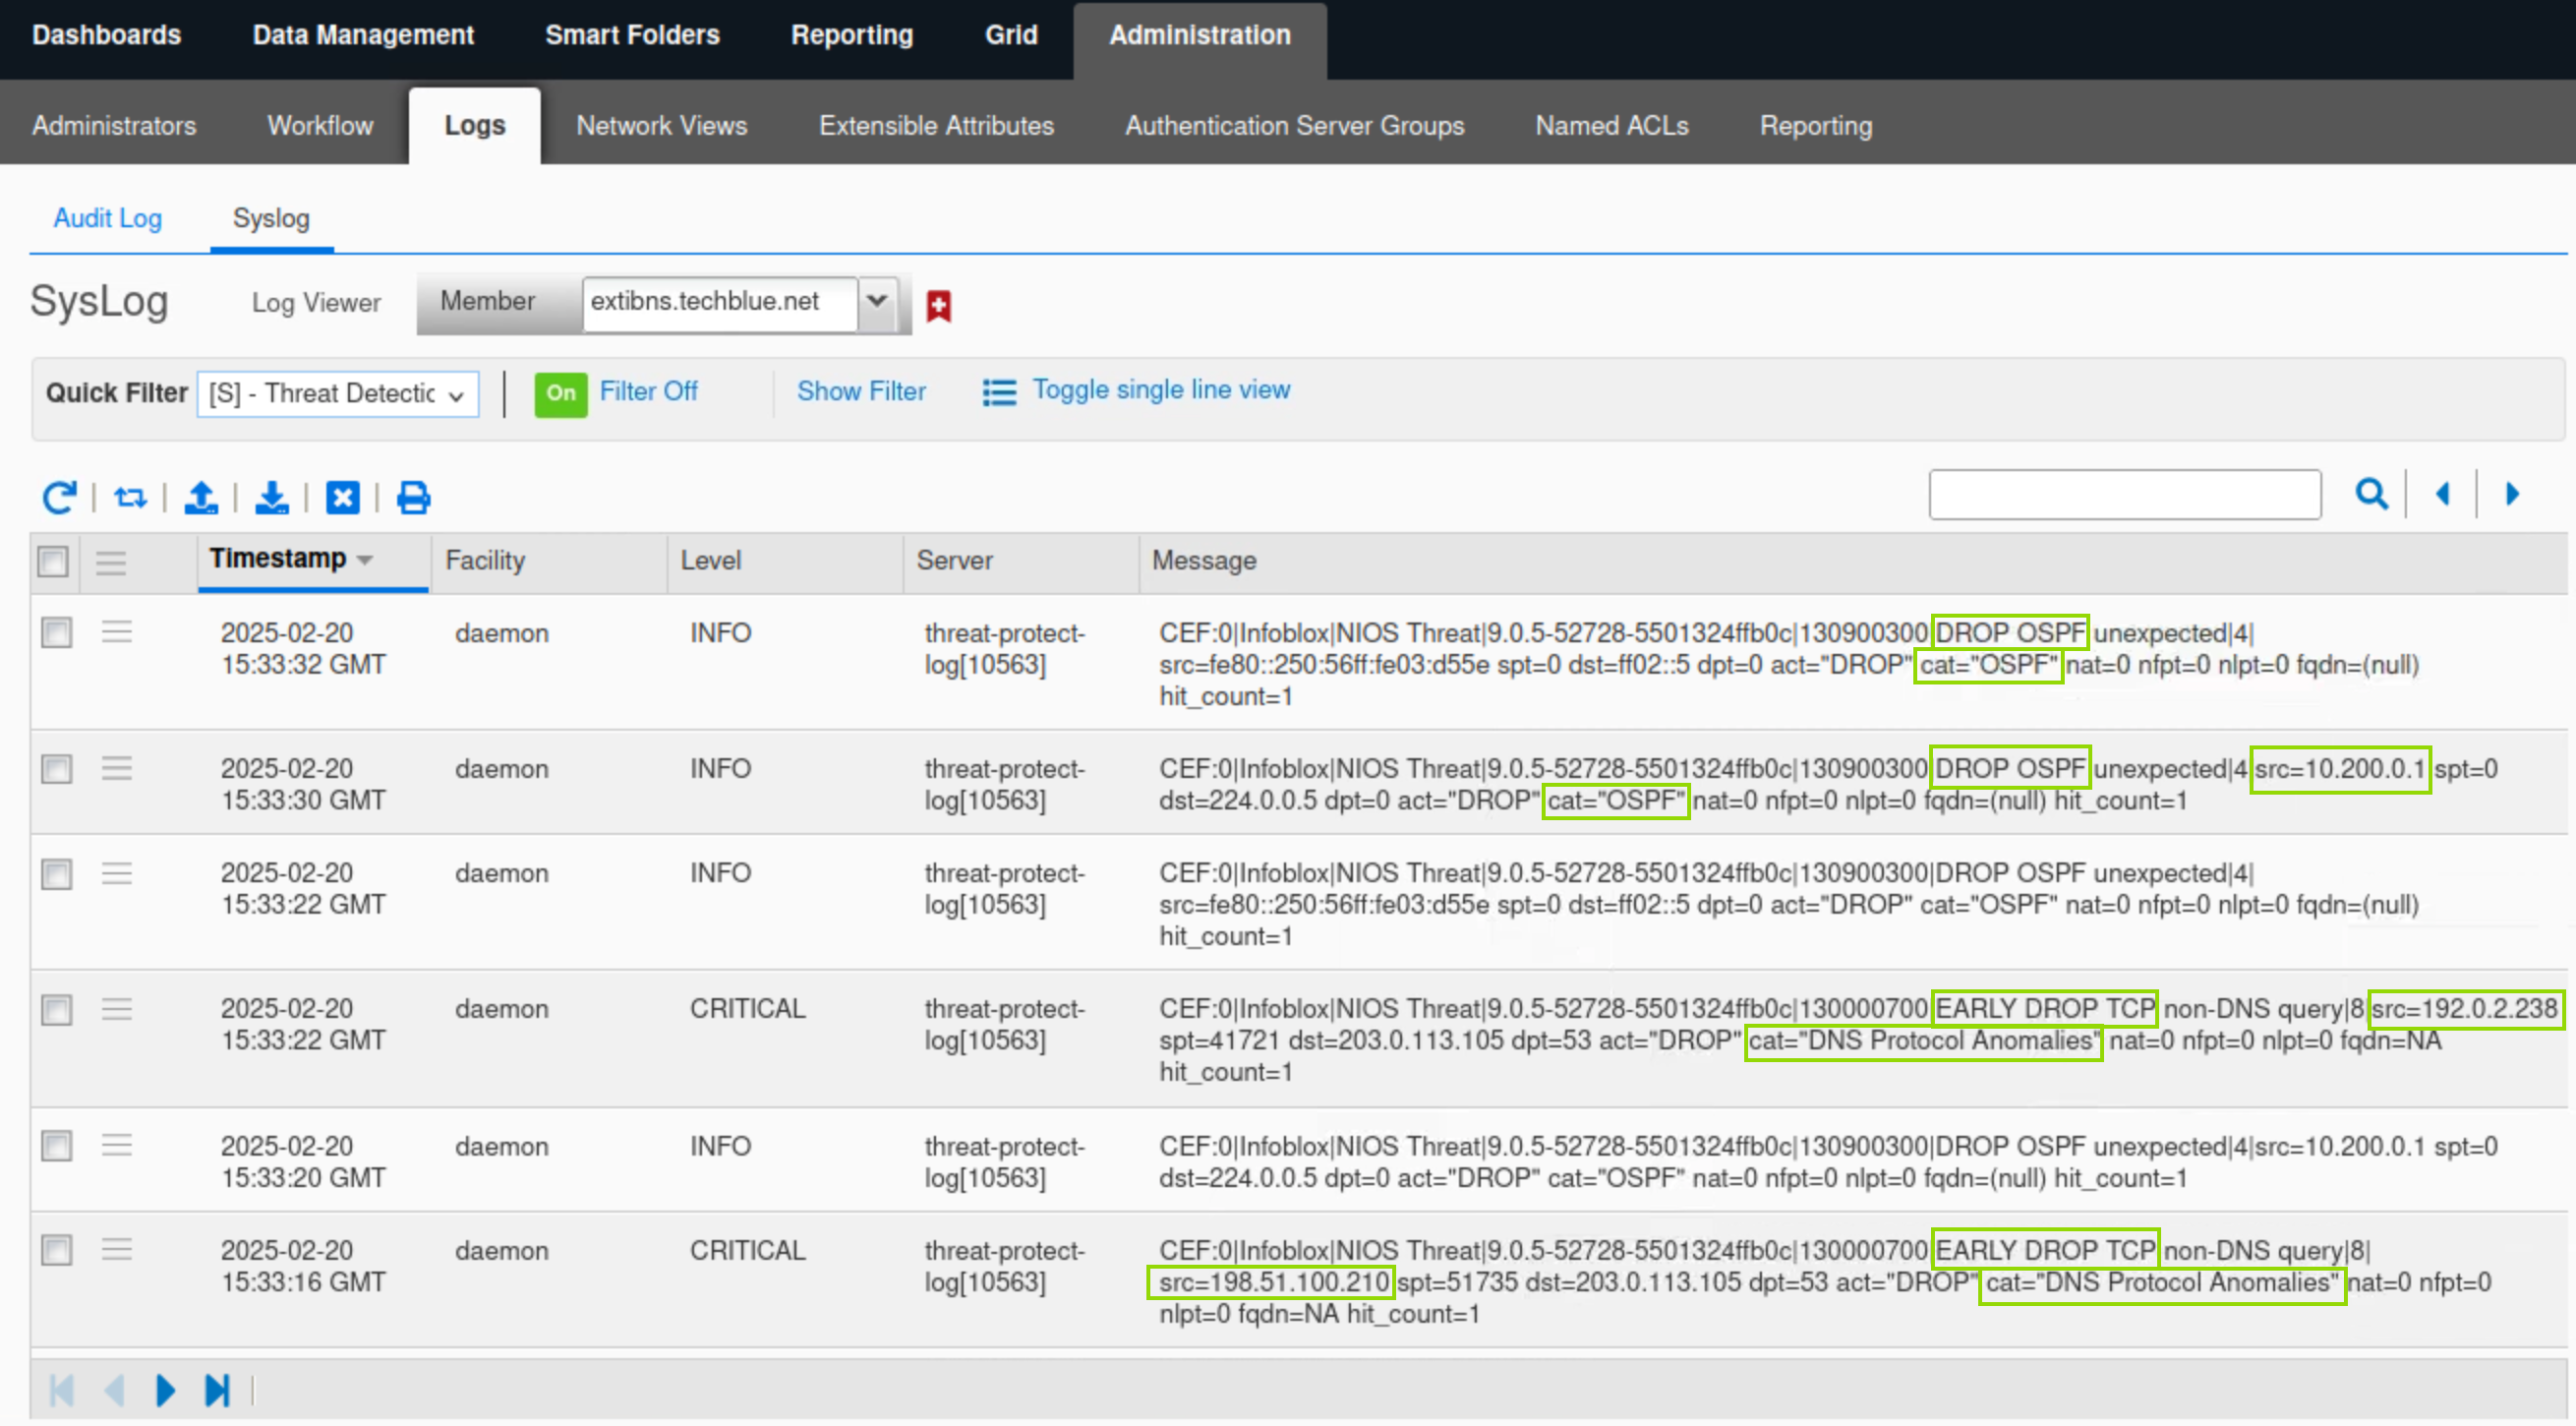
Navigate to Administration → Log → Syslog.
Select the Member extibns.techblue.net from the drop-down list.
Choose Threat Detection from the Quick Filter drop-down list.
Click Toggle multi-line view to view the Syslog records.
In this example, multiple records show two Threat Protection rules being hit: the EARLY DROP TCP and DROP OSPF rules.
The rule EARLY DROP TCP is in the DNS Protocol Anomalies category from the source IP 192.0.2.238.
The rule DROP OSPF is in the OSPF category from the source 10.200.0.1
Task 3 Solution: Analyze the Grid Status and Health using Security Dashboard Widgets
In this task, we will use the NIOS Security Dashboard to view near real-time data about the recent DNS spikes noticed in our organization. Since we just started our investigation and to gather as much information and context about the attacks as we can, we will start by analyzing the general security health of the grid and then drill down to each member separately to understand better which members were affected by the attacks. Then, we will investigate the affected members in more detail to get information on what IPs and domains were used during the attacks and verify that Threat Protection (ADP) identified and stopped the attempts.
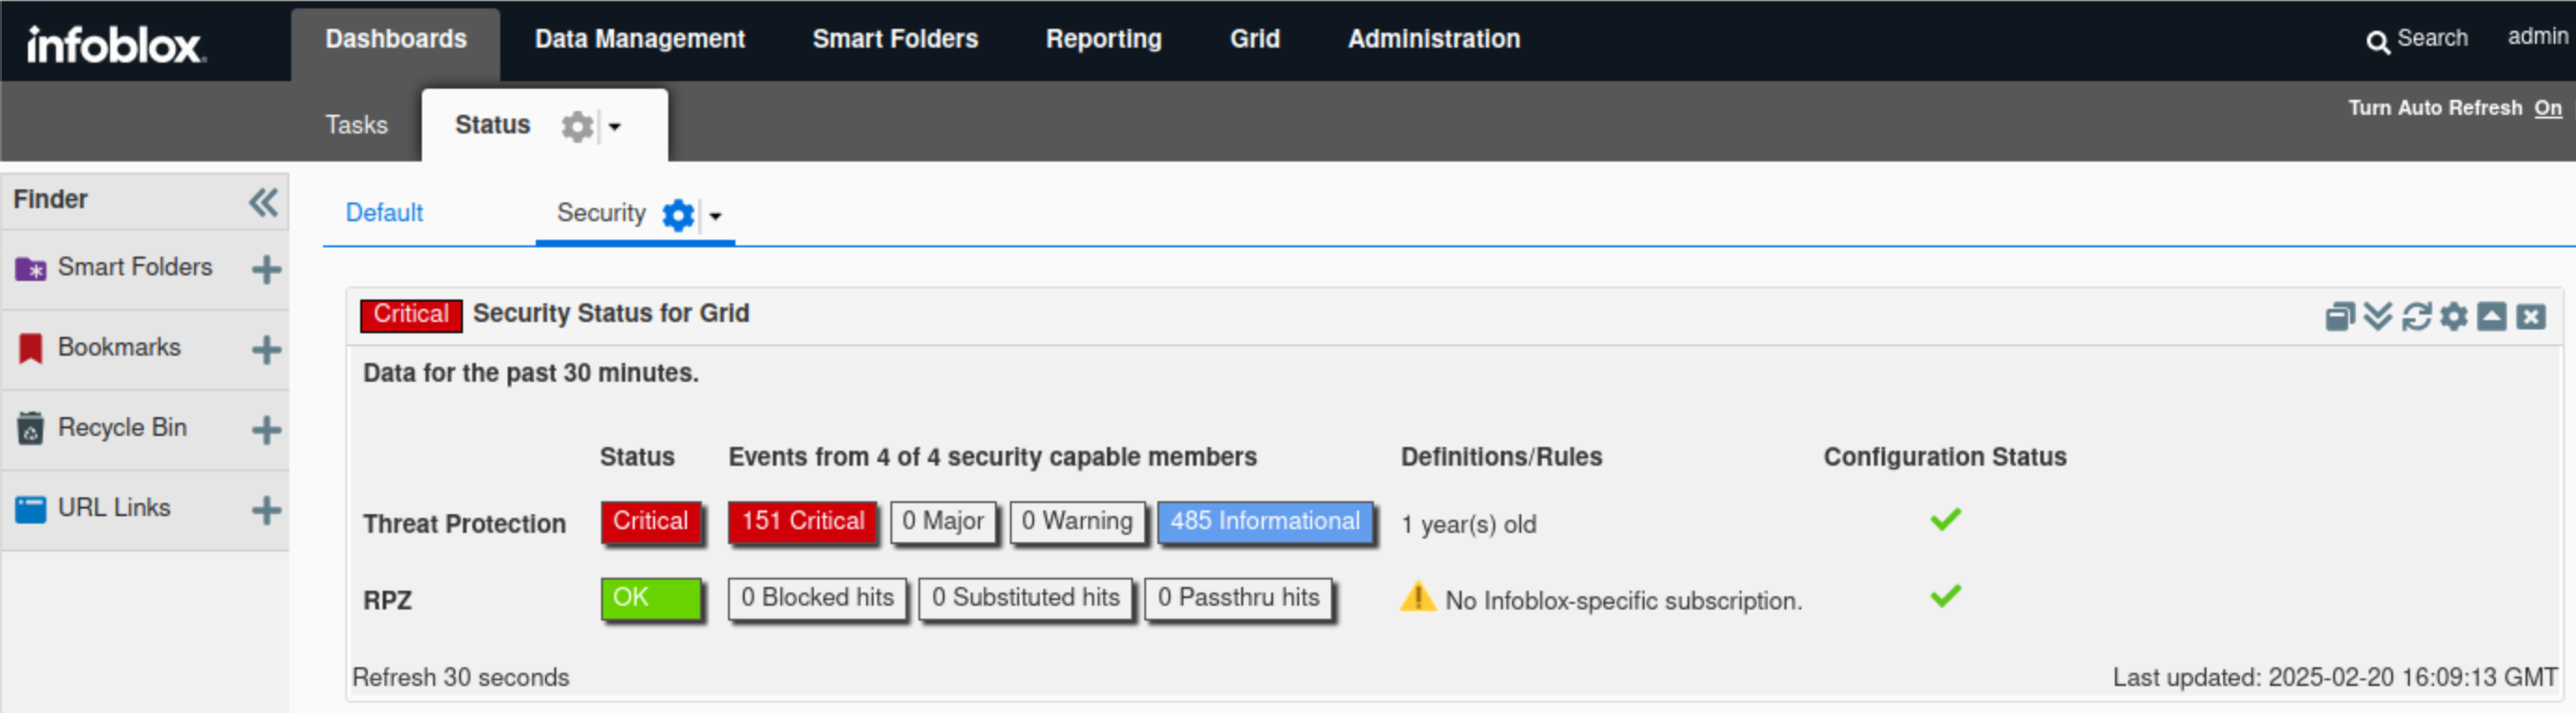
Navigate to Dashboards → Status → Security.
Turn On auto Refresh for the security Dashboard.
Find the Security Status for Grid widget.
The widget displays high-level information about the Grid security status.
In this example, The Threat Protection status is critical, which validates what we discovered earlier using syslog. We can see Threat Protection rules have been triggered a total of 636 times broken into 151 critical events and 485 informational events.The exact values may vary in the lab environment.
Hovering over the status icon reveals a breakdown of the Threat Protection status. The same information also surfaced in the Threat Protection status for the Grid widget.
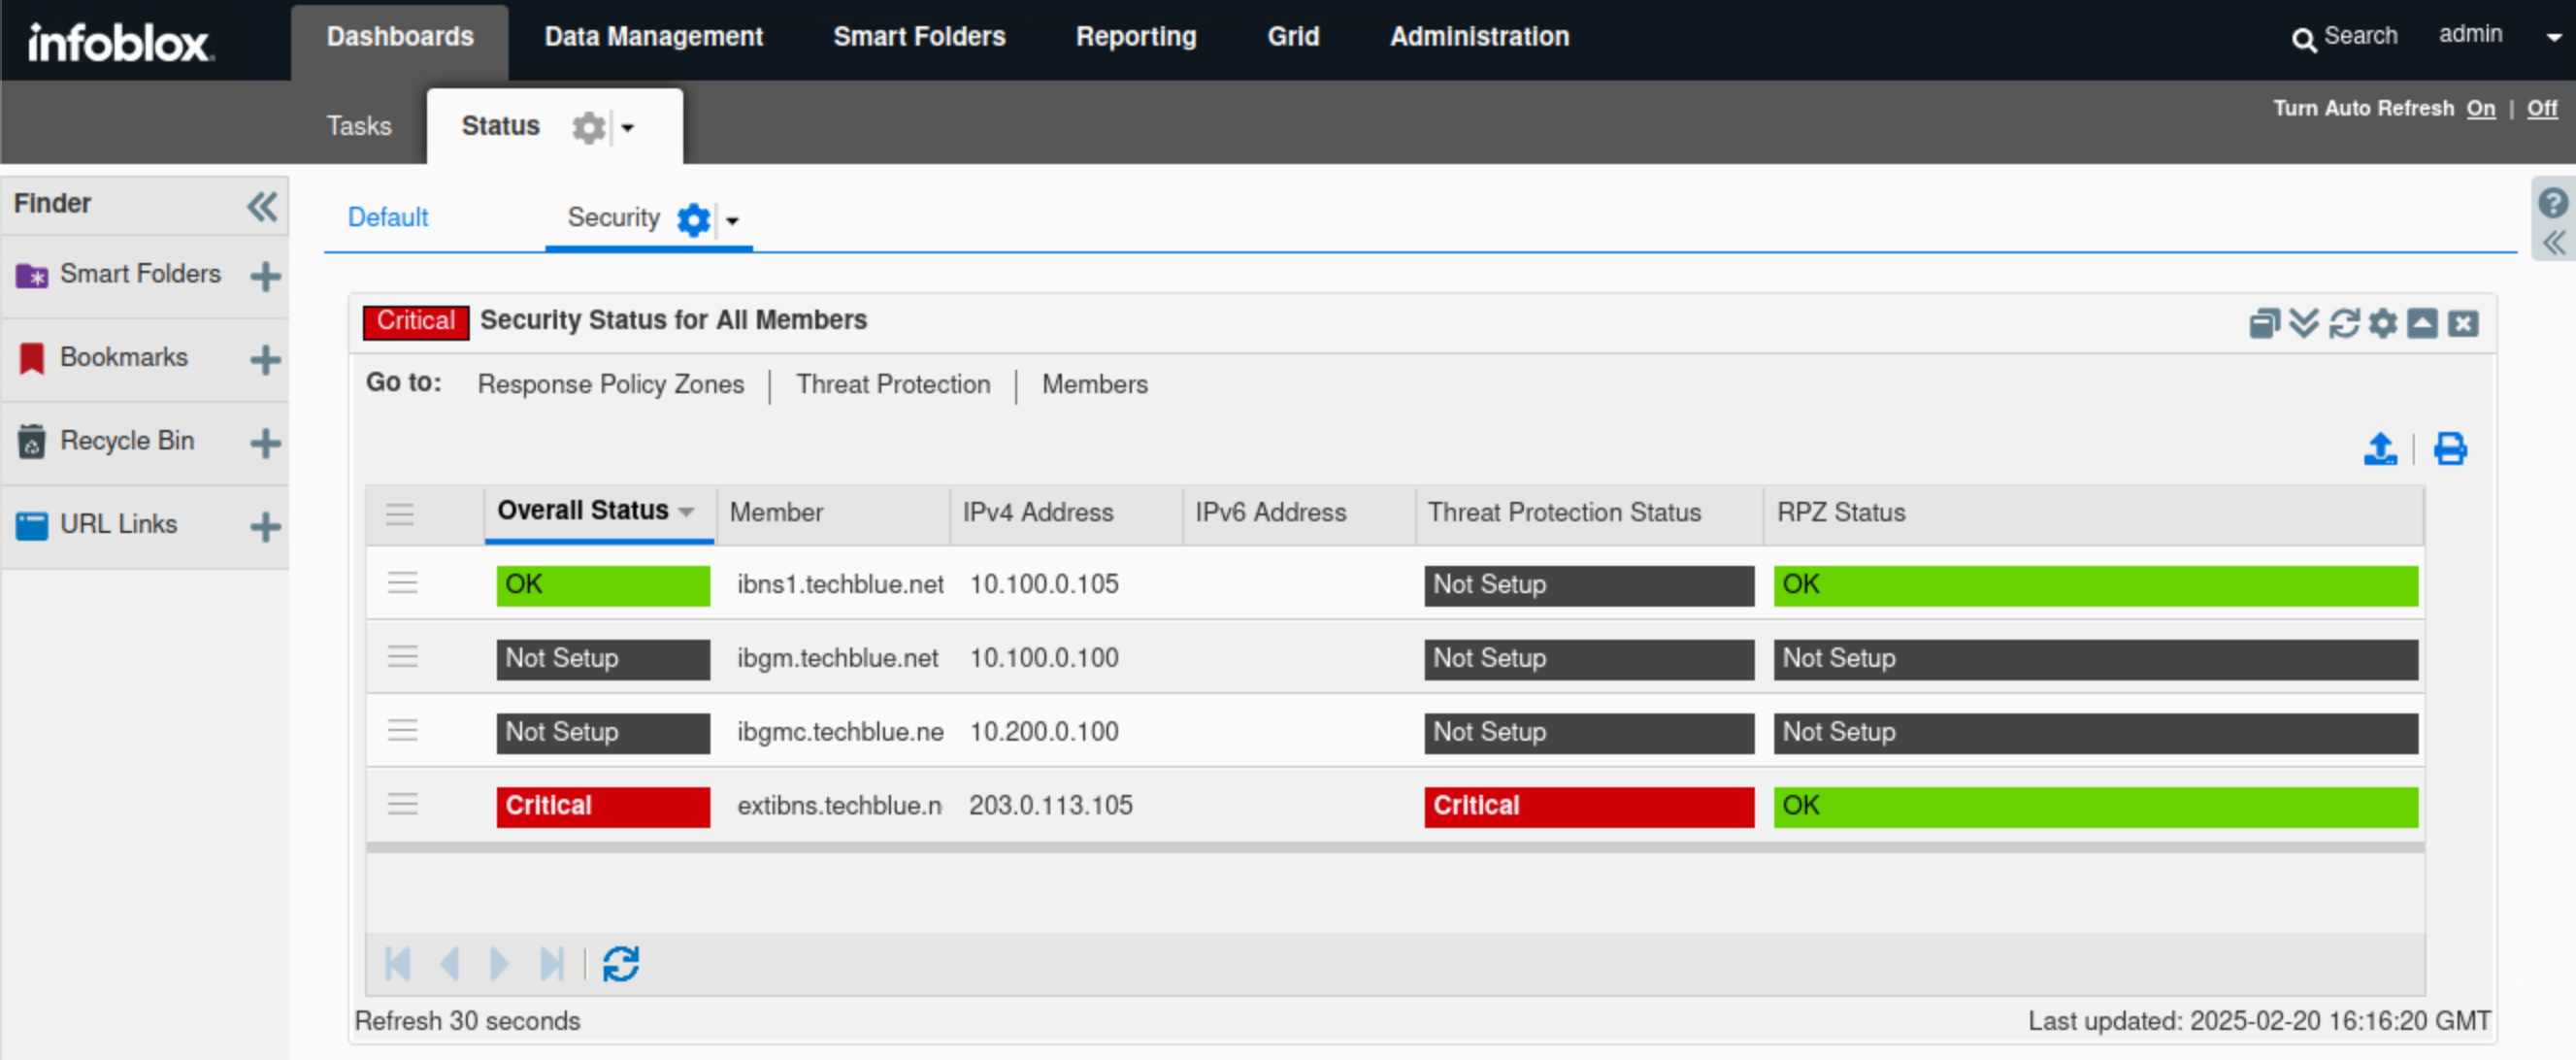
Find the Security Status for all Members widget.
Verify the status of the listed members ibns1.techlblue.net and extibns.techblue.net.
This widget provides a separate, more detailed status breakdown for each Grid member.
In this example, ibns1.techlblue.net is not running Threat Protection and should not be affected by the recent events, while extibns.techblue.net is in a critical state.
By hovering over each member's name in the widget, we can view that member’s status. Similarly, by hovering over the Threat Protection status bar, we can view a breakdown of that member's Threat Protection status.
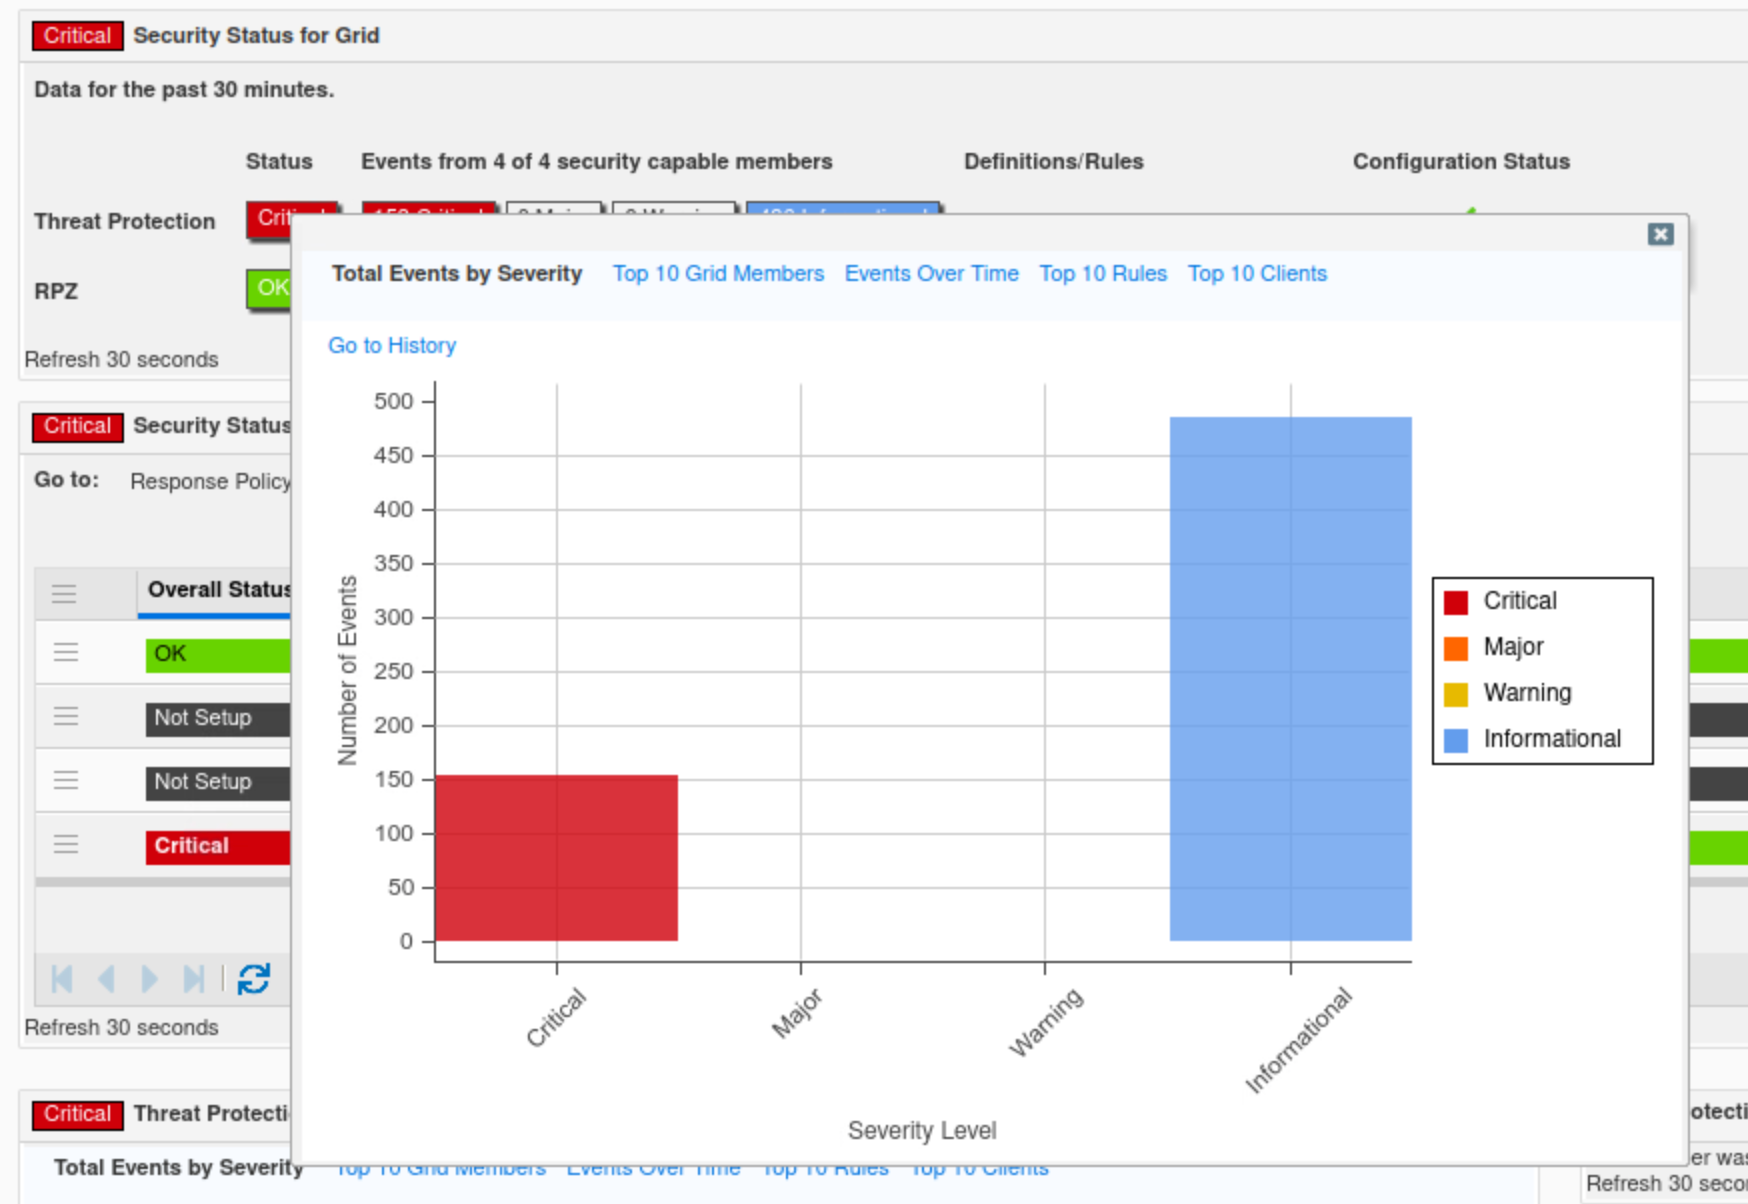
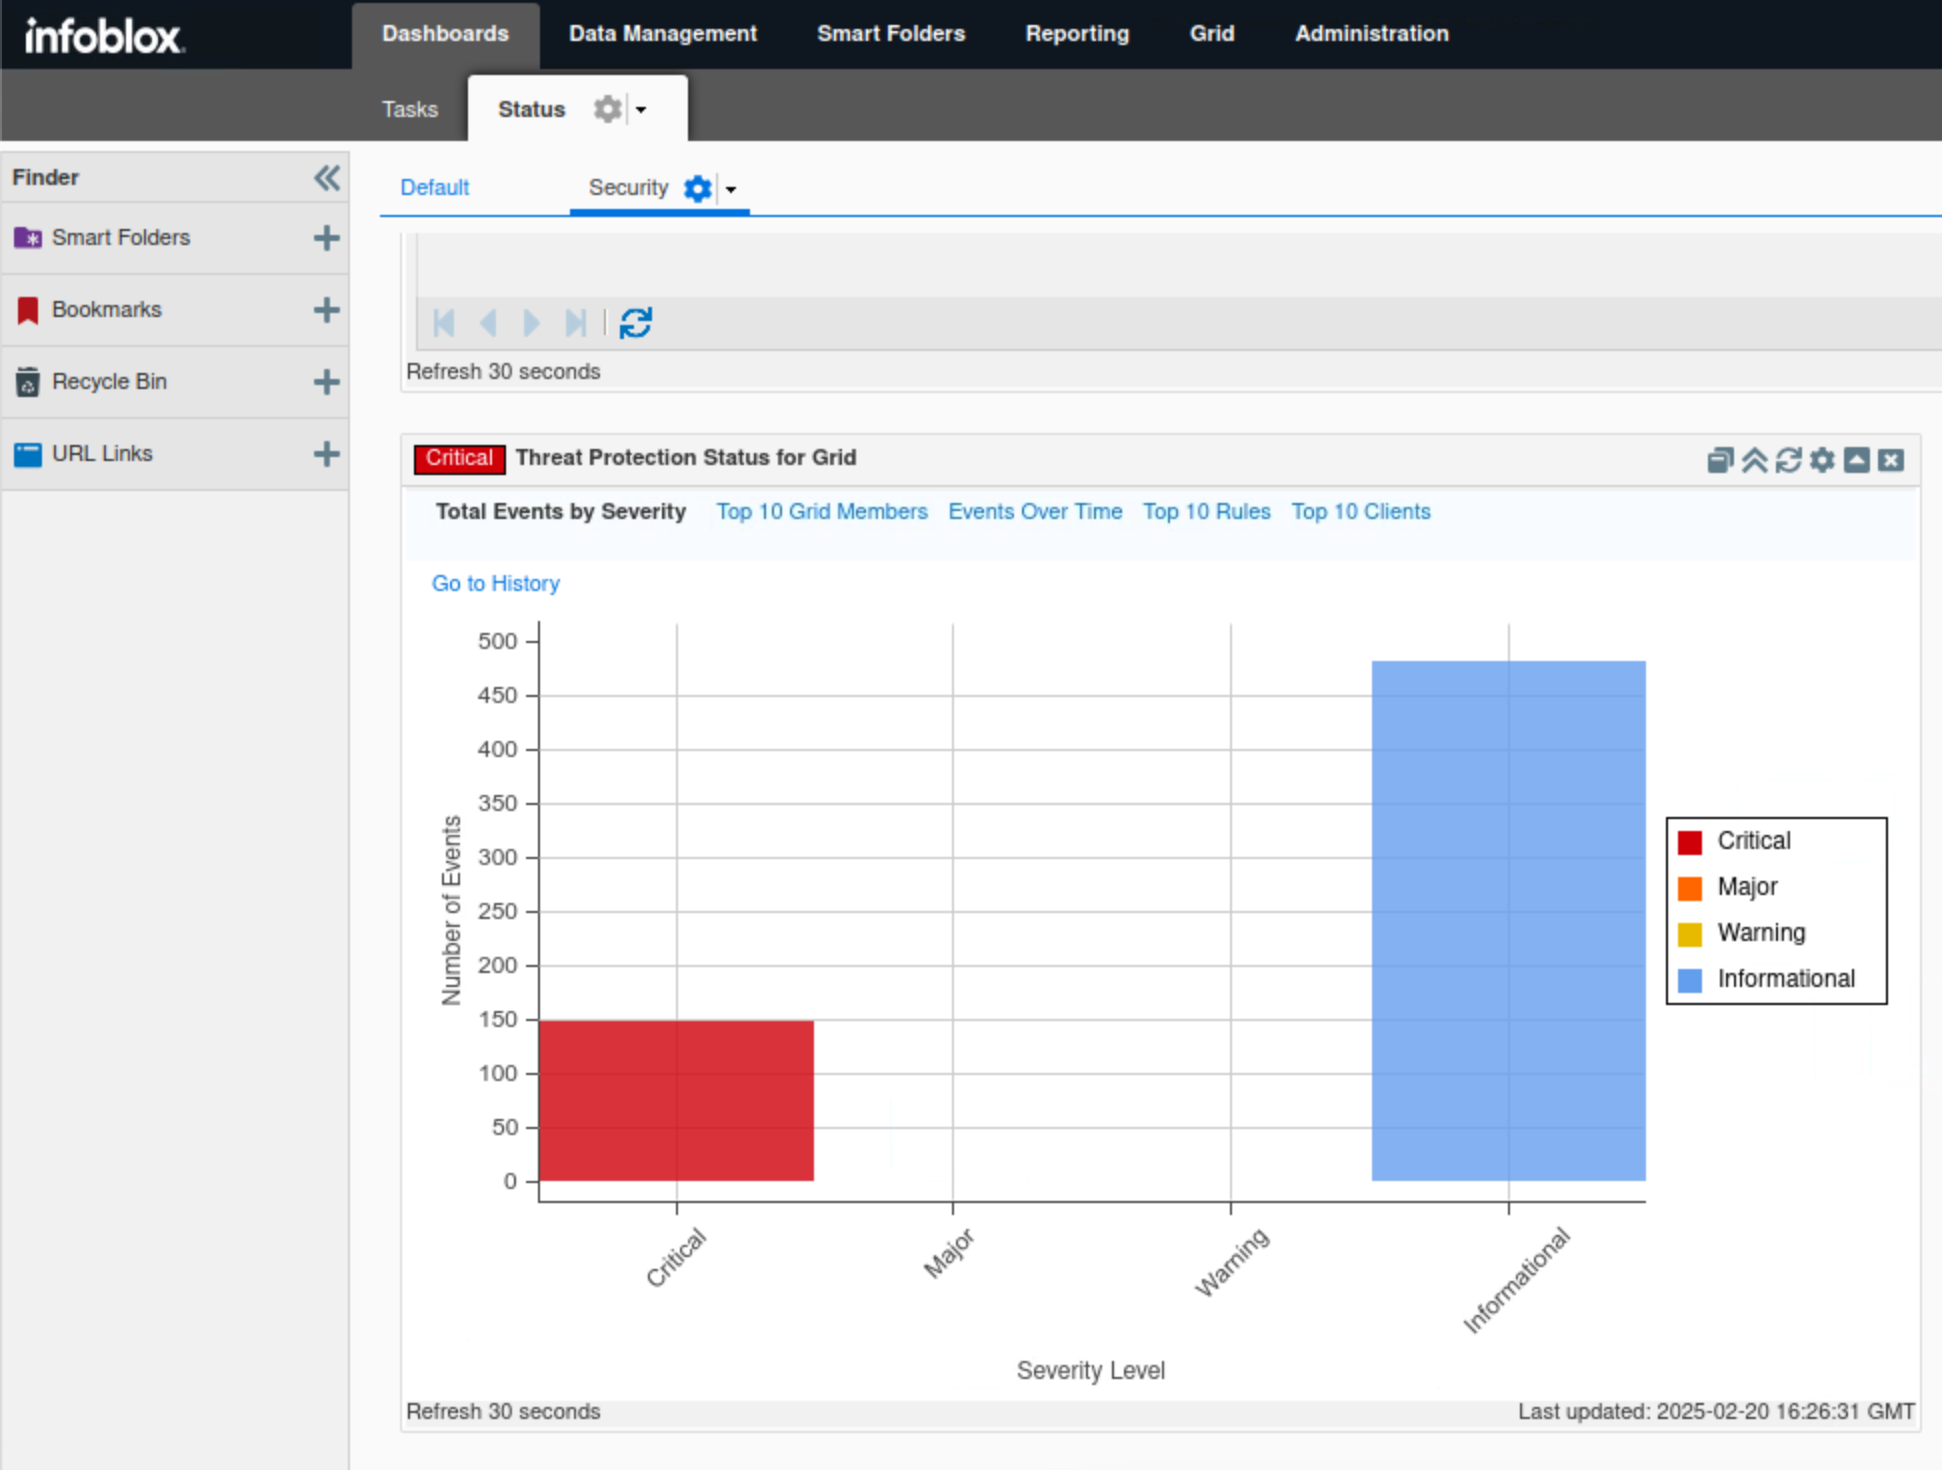
Find the Threat Protection Status for Grid widget.
Click Total Events by Severity.
This tab, in bar chart format, breaks down Threat Protection events into four categories: Critical, Major, Minor, and Informational.
In this example, we can see only two categories being triggered: Critical and Informational.
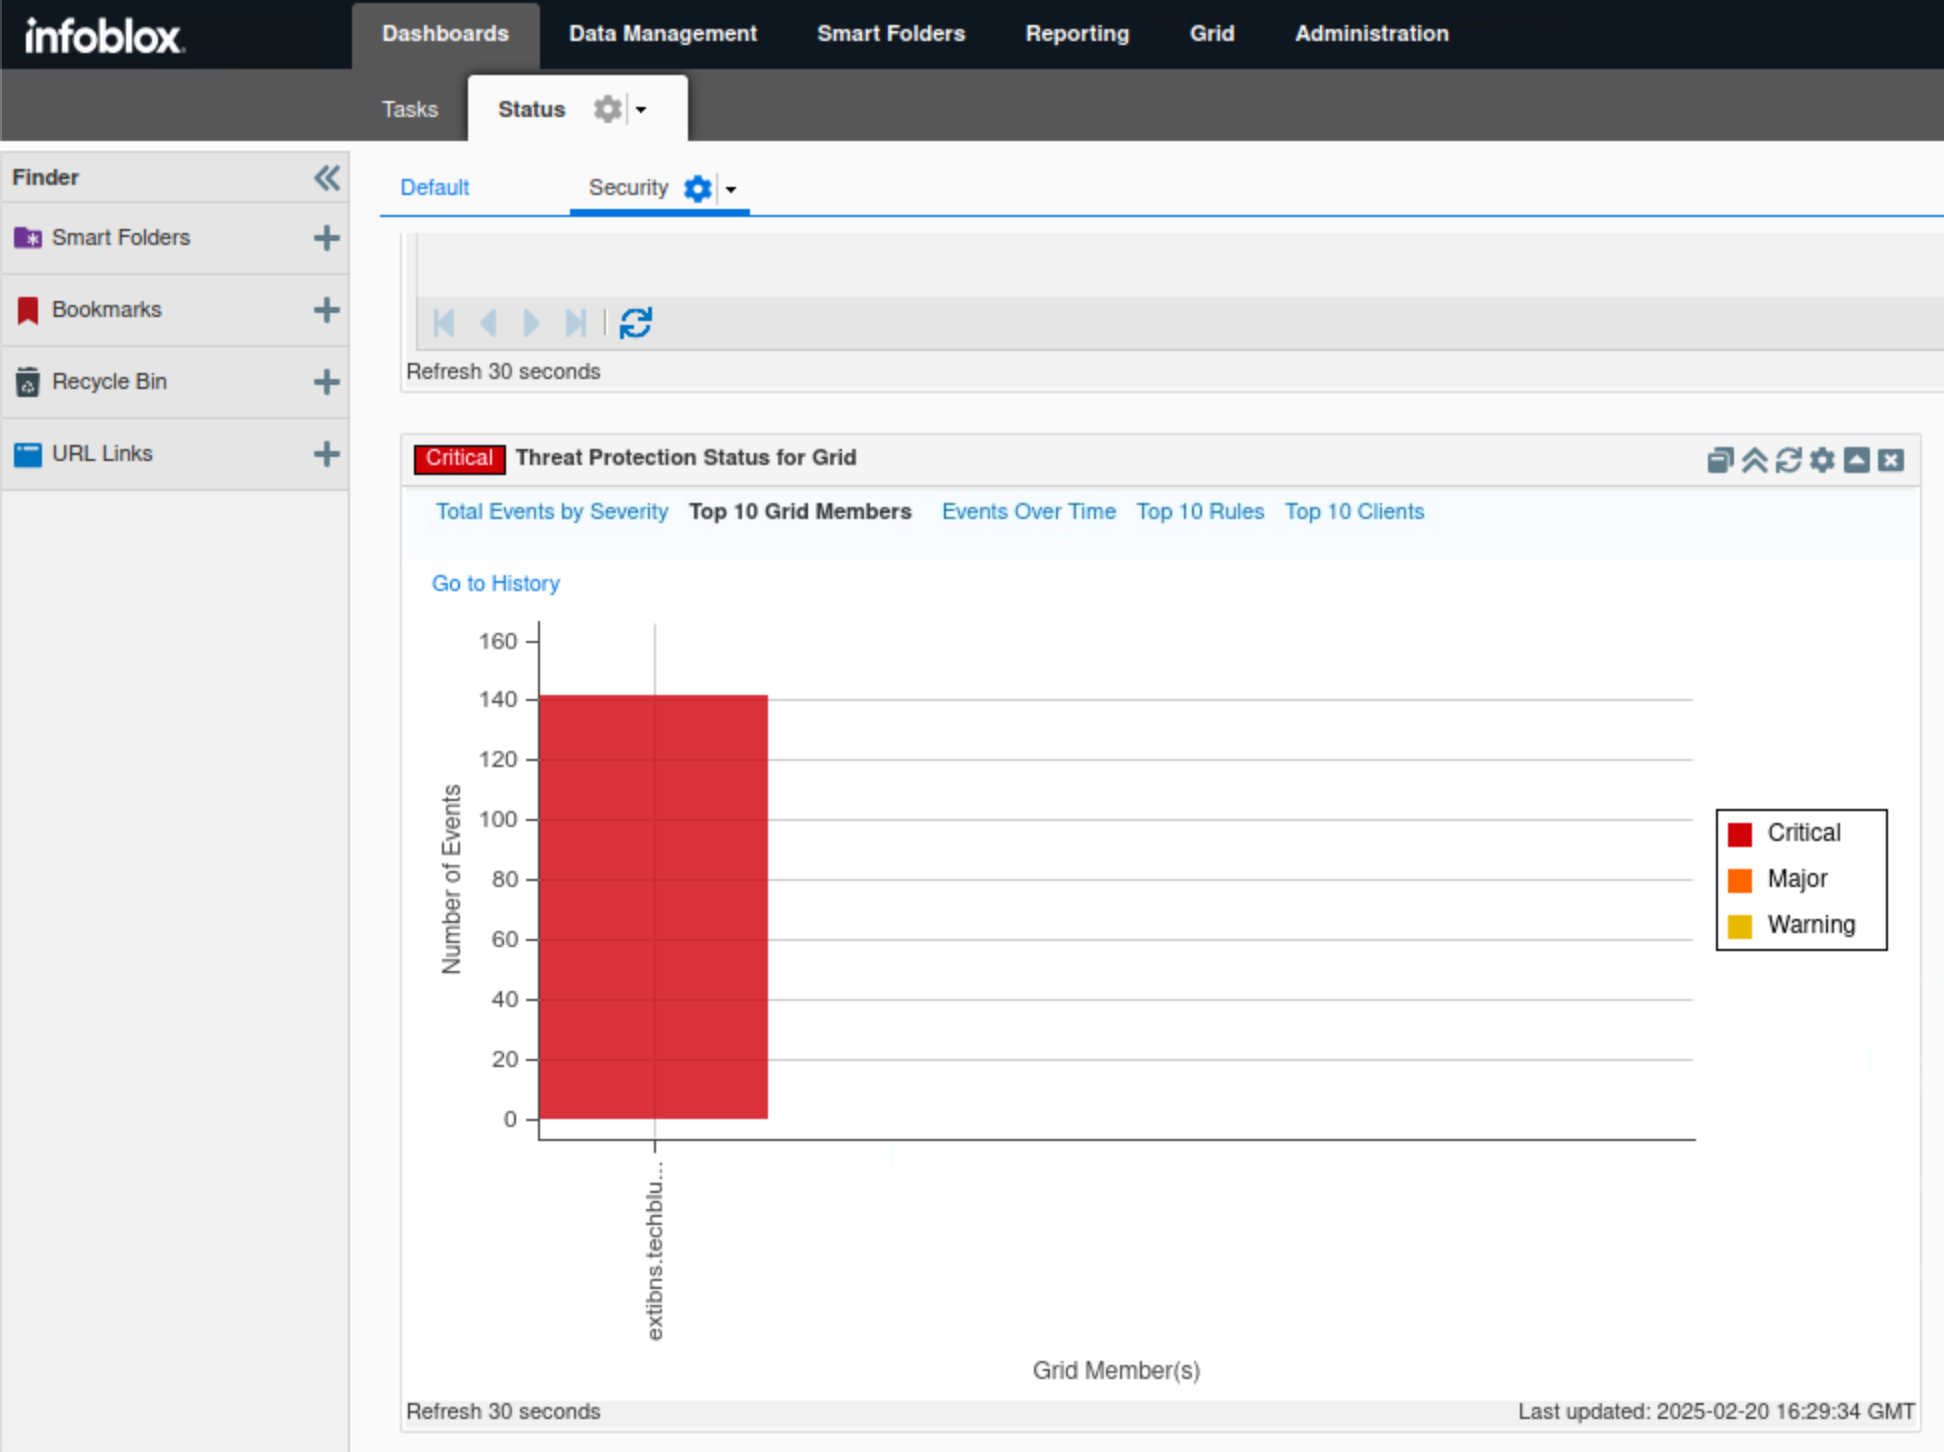
Click Top 10 Grid Members.
This tab, in bar chart format, breaks down the number of events triggered by each Threat Protection-enabled member.
In this example, only extibns.techblue.net is shown since it is the only Threat Protection enabled member.
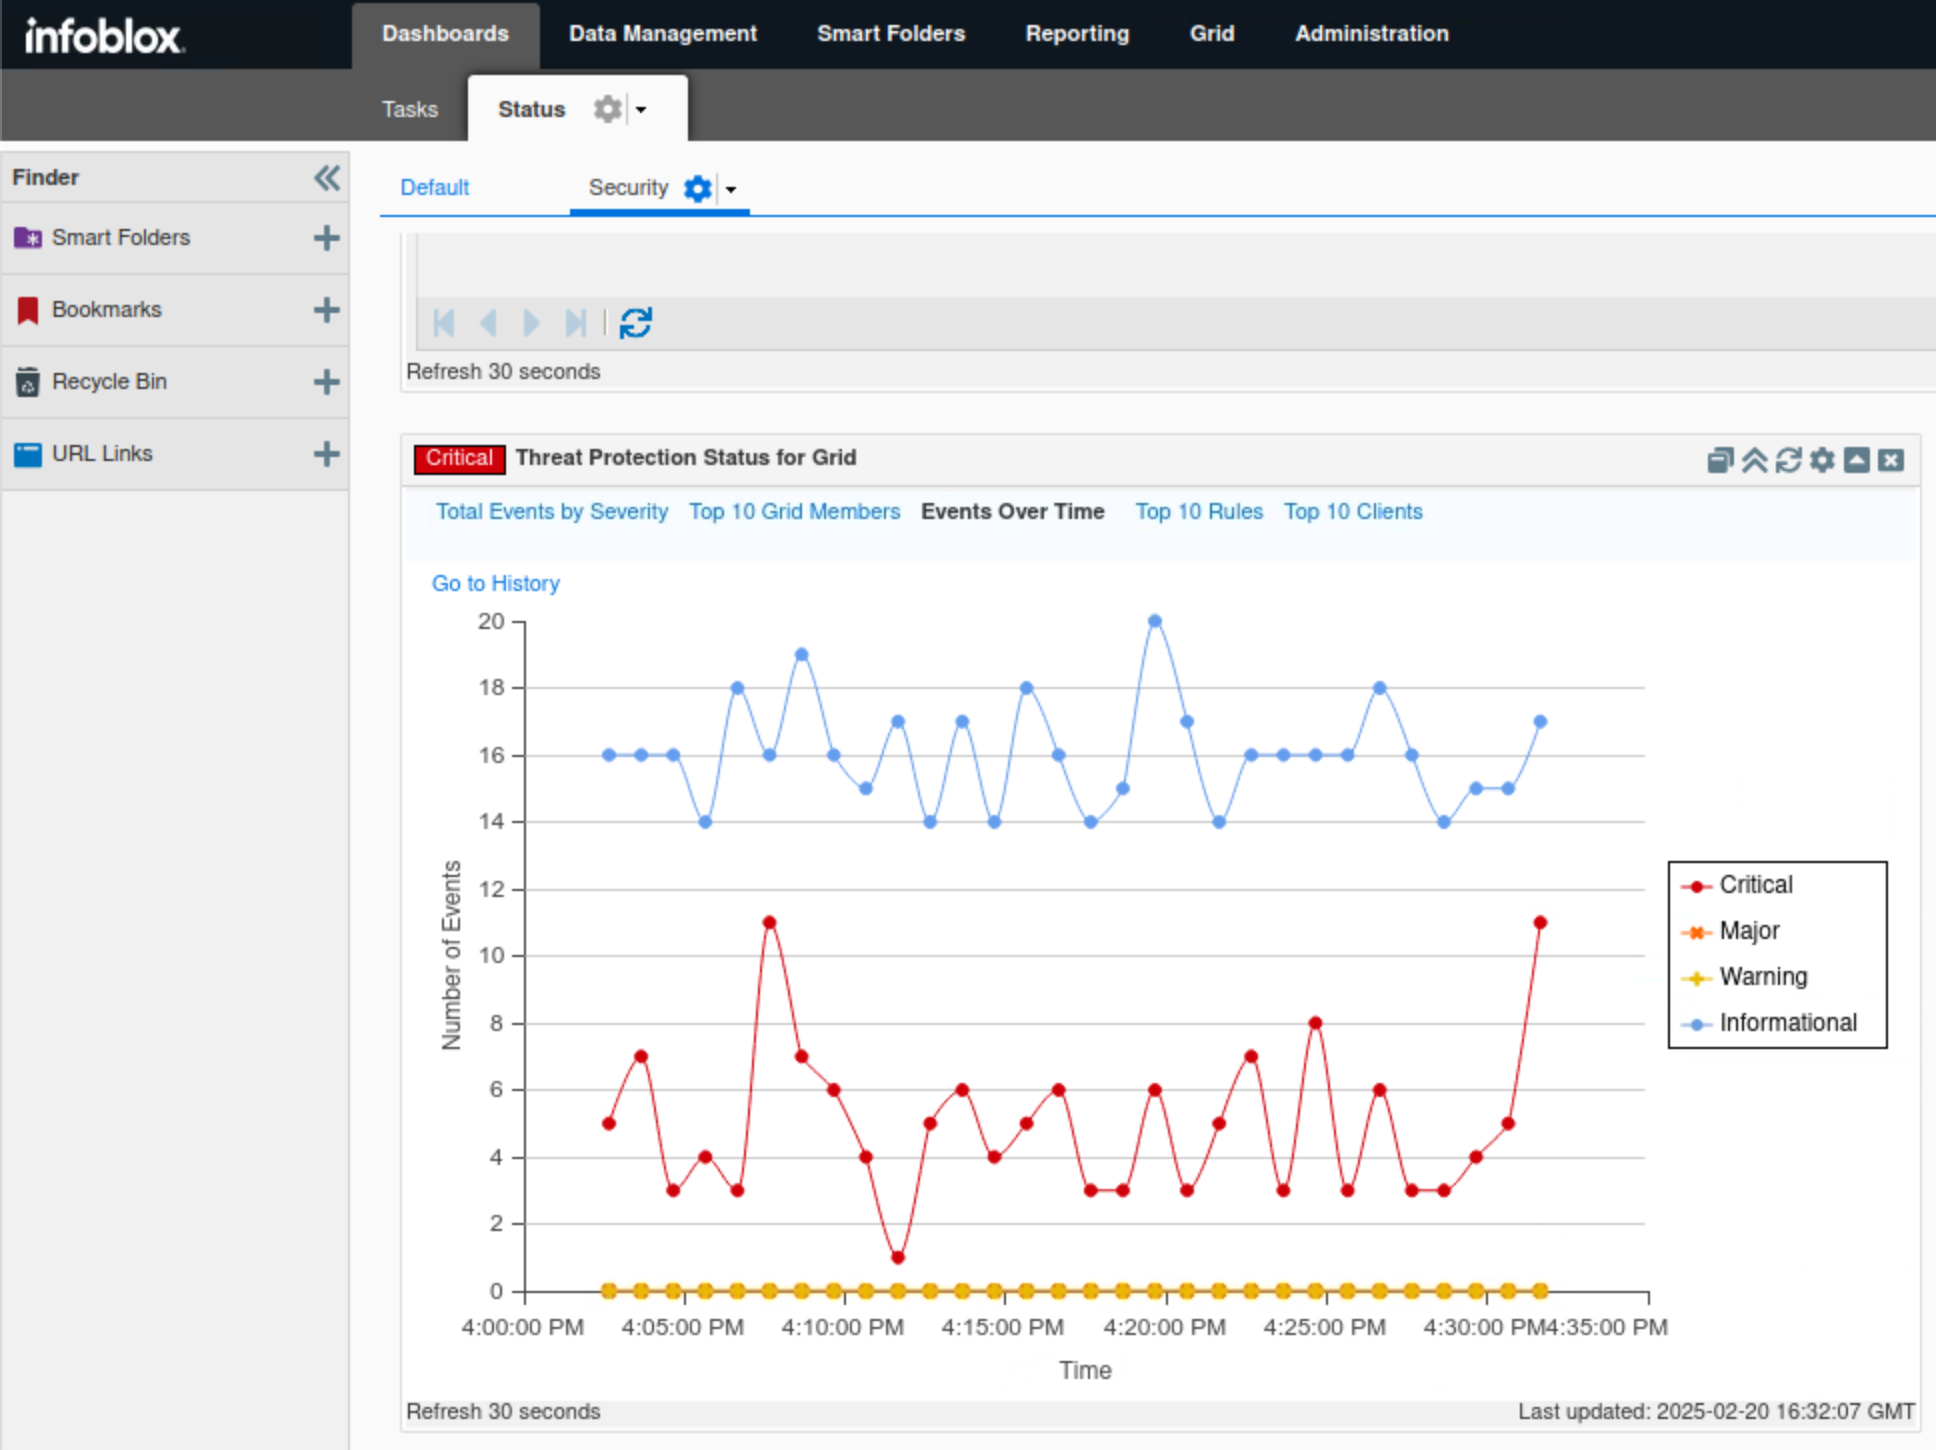
Click Events Over Time.
This tab displays a timeline for each event category to help visualize the DNS load on the Grid.
In this example, we can visualize both available event categories, Critical and Informational, based on the number of events triggered at certain times.
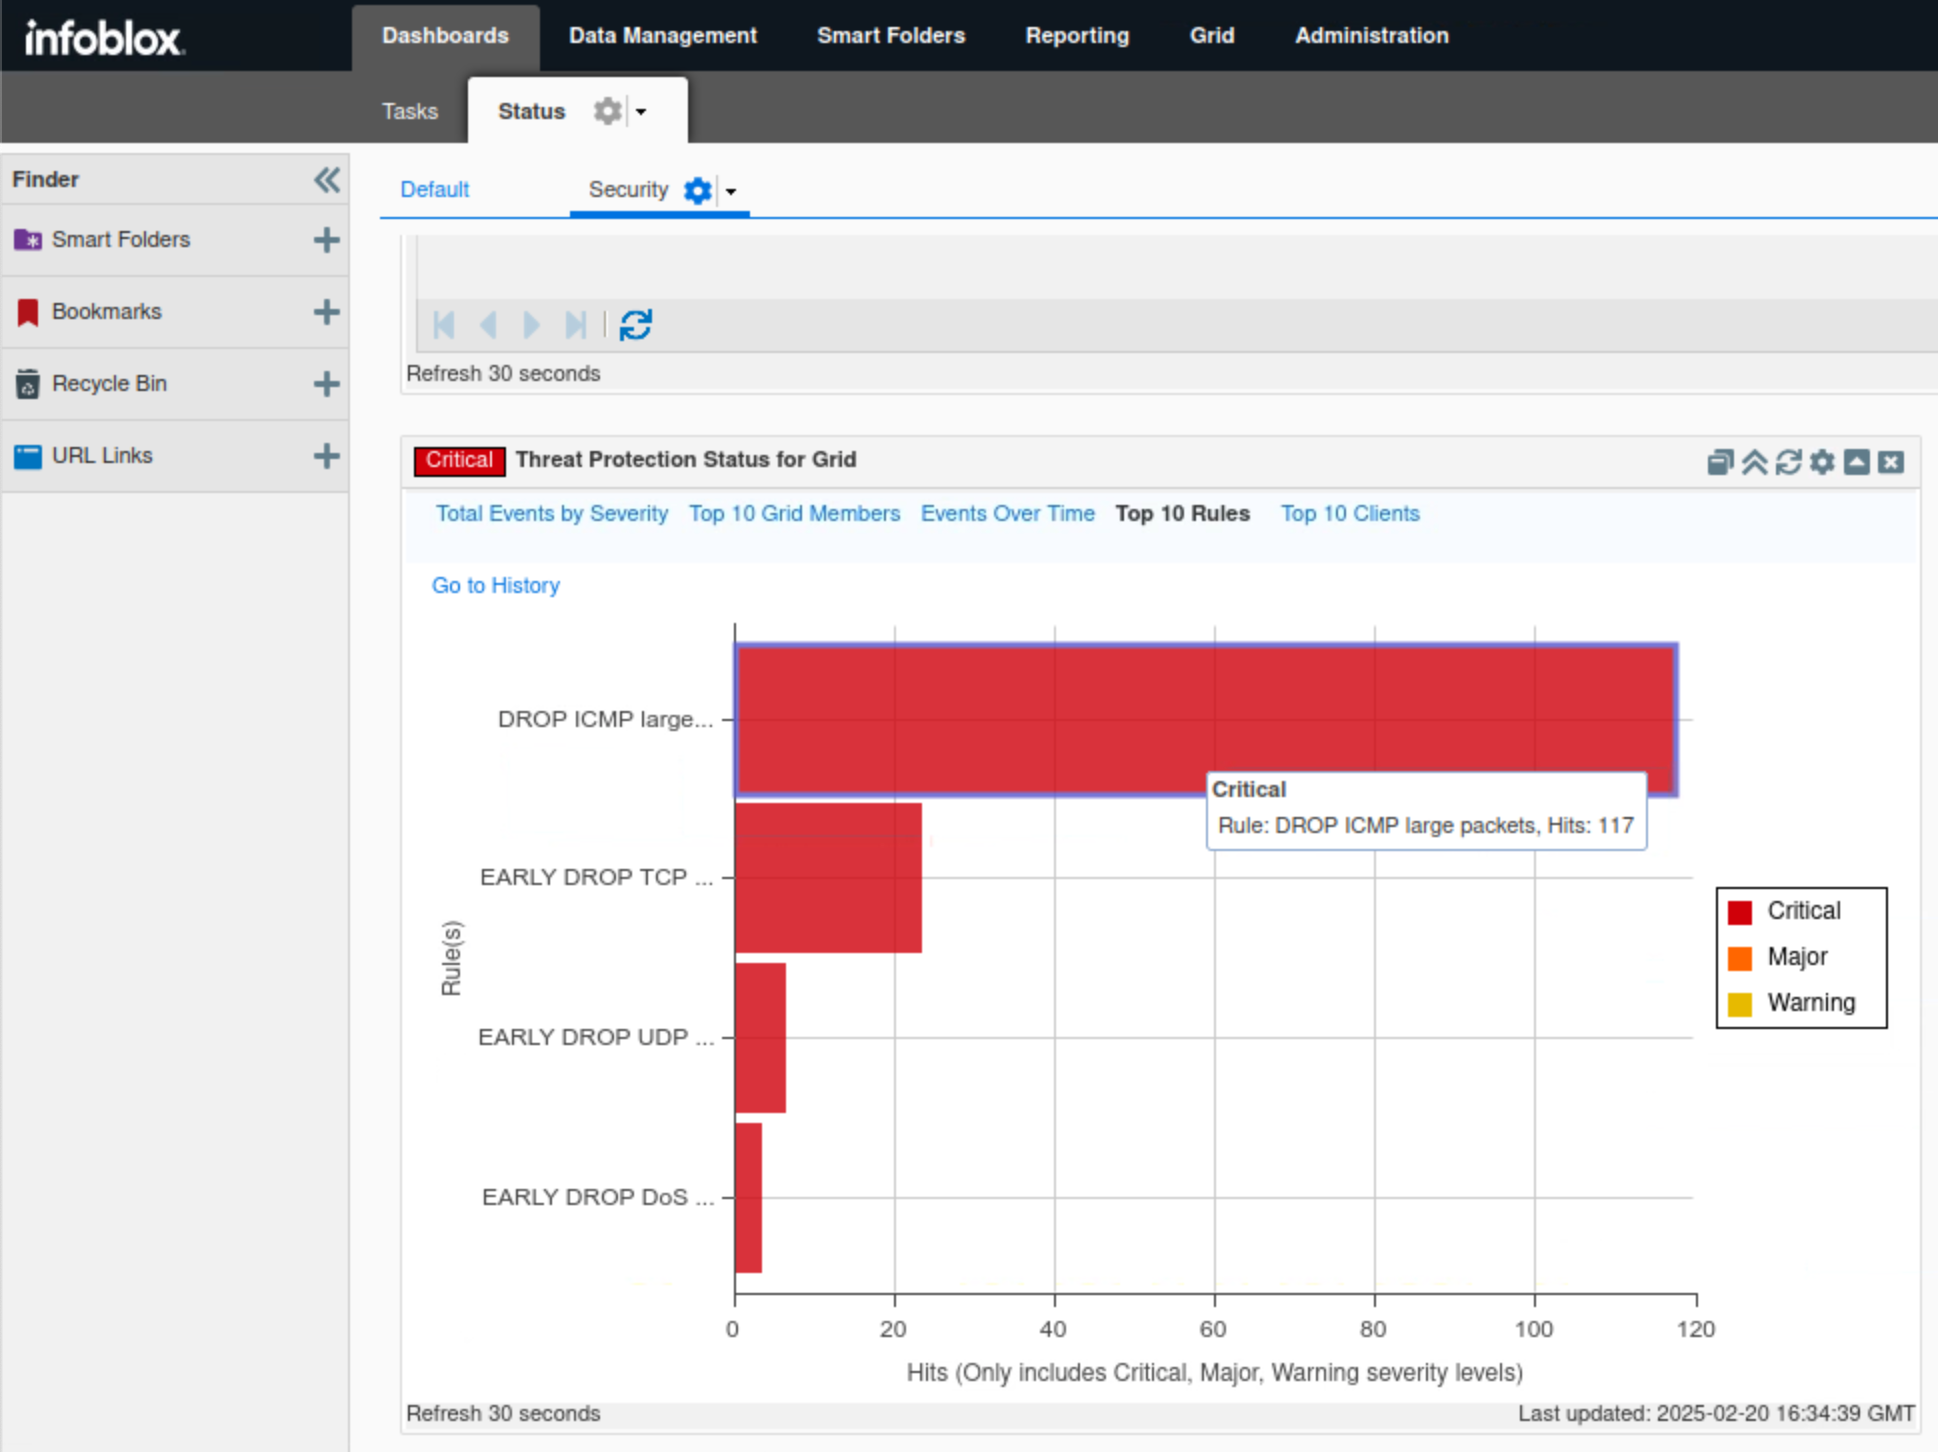
Click Top 10 Rules.
This tab, in bar chart format, breaks down the number of events triggered by each Threat Protection rule category.
In this example, we can see that the DROP ICMP LARGE PACKETS category is topping the charts with 117 critical hits.
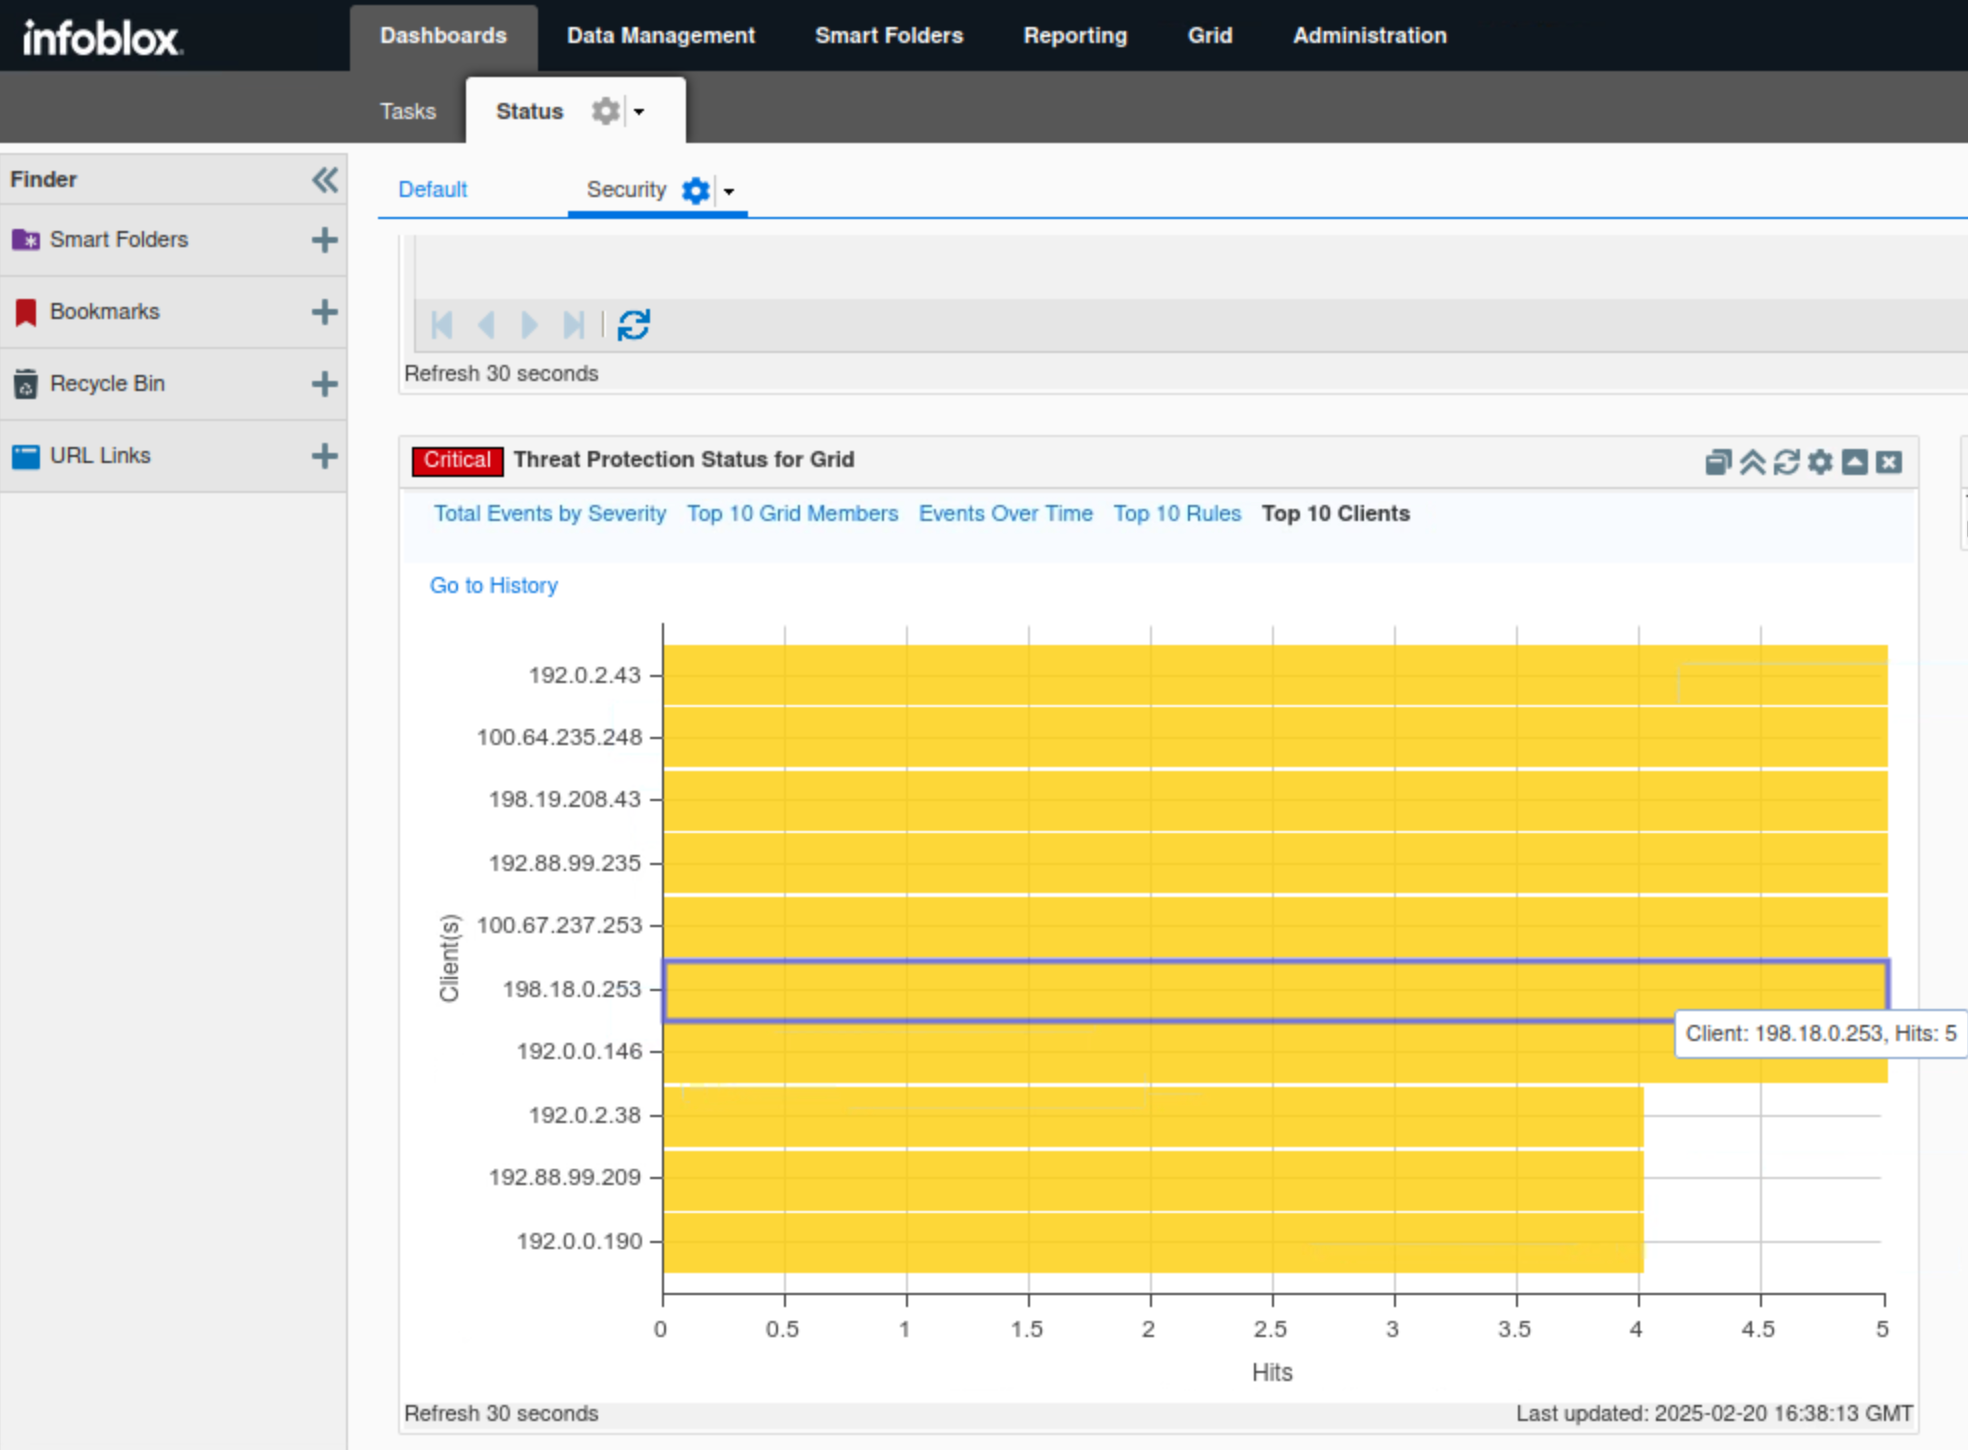
Click Top 10 Clients.
This tab, in bar chart format, breaks down the number of events triggered by each source.
In this example, all seven IP addresses 192.0.2.43, 100.64.235.248, 198.19.208.43, 192.88.99.235, 100.67.237.253, 198.16.0.253 and 192.0.0.146 are tied with 5 hits each.
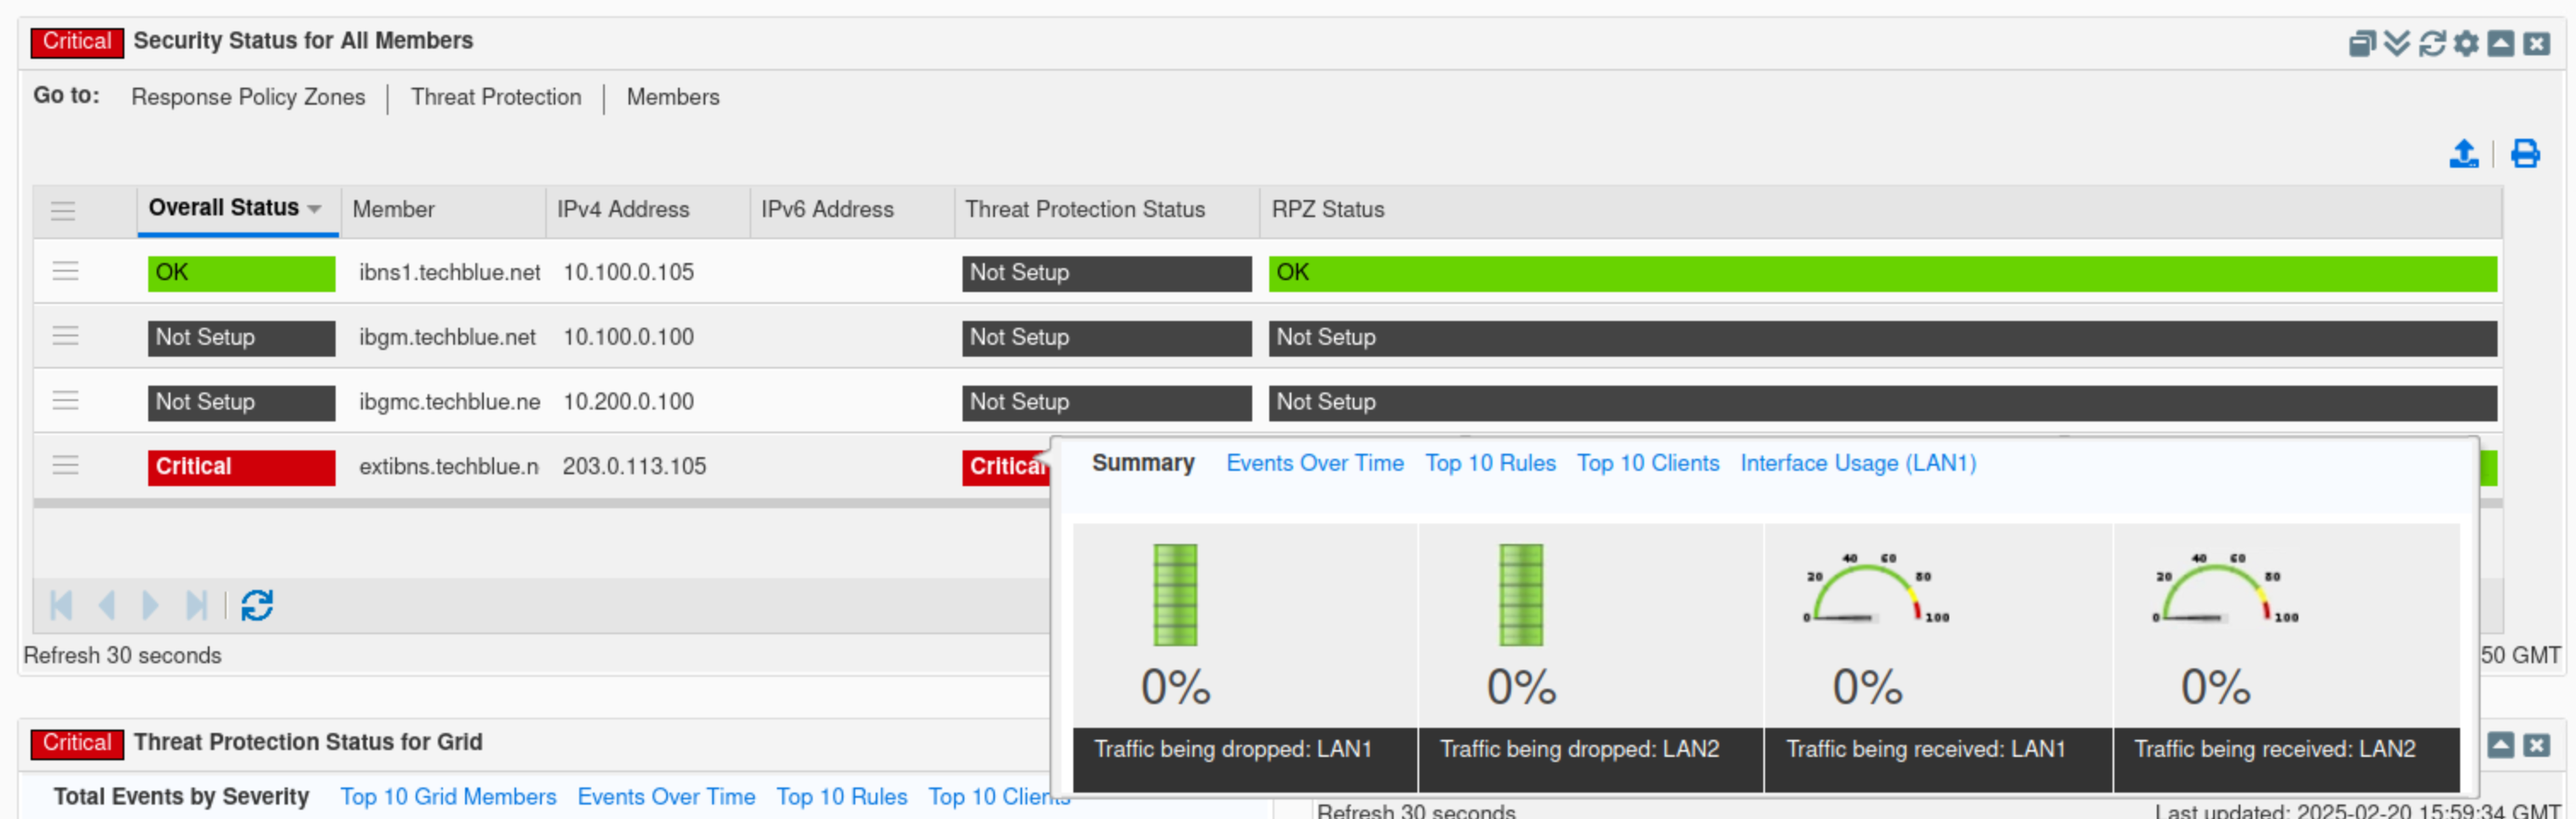
Find the Threat Protection Status for member widget.
Click the cog wheel icon.
Select extibns.techblue.net.
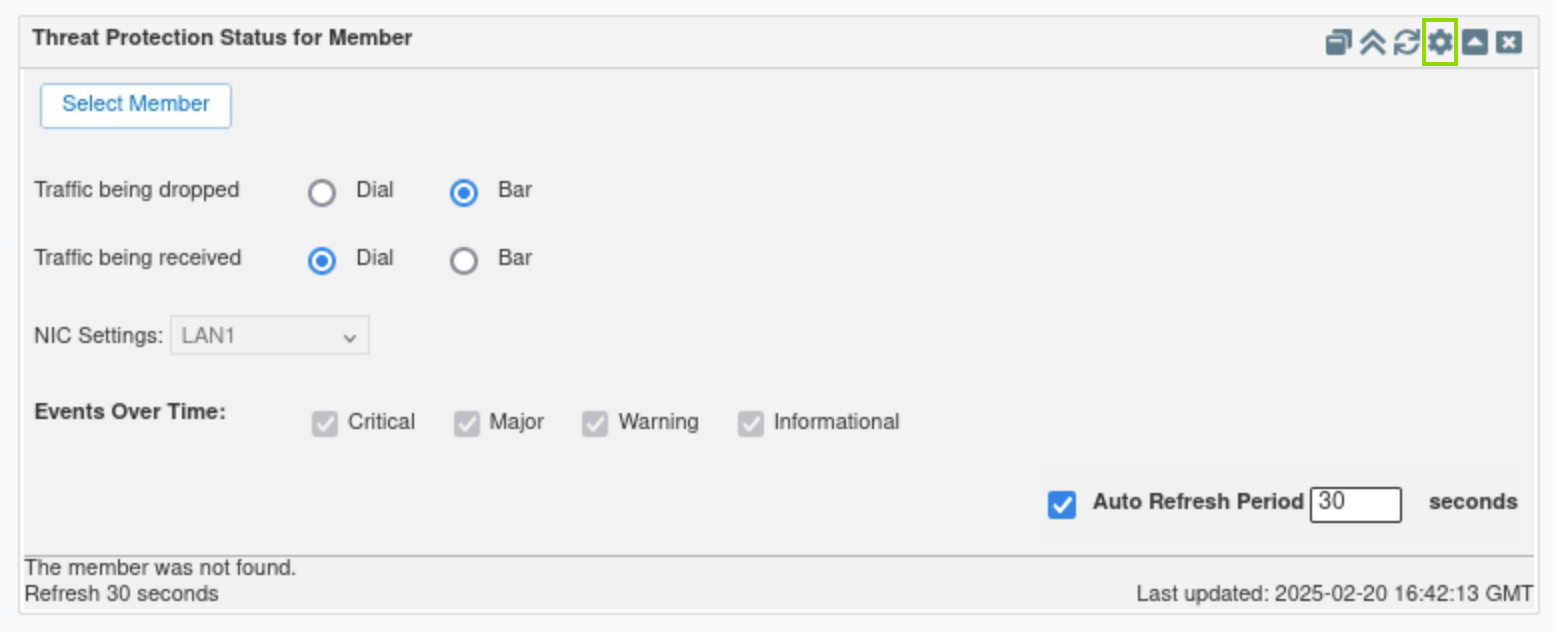
This widget displays information similar to the Threat Protection status for the Grid but for a selected Grid member.
The widget contains five tabs: Summary, Events Over Time, Top 10 Rules, Top 10 Clients, and Interface Usage.
Task 3 Solution: Investigate the available Reporting Server Dashboards for Threat Protection (ADP)
In this task, we will use the reporting server to explore default reports and dashboards, adding historical context to recent events. The NIOS security dashboard shows current grid activity, while the Reporting Server provides historical data. We will focus on analyzing what Threat Protection (ADP) categories were triggered and how many times they were triggered, identifying affected Grid members and sources of the attack. Then, generate a pdf with our findings to report to management.
Please allow 25 to 30 minutes for the Reporting Server to pull data off the Grid and populate its Dashboards and Reports. This waiting time is only required for this simulated lab environment, as the Grid and the Reporting Server haven’t had enough time to sync.
Navigate to Reporting.
Click Continue to app setup page
Enter the following File Server Settings:
Click Save, and you will be taken to the Reporting Home Dashboard
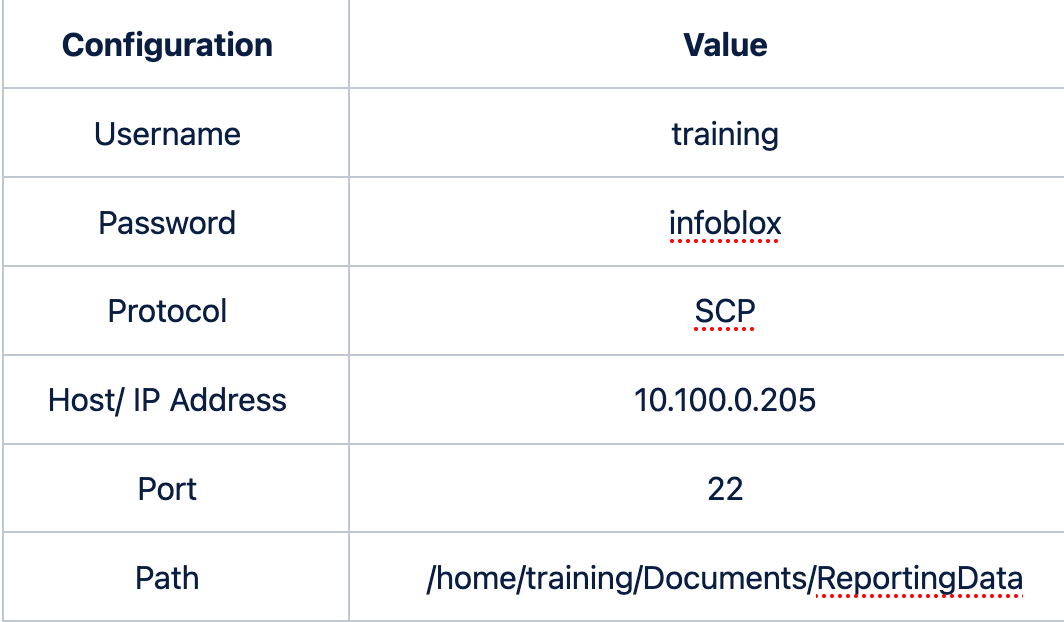
Click on Reports.
Type threat protection in the filter box.
There are eight default Reports; in this lab, we will focus on four of them: Threat Protection Event Count by category, Threat Protection Event Count by member, Threat Protection Event Count by rule, and Threat Protection Event Count by time.
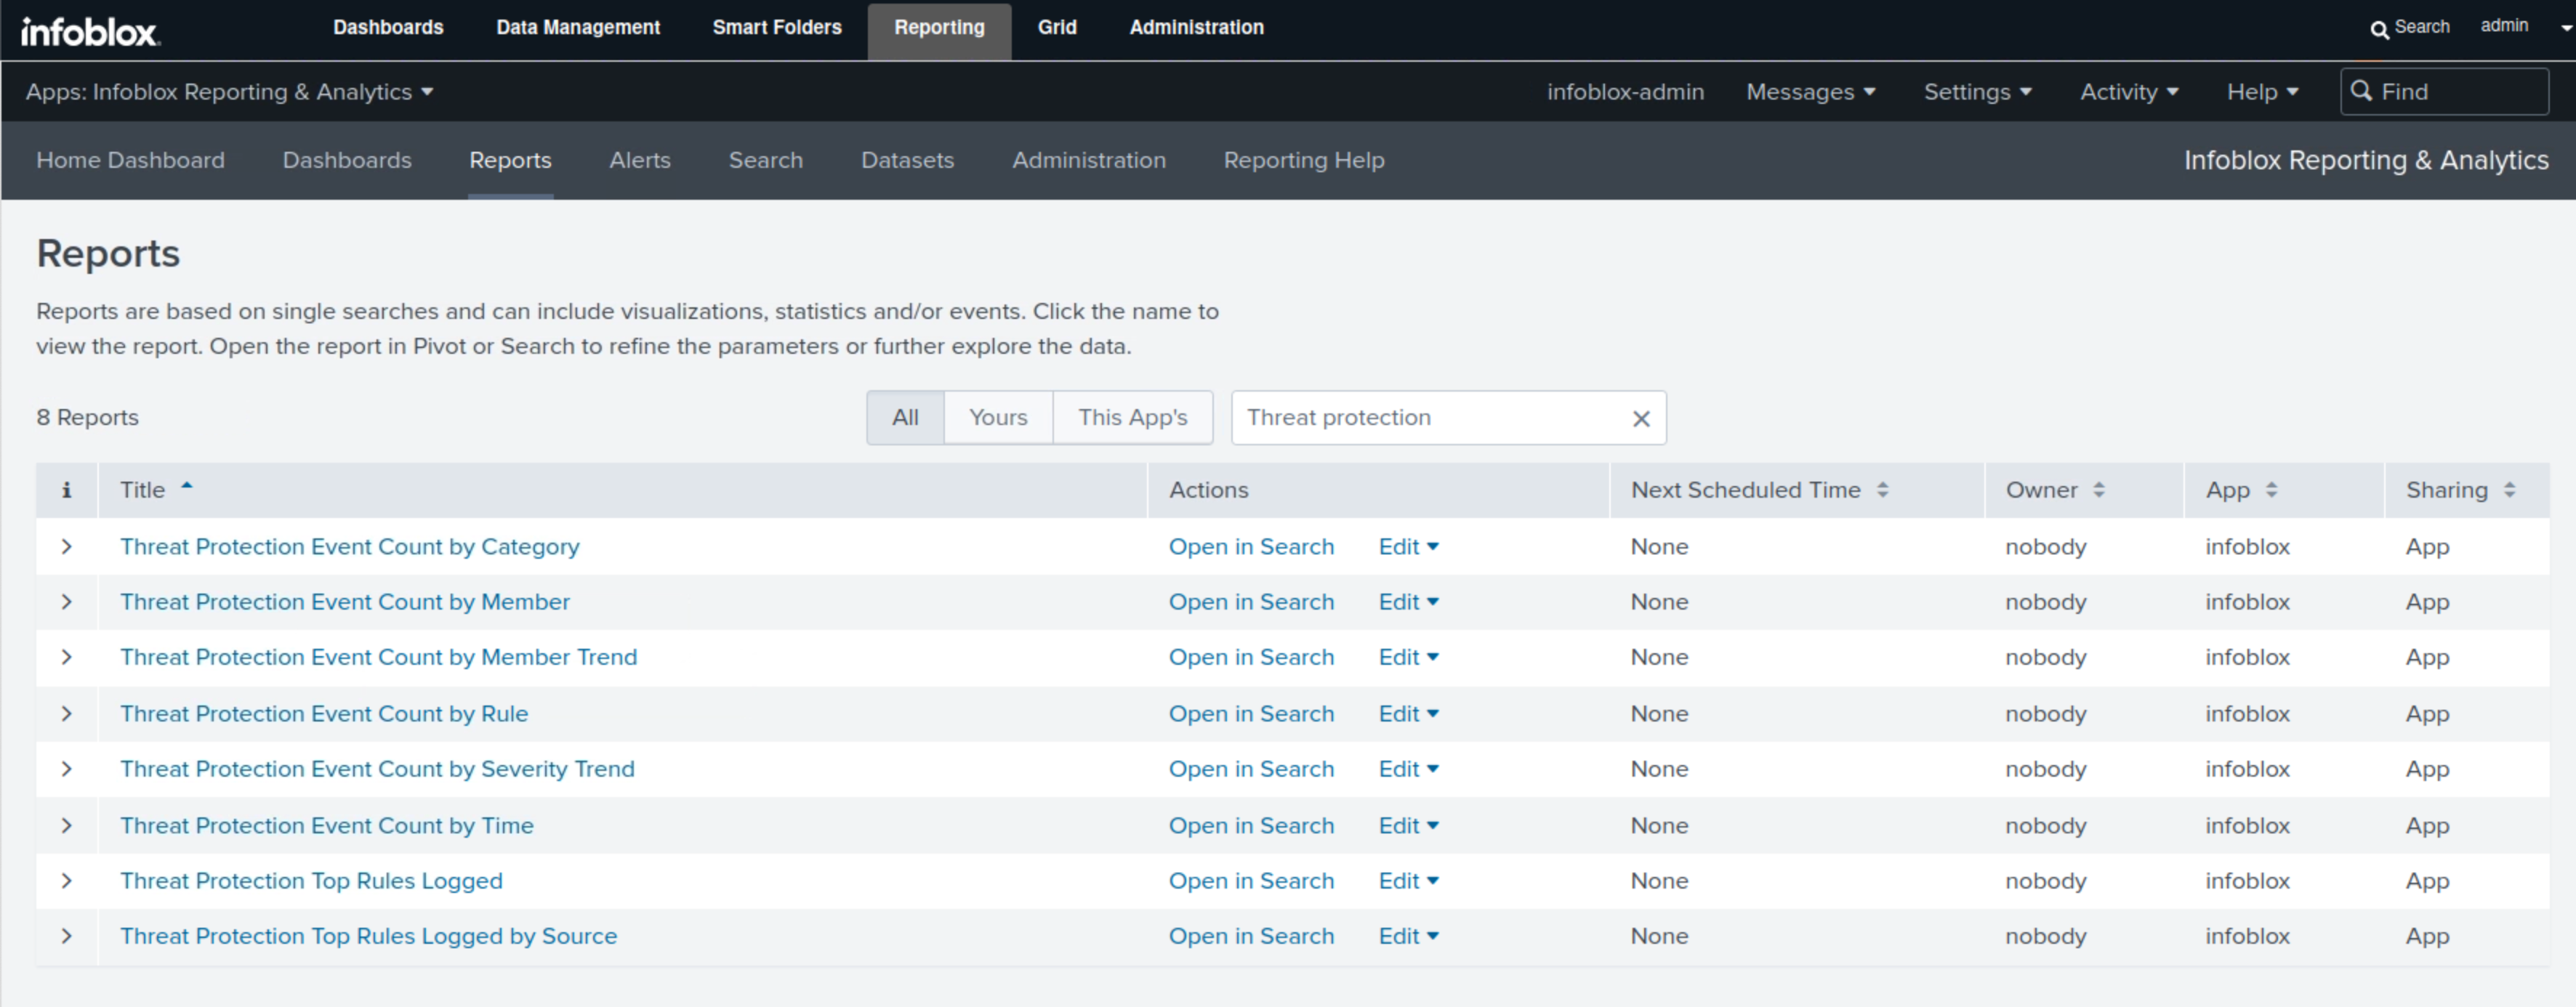
Select Threat Protection Event Count by category.
This report displays the total number of Threat Protection (ADP) events per category and severity level in bar charts and tables.
In this example, we can see that the categories of OSPF, ICMP, and DHCP are at the top, and we can also see the breakdown of the number of events per severity level for each category.
Repeat Steps 5 and 6 for the following reports:
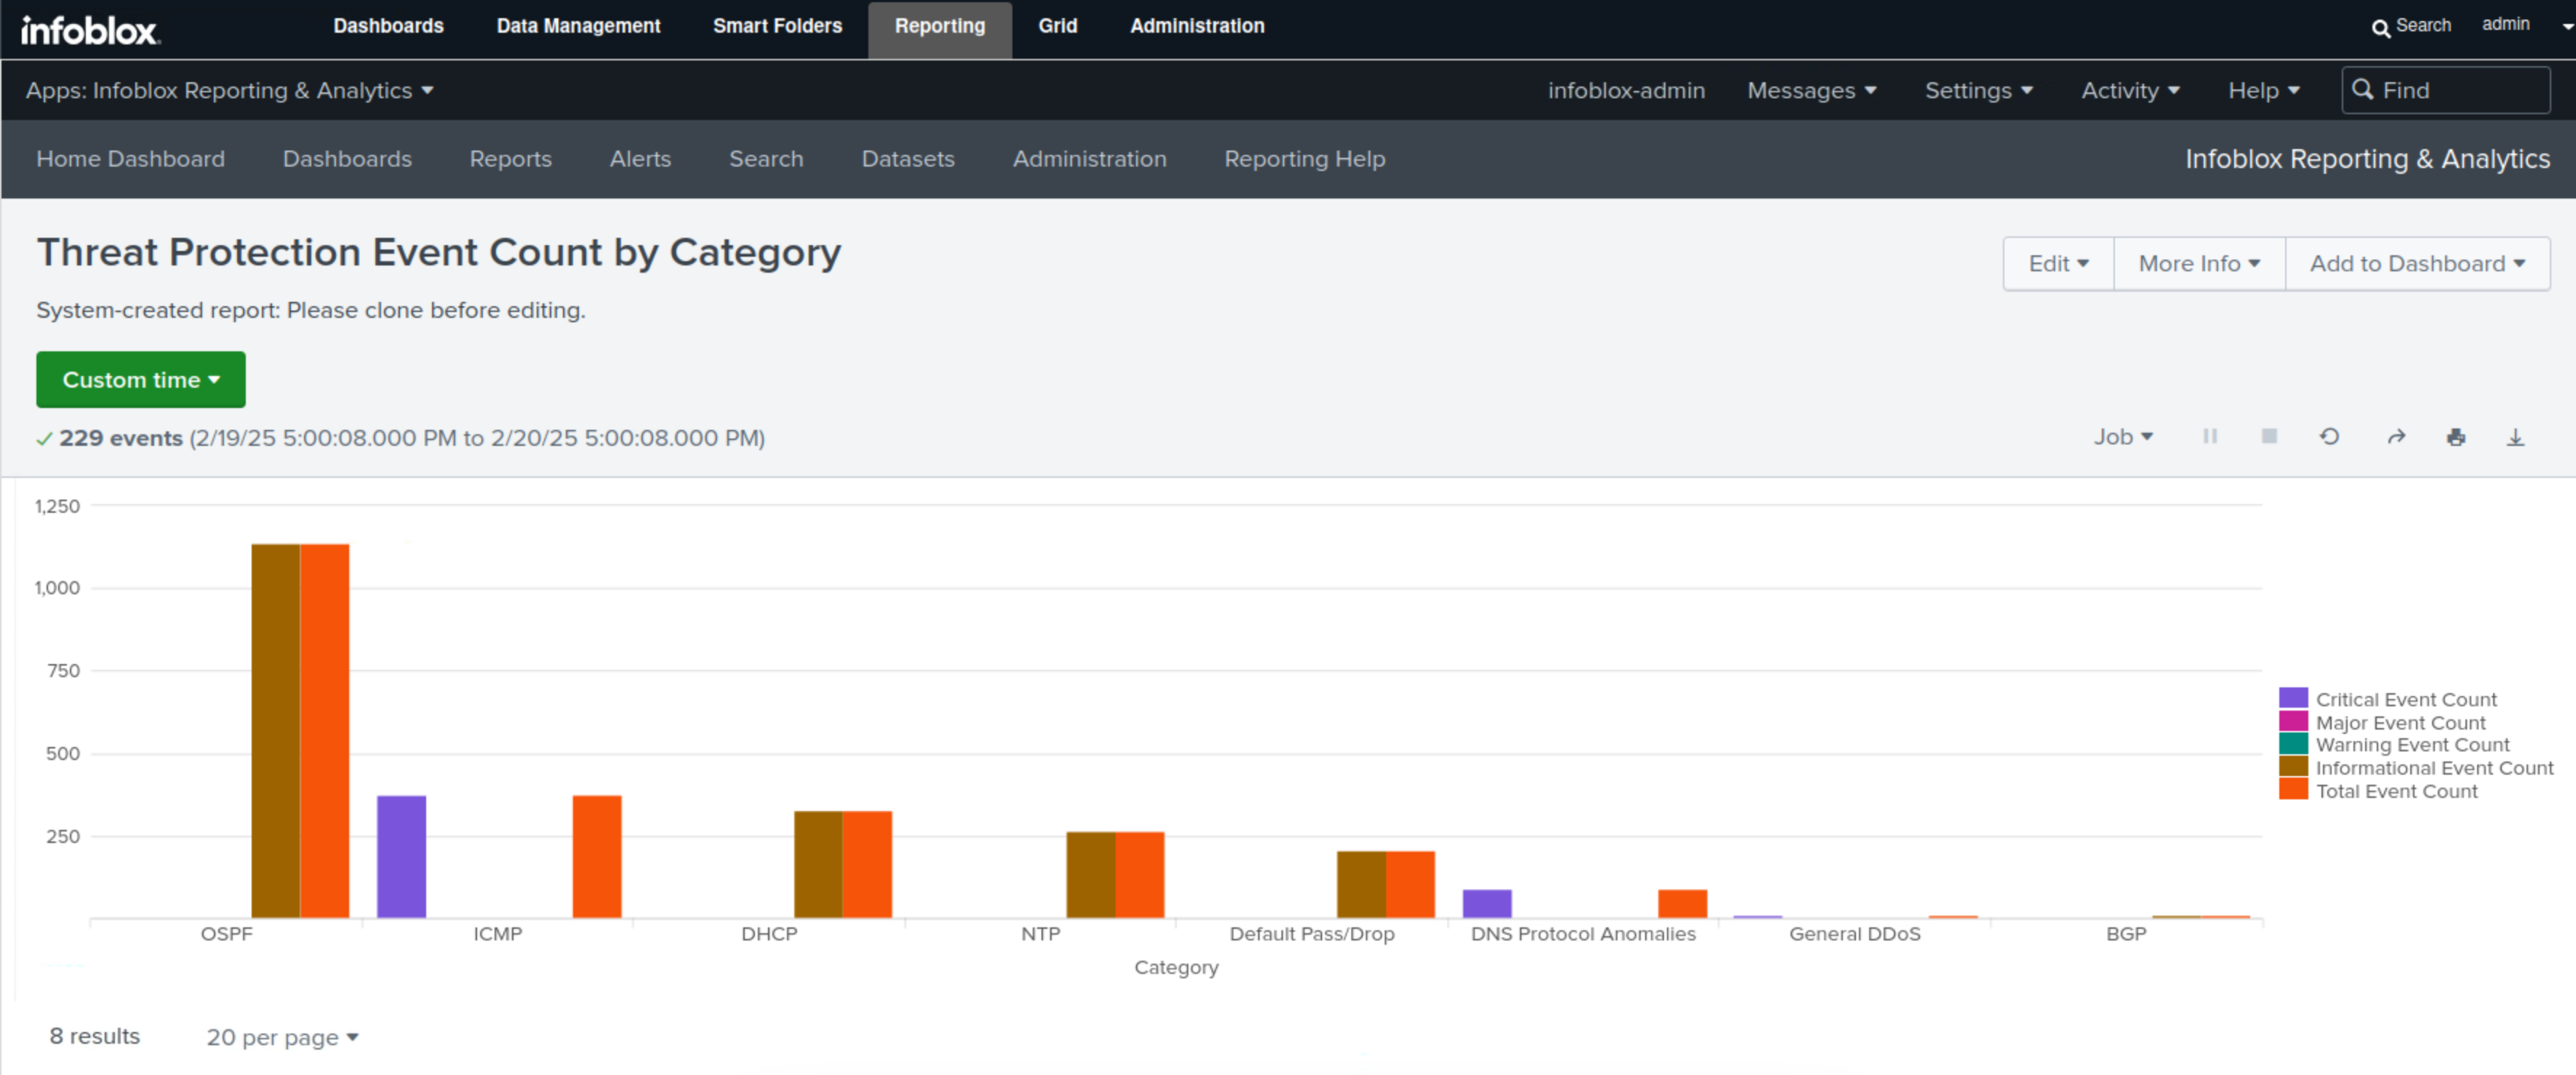
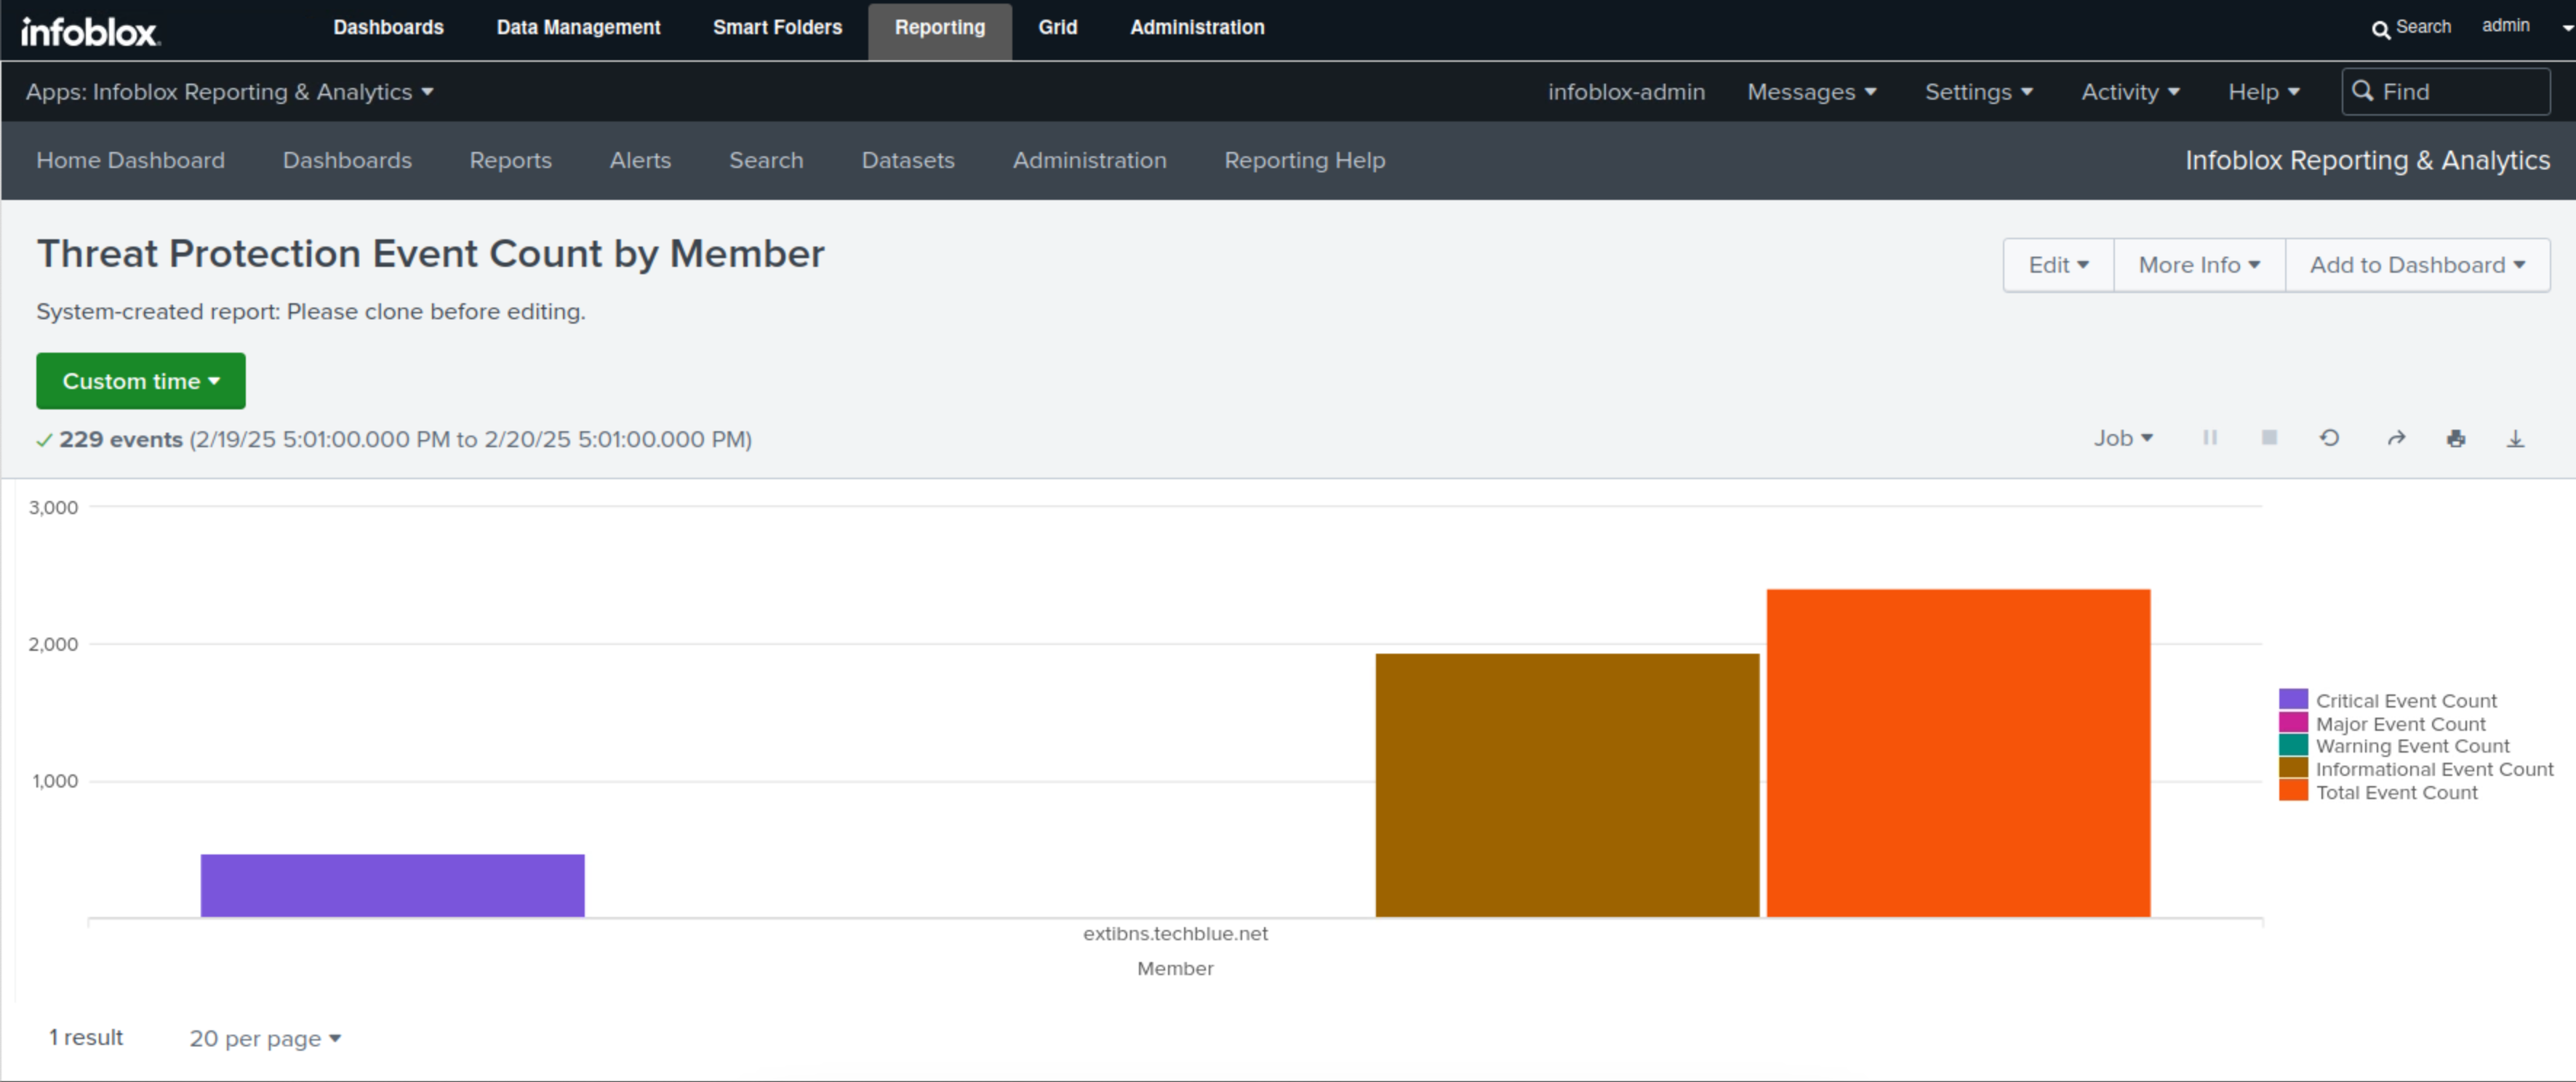
Select Threat Protection Event Count by member.
This report displays each member's total Threat Protection (ADP) event count, broken down into severity levels in bar charts and tables.
In this example, we only have one Threat Protection (ADP) enabled member, ibns2.techblue.net. The whole graph will be dedicated to it, and we can clearly see the total number of events represented by the orange bar and its breakdown in different severity levels, which are critical, represented in purple, and informational, represented in brown.
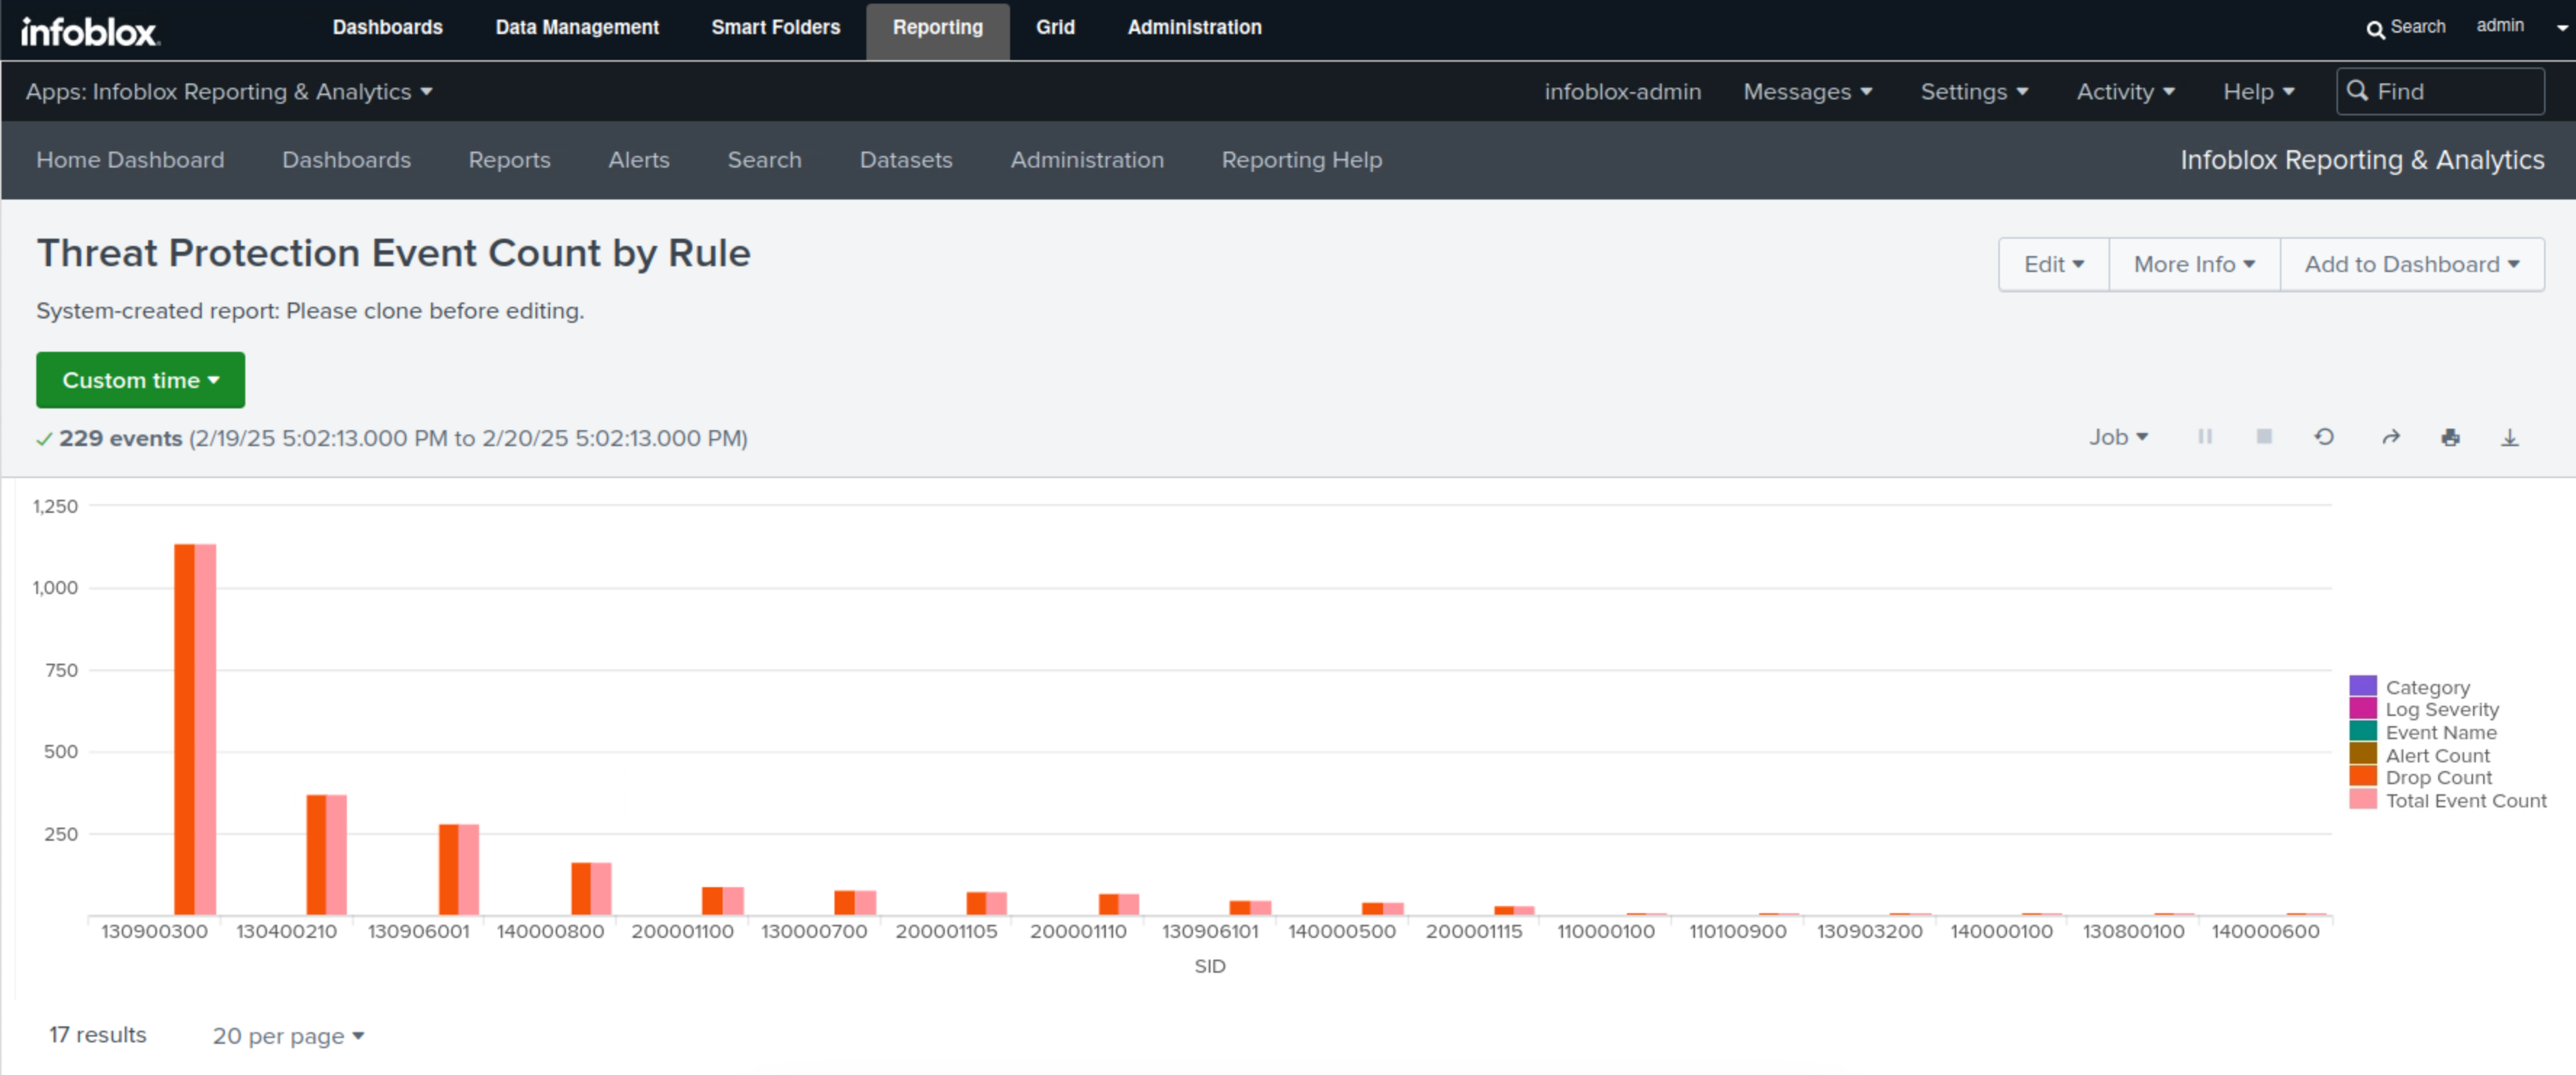
Select Threat Protection Event Count by rule.
This report displays all the Threat Protection (ADP) rules, the total number of triggers for each rule, and the actions taken by each rule in bar charts and tables.
In this example, the rules 130900300 and 130400210 are the two most triggered, with the action of Drop.
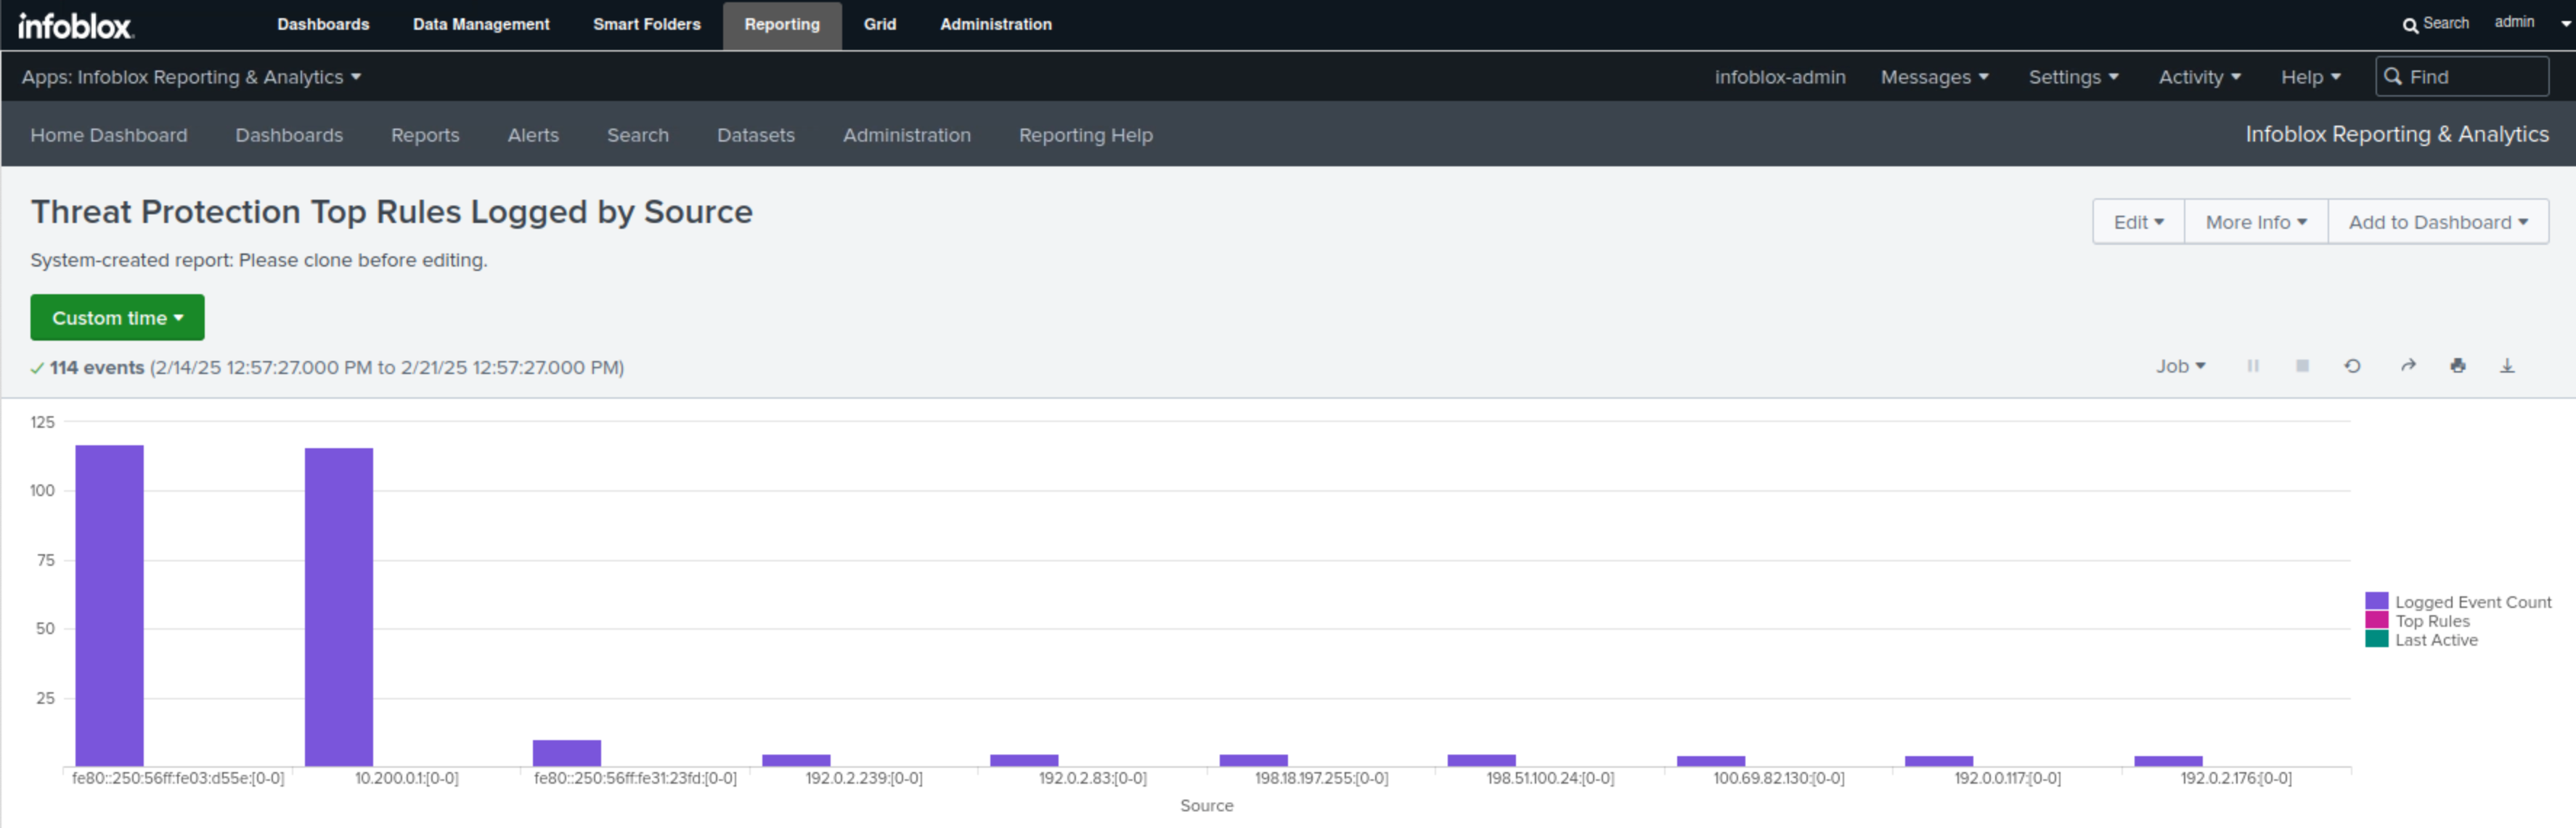
Select Threat Protection Top Rules Logged by Source.
This report displays in bar charts and tables all the IPv4 and IPv6 addresses associated with Threat Protection (ADP) rule triggers and the number of events each IP address triggered.
In this example, we can see that the IPv6 address fe80::250:56ff:fe03:d55e has the highest number of triggers, 117, followed by the IPv4 address 10.200.0.1, which has 116.
Navigate to Reporting → Dashboards.
Type threat protection in the filter box.
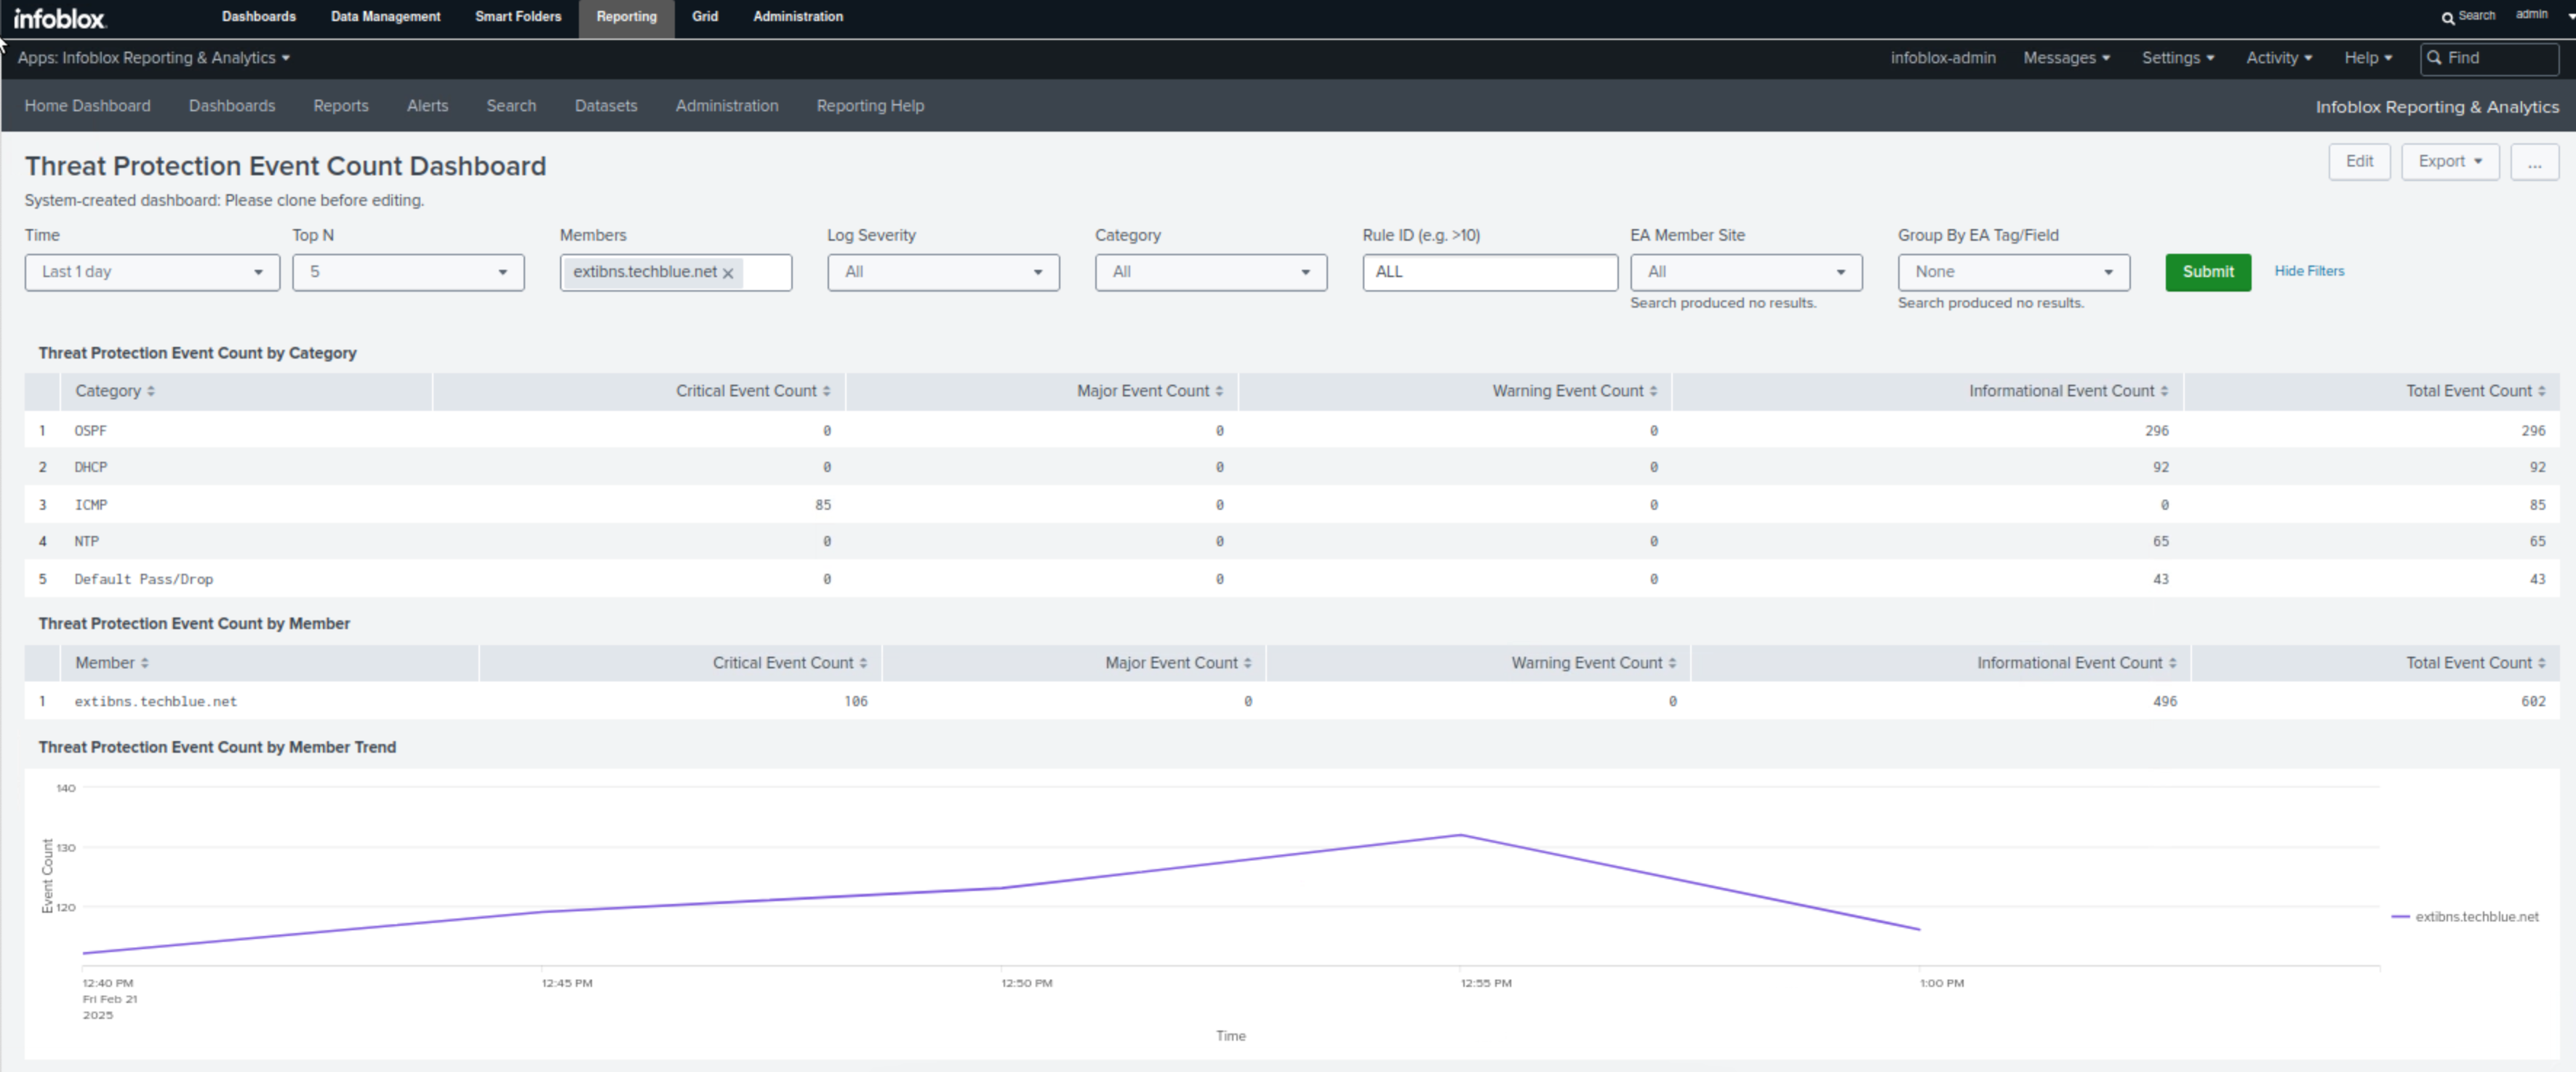
Find the Threat Protection Event Count Dashboard
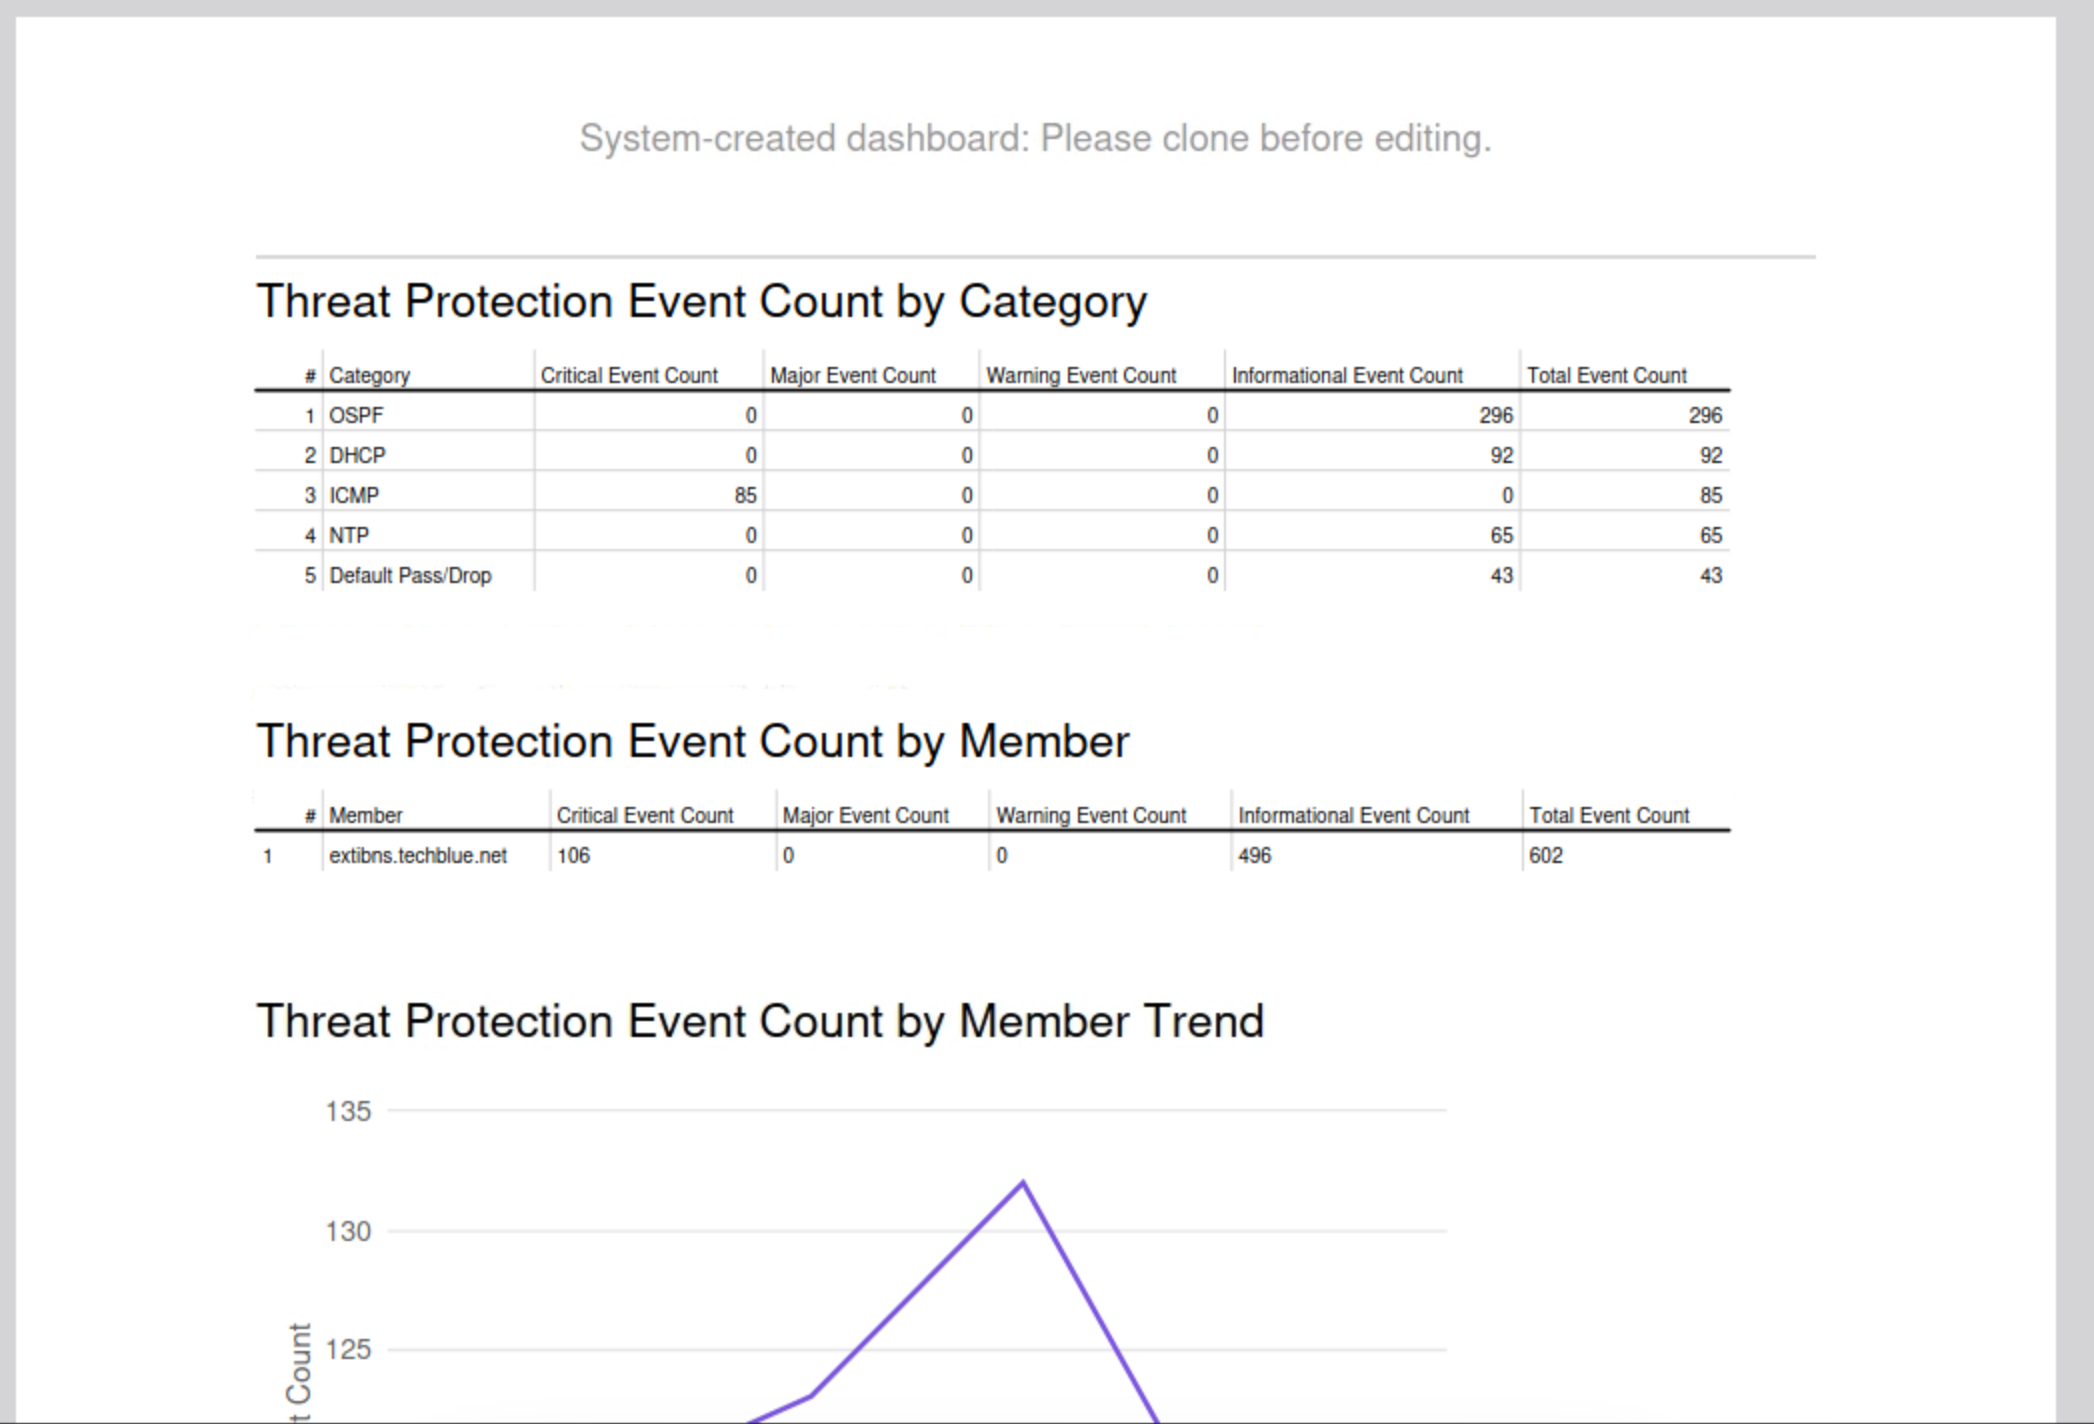
This dashboard combines all the information we gathered on one page; we can view event count by category, Affected members, event count by rule, and trend graphs of events per member and per severity level.
In our scenario, this is the perfect dashboard to present to management.
Click on Export
Select Export as PDF
Task 4 Solution: Configure SNMP traps
In this task, we configure SNMP Traps for the Grid to be triggered when DNS traffic exceeds a preset threshold. This will allow us to react faster to DDoS or any future Threat Protection (ADP) triggering attacks. The traps will be sent to the SNMP receiver 10.100.0.10.
NOTE: In this lab, we will not configure or adjust SNMP Thresholds; we will use the system’s default presets.
Navigate to Grid → Grid Manager → Members.
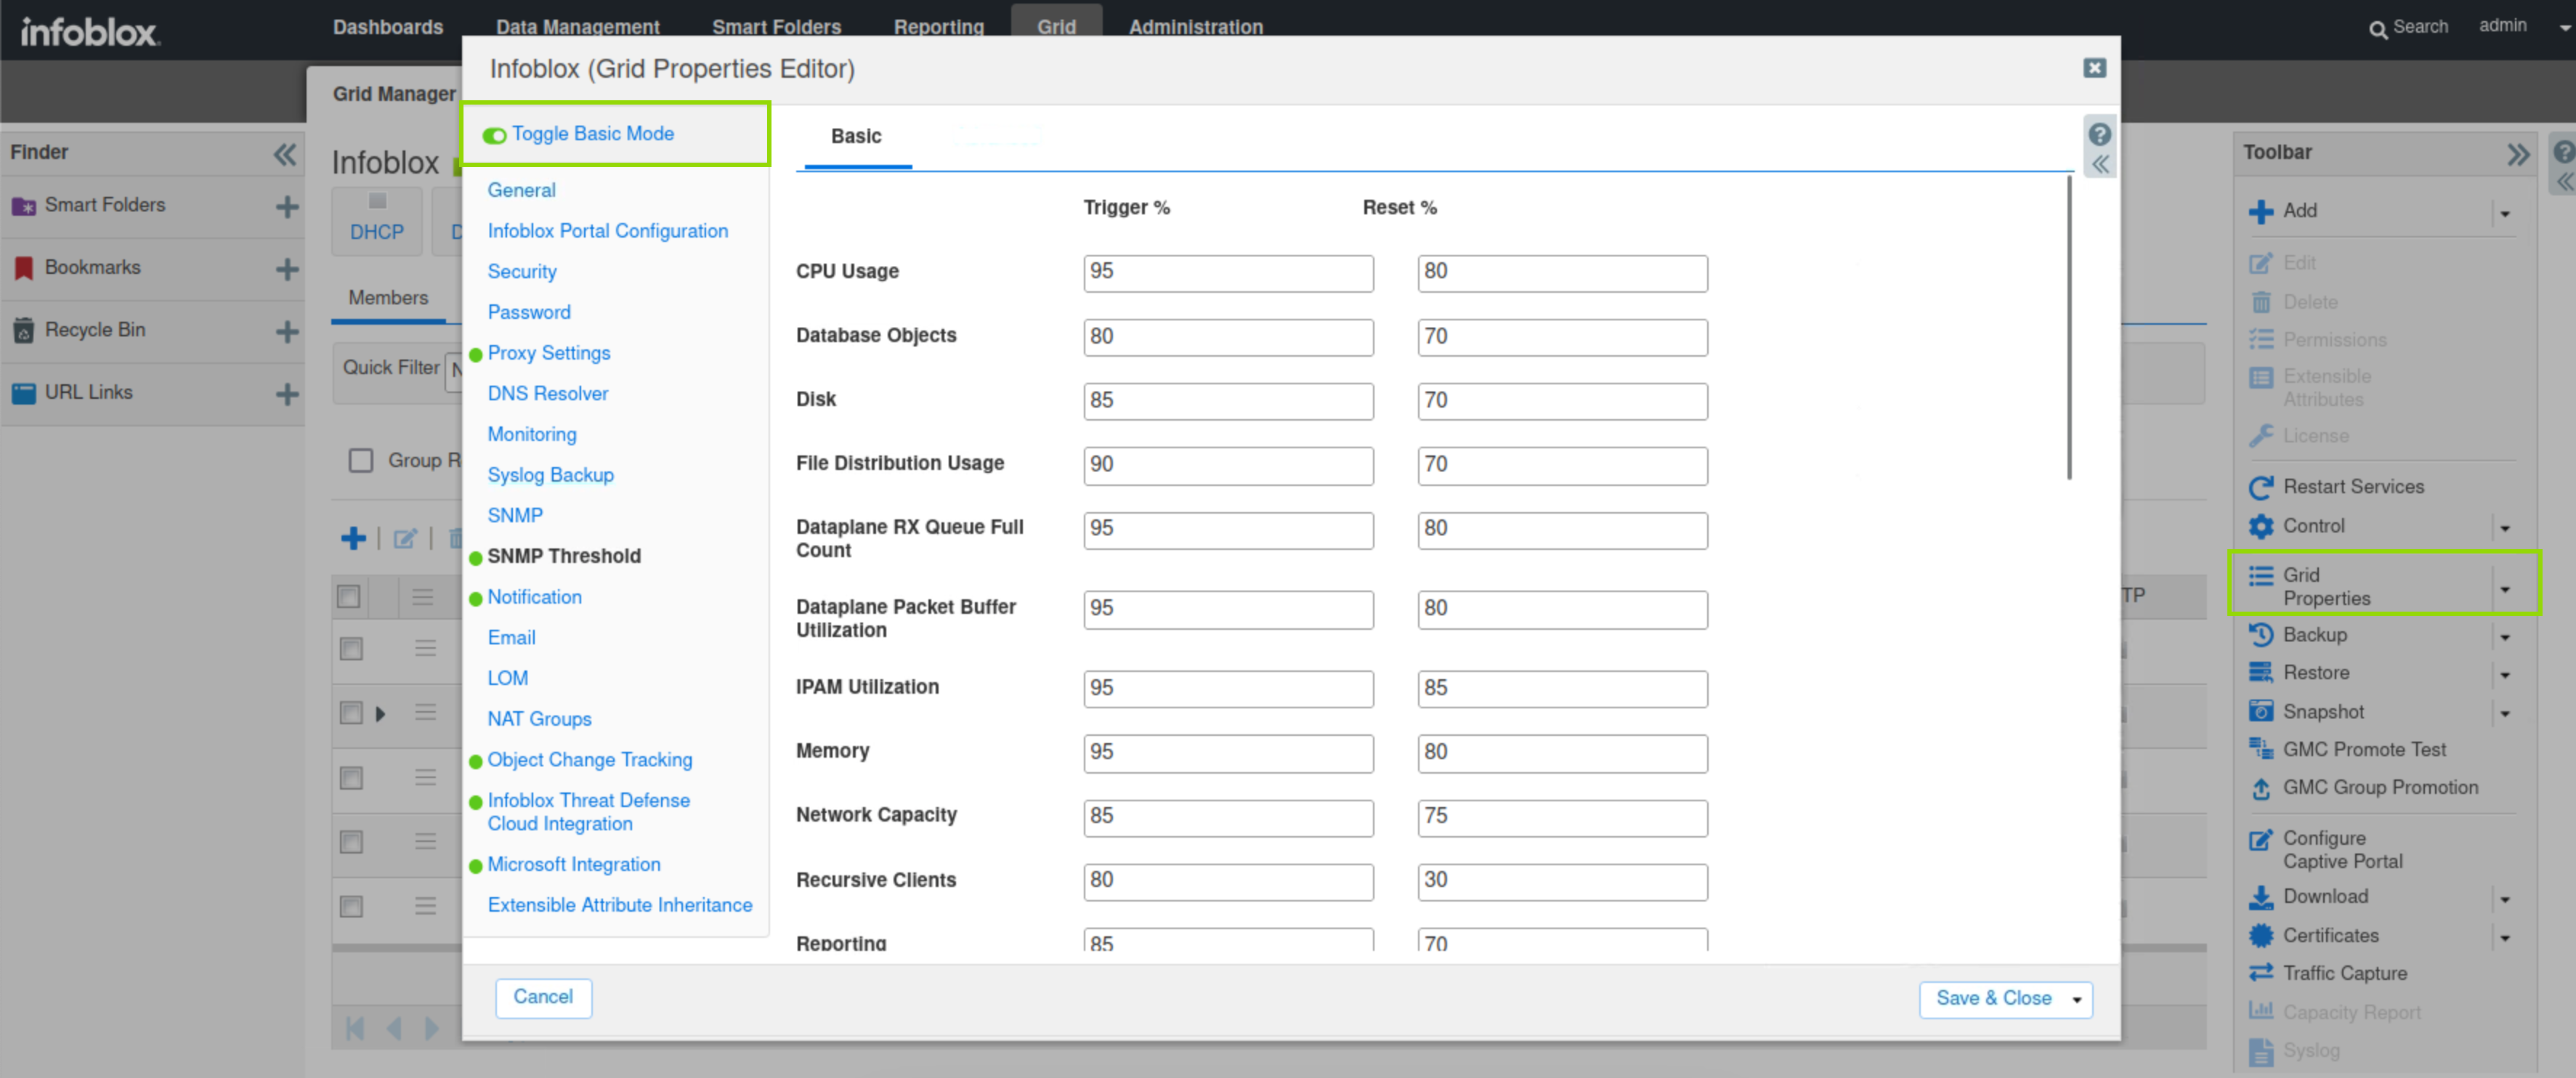
Click Grid Properties in the Toolbar.
Toggle Advanced Mode.
Select SNMP Thresholds.
View the preset Thresholds for the grid. The first column (trigger %) is the value at which an SNMP trap is sent, and the second column (reset %) is when the grid returns to its normal state and the trap is reset.
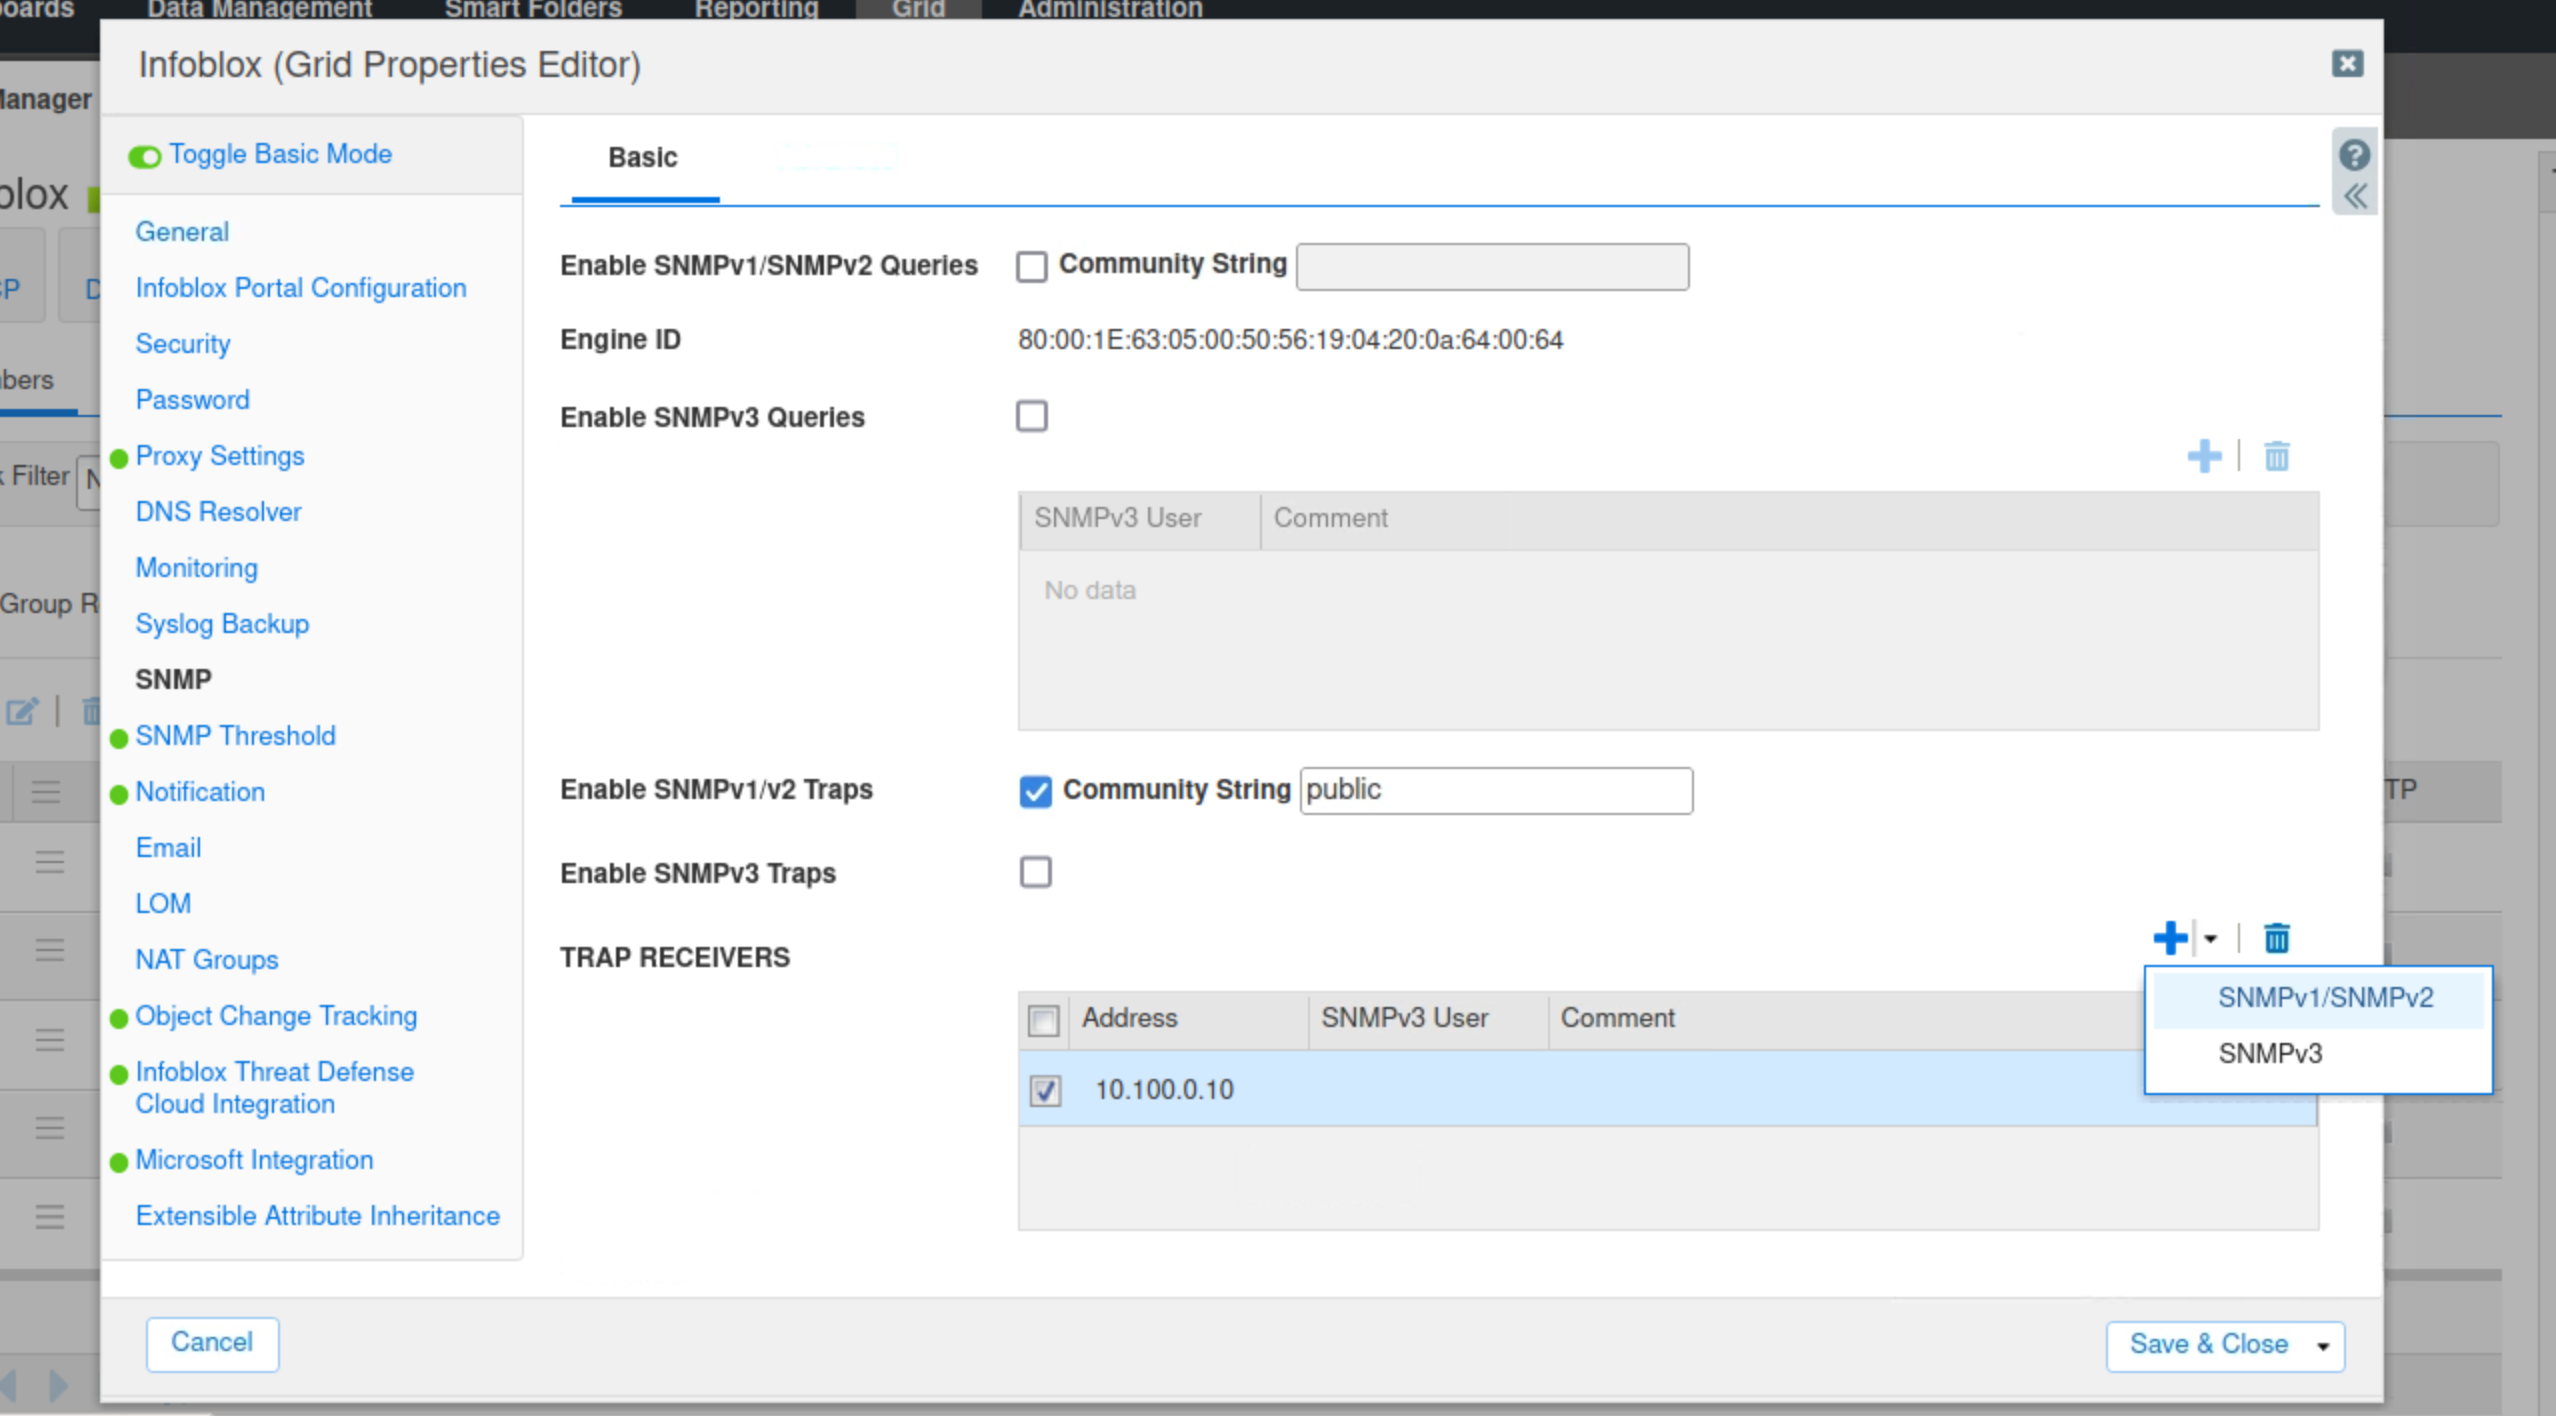
Select SNMP.
Check the SNMP v1/v2 Traps box.
Enter public for the community string.
Click the plus (+) symbol to add an SNMP v1/v2 Trap Receiver.
Use the IP address 10.100.0.10 for the trap receiver.
Click Save & Close.
When prompted with an SCP Warning, click Yes for confirmation.