This lab requires a NIOS 9.0 Lab Environment
This lab guide has been developed using the new NIOS 9.0 Lab Environment. Please ensure that you deploy a NIOS 9.0 lab environment to complete these lab tasks. If you use a different lab environment, this is untested, and the lab likely will not work.
Scenario
Your organization is implementing DNS Traffic Control (DTC) to improve operational visibility and management of traffic control configurations. In addition to directing traffic, administrators need the ability to monitor DTC activity, analyze events, and manage configurations through export and import operations.
In this lab, you will configure logging and reporting for DTC, simulate an outage to observe system behavior, and set up alerts for critical events. You will also practice exporting and importing DTC objects to support ongoing administration and data management.
Estimate Completion Time
-
30 minutes
Credentials
|
Description |
Username |
Password |
URL or IP |
|---|---|---|---|
|
Grid Manager UI |
admin |
infoblox |
Requirements
-
Administrative access to the Grid
Lab Initiation
Access jump-desktop
Once the lab is deployed, you can access the virtual machines required for this activity. To begin, select VM List from the navigation bar at the top, locate jump-desktop, and click the green play icon to open its console. Log in to the Linux UI.

Username: training
Password: infoblox
Initiate lab
To initiate the lab, double-click the Launch Lab icon on the Desktop.

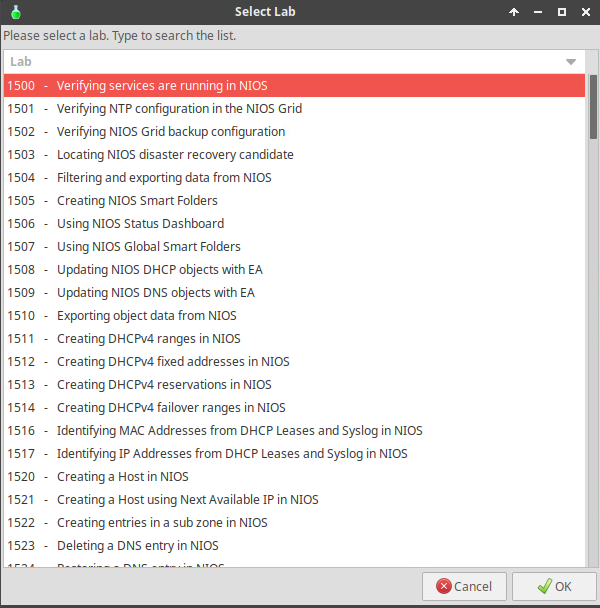
Choose the lab number from the list and click OK.
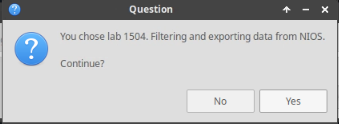
After clicking OK, you will see a pop-up message with a brief description of the lab task. If the description looks correct, click Yes to continue lab initiation.
Lab initiation will take a couple of minutes to finish.
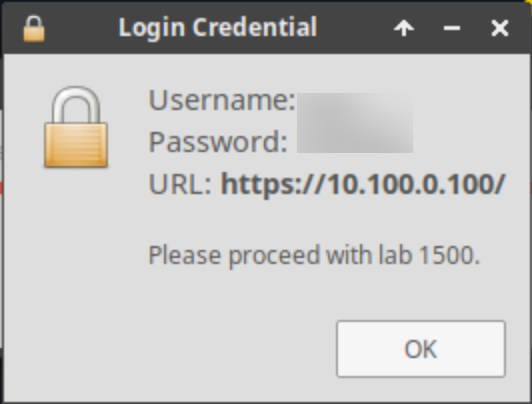
Once complete, you will see another pop-up message with the login credentials and the URL for the Grid Manager’s User Interface. Note that the credentials may differ from those from prior labs.
Tasks
Task 1: Configure Reporting and Analytics App
Configure the Reporting and Analytics App with the following information:
Table 2585-1
|
Configuration |
Value |
|
Username |
training |
|
Password |
infoblox |
|
Protocol |
SCP |
|
Host/ IP Address |
10.100.0.205 |
|
Port |
22 |
|
Path |
/home/training/Documents/ReportingData |
Task 2: Enable Logging for DNS Traffic Control
Enable logging for DNS Traffic Control-related activities from the Grid DNS Properties. This will ensure that all DTC events are recorded, providing valuable data for monitoring and troubleshooting.
Task 3: Simulate an Outage and Review the logs
Simulate an outage by disabling IPs in Pool B. Log in to the Support-server VM, open a Terminal, and execute the dtc-remove-secondary command to disable the server IP’s in Pool B (10.200.0.210 and 10.200.0.220). After completing this step, review the logs from Grid Manager UI to observe the entries related to the outage, such as offline status updates for servers from Pool B.
Task 4: Export DTC Objects to CSV
Export the DNS Traffic Control (DTC) objects from the Grid as a CSV file.
Task 5: Import DTC Objects from CSV
Import DTC objects into the Grid from the DTC-data.csv file located on the Desktop
Task 6: Configure Reporting Alerts for DTC Monitoring
Set up alert notifications in the Grid Manager to proactively monitor critical DTC events. Configure these alerts to trigger notifications for specific DTC activities, allowing prompt action when important changes or issues arise.
Solutions
Task 1 Solution: Configure Reporting and Analytics App
Set up the reporting server using the steps below:
-
Navigate to Reporting.
-
Click on Continue to app setup page.
-
Use the information from Table 2585-1 to set up the reporting server.
Task 2 Solution: Enable Logging for DNS Traffic Control
To enable logging for DNS Traffic Control:
-
Navigate to Data Management → DNS.
-
From the Toolbar panel, select Grid DNS Properties.
-
In the Grid DNS Properties window, click on the Toggle Advanced Mode link in the top left corner of the window.
-
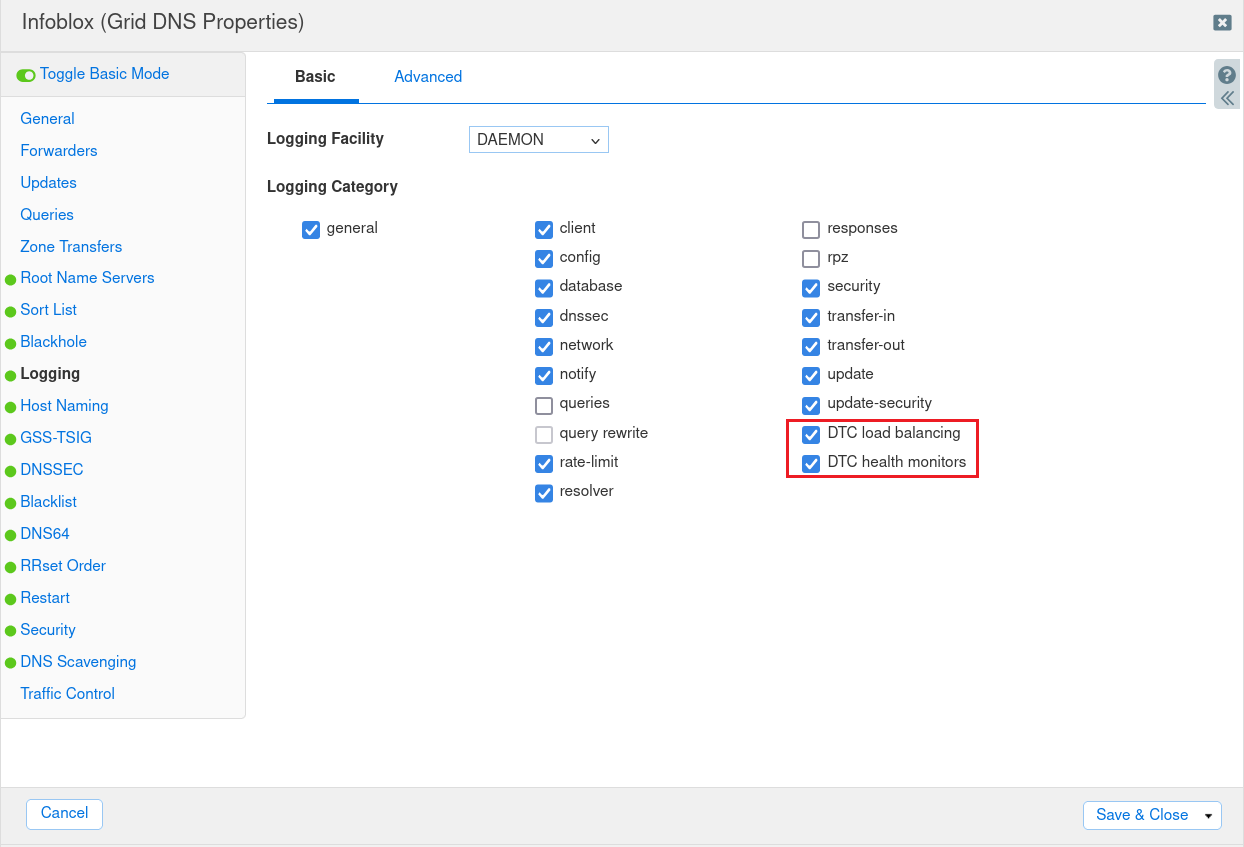
Select Logging from the left panel and check the items DTC load balancing and DTC health monitors.
-
Click Save & Close to apply the changes.
-
When prompted, select Restart Services to apply the changes.
Task 3 Solution: Simulate an Outage and Review the Logs
To simulate an outage and review the corresponding log entries:
-
Log in to the support-server VM.
-
Open a Terminal window.
-
Execute the command
dtc-remove-secondaryto disable the servers in Pool B. This will make Pool B servers unavailable, specifically srvr3.dtc.techblue.net (10.200.0.210) and srvr4.dtc.techblue.net (10.200.0.220).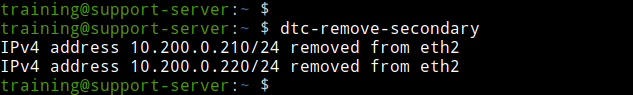
-
After executing the command, switch back to the Jump-Desktop VM.
-
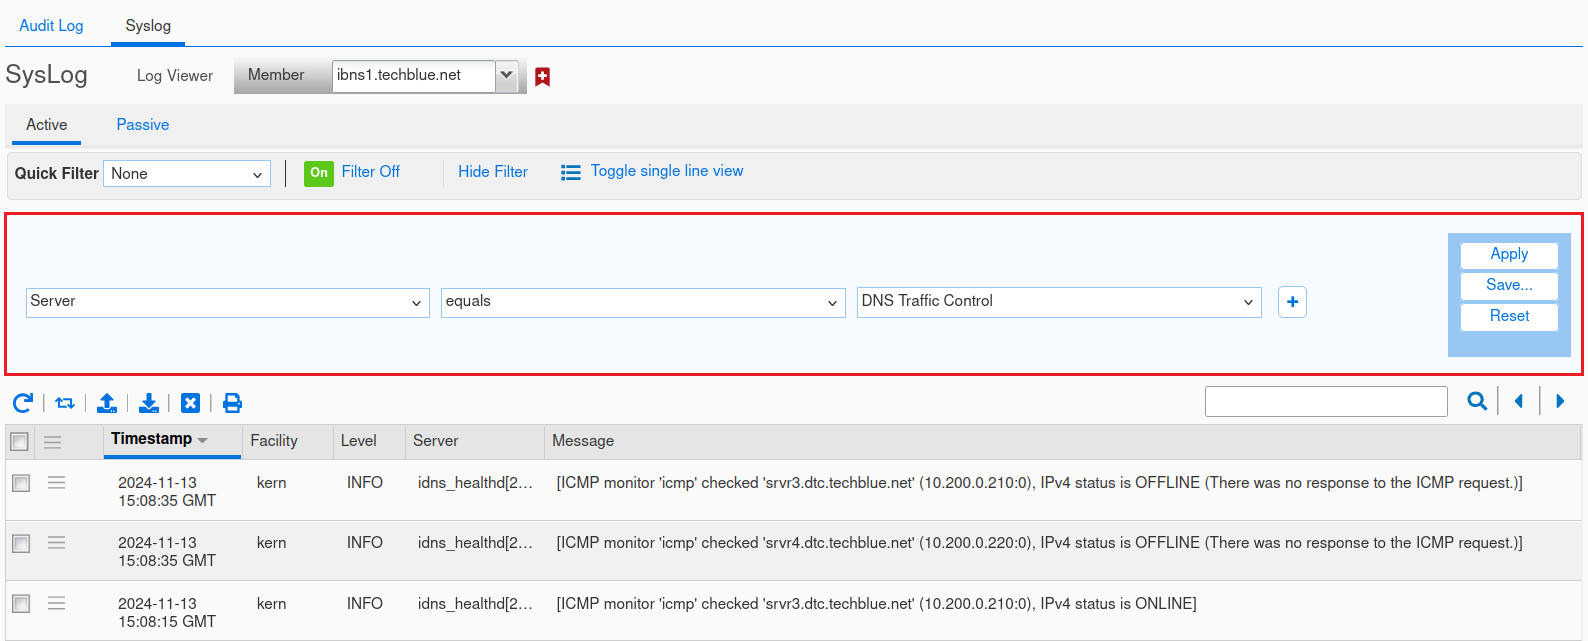
In the Grid Manager UI, navigate to Administration → Logs → Syslog
-
Select ibns1.techblue.net from the drop-down menu near the top of the screen.
-
Click Show Filter, set the filter to Server equals DNS Traffic Control, click Apply.
-
Review the logs for entries indicating that Pool B servers are offline.
Note: To recover the secondary data center server IPs, you may run the dtc-add command from support-server VM, which will re-enable srvr3.dtc.techblue.net and srvr4.dtc.techblue.net.
Task 4 Solution: Export DTC Objects from CSV
Export DTC objects to a CSV file by following these instructions:
-
Navigate to Data Management → DNS.
-
From the toolbar, click CSV Job Manager and select CSV Export.
-
Click Add (+) to start a new export.
-
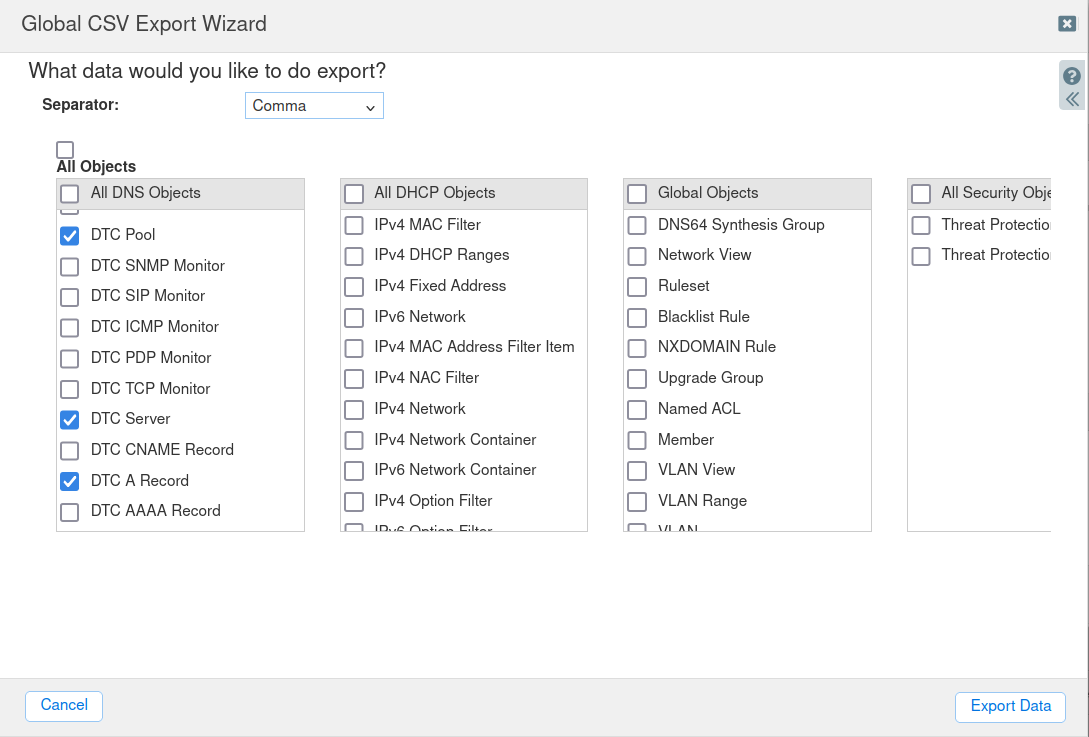
In the Global CSV Export Wizard that opens, unchckeck the default select and select the following objects under All DNS Objects:
-
DTC Pool
-
DTC Server
-
DTC A Record
-
DTC LBDN
-
-
Click Export Data.
-
A confirmation message will appear; click Yes to initiate the export.
-
The CSV Global Export window will display the export progress.
-
Once the export is complete, a prompt will appear in your browser to choose a download location and filename for the exported file.
-
Save the file, open it, and examine its contents to verify that the DTC data has been exported correctly.
Task 5 Solution: Import DTC Objects from CSV
To import the DTC data from a CSV file:
-
Navigate to Data Management → DNS.
-
From the toolbar, click CSV Job Manager and select CSV Import.
-
Click Add (+) to start a new import.
-
In Step 1 of the CSV Import Wizard, ensure the radio button is set to Add and click Next.
-
In Step 2, click Choose to browse for the file.
-
Select the
DTC-data.csvfile located on the Desktop for import. -
Choose the option Skip to the next row and continue.
-
Click Next to proceed.
-
In Step 3, leave the settings unchanged and click Import to begin the process.
-
At the Start CSV Import window, click Yes to proceed.
-
Allow the import to complete. Once finished, navigate to Data Management → DNS → Traffic Control to review the newly added objects.
Task 6 Solution: Configure Reporting Alerts for DTC Monitoring
To configure a custom alert for DNS Traffic Control (DTC) Availability:
-
Navigate to Reporting → Reports.
-
In the search box, type DNS Traffic Control to view DTC-specific reports.
-
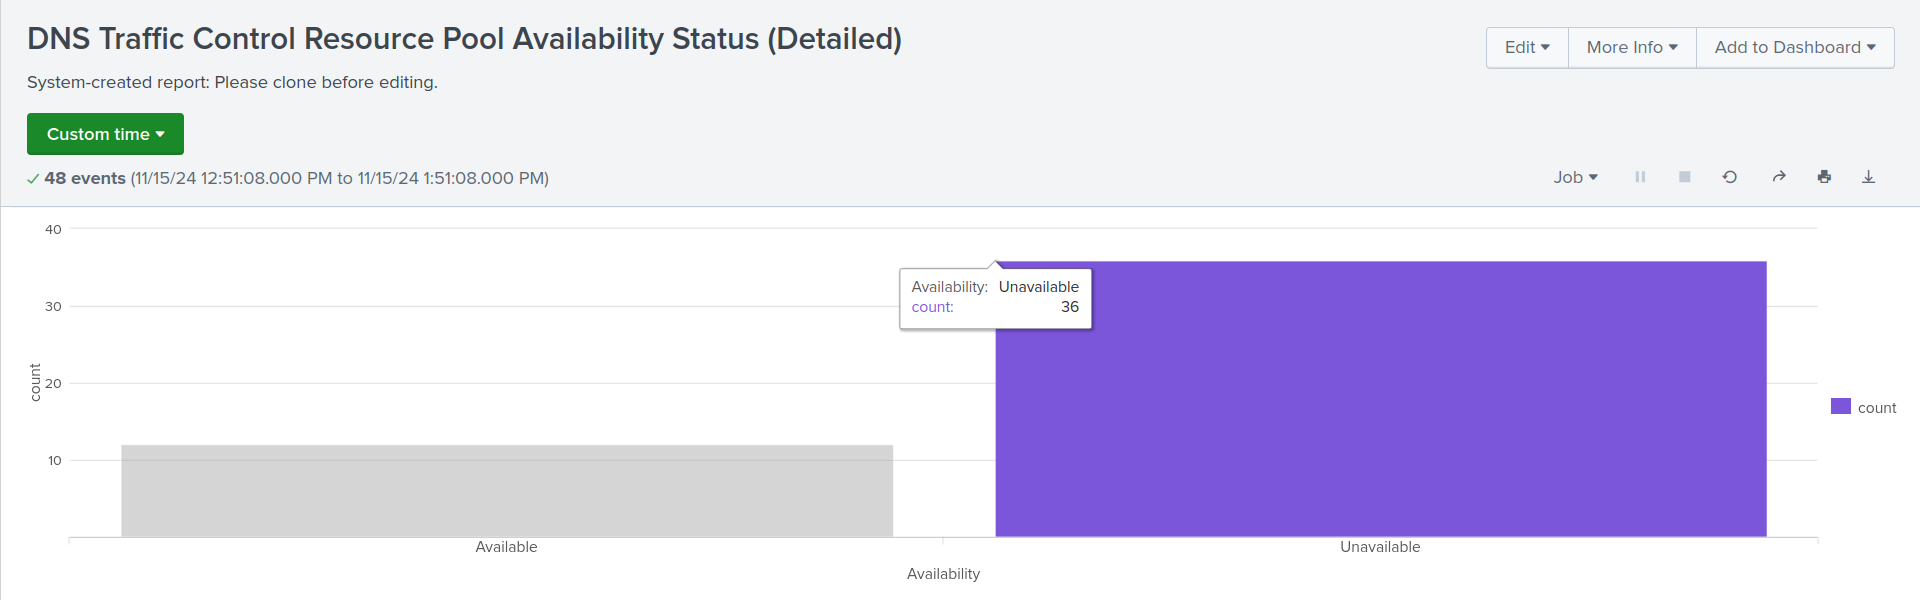
Locate and click on DNS Traffic Control Resource Pool Availability Status (Detailed) report.
.png?cb=61e6f881f150f00f9cc83d4838ba3650)
-
In the report, click on the Unavailable bar in the chart to focus on partially unavailable pools.
-
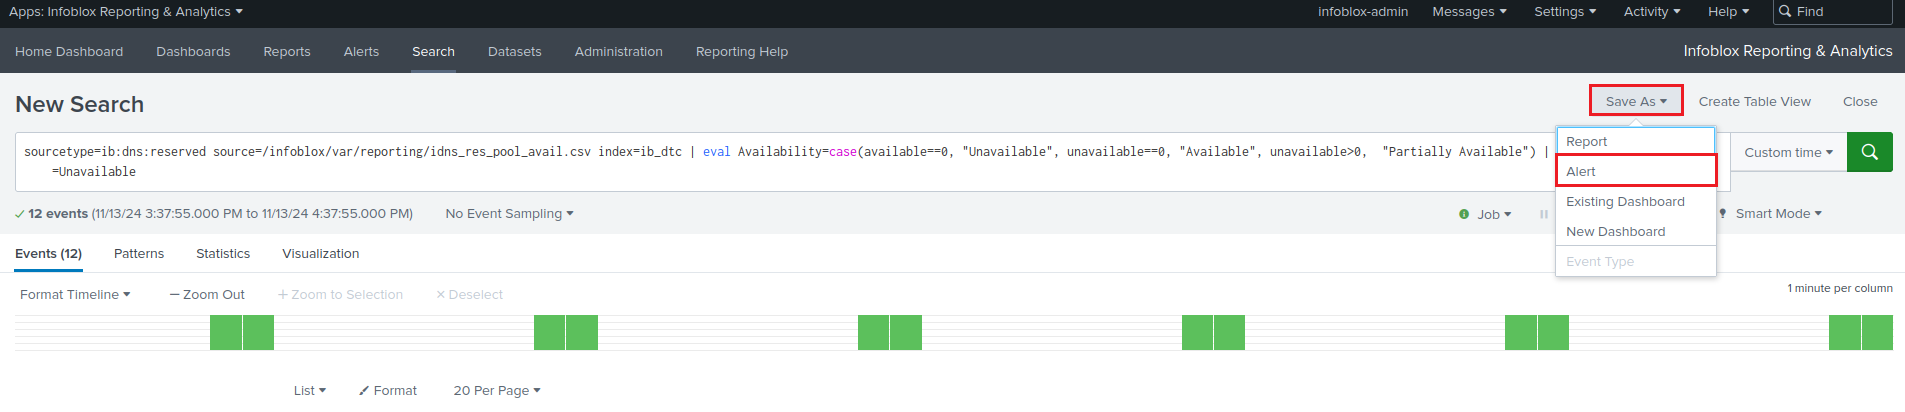
This action will open a New Search Window displaying data for unavailable pools.
-
From the Save As dropdown menu, select Alert to begin creating a custom alert for pool availability.
-
In the alert configuration window, do the following:
-
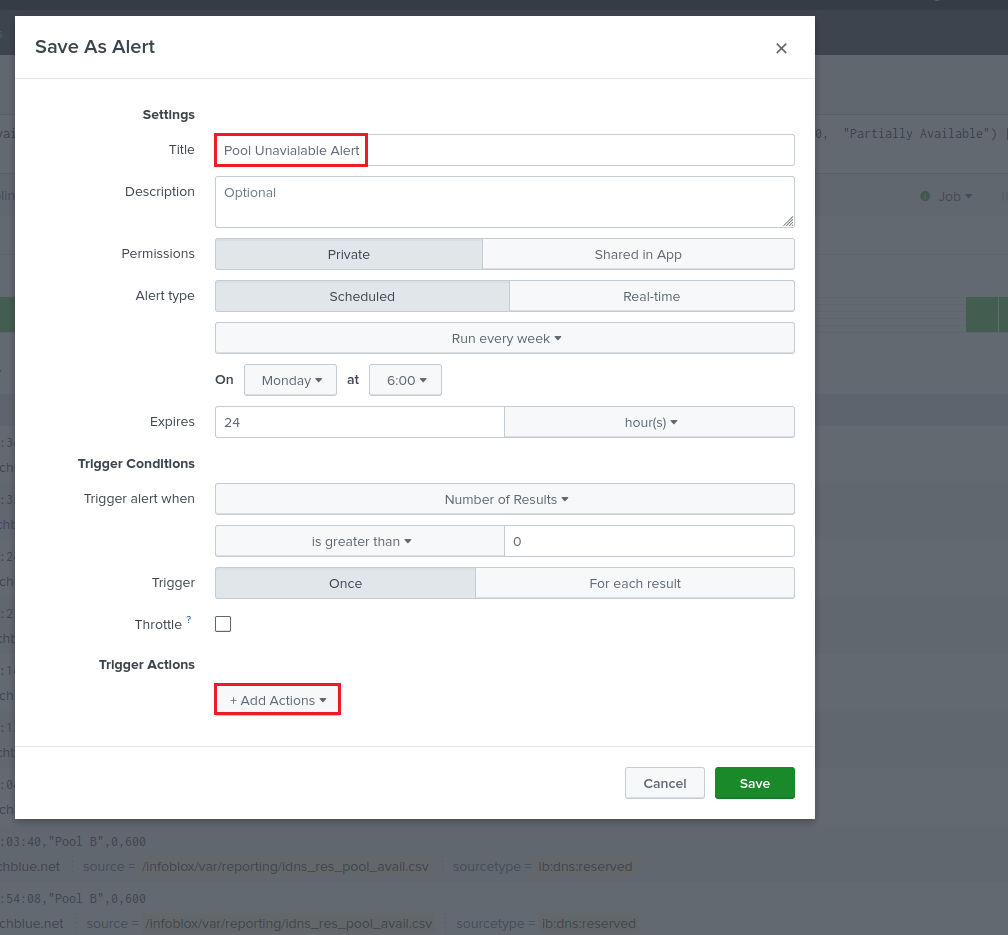
Set the Title to
Pool Unavailable Alert. -
Under Trigger Actions, click +Add Actions and select Send Email as the alert action.
-
In the Alert settings:
-
Set the To field to
admin@techblue.net. -
Set the Priority to High.
-
-
Do not edit the Subject field, as it will automatically include the alert’s name (represented by
$name$). -
Select Attach CSV to include relevant data in the alert email.
-
-
Once all settings are configured, click Save.
Note: Email alerting is not functional in the lab environment. This exercise demonstrates the process of creating a custom alert but will not trigger actual alerts.