In NIOS version 9.0.8, Advanced DNS Protection (ADP)/Threat Protection was rebranded to DNS Infrastructure Protection (DNS-IP). Depending on your NIOS version, the feature may be displayed differently in the user interface.
Scenario
You are tasked with enabling, testing, and tuning Advanced DNS Protection (ADP) on your organization’s Grid. In this lab, you will begin by preparing the environment for ADP, using extibns.techblue.net to simulate a Grid Member that provides public DNS service. This requires reconfiguring the member to have a separate management interface, a typical setup for a public-facing DNS server.
Once the environment is set up, you will apply for the ADP license and perform the initial configuration, including creating an initial ruleset and profiles. You will then start the ADP service in monitor mode for the public-facing authoritative DNS member. This is a common practice when deploying ADP, to stay in monitor-only mode for a period of time.
Next, you will establish a DNS usage baseline and perform some basic tuning.
After tuning ADP, you encounter a scenario involving IP address 203.0.113.254, belonging to an important customer with a legal requirement for uninterrupted service. You first create a custom rule to allow all traffic from this IP without blocking or rate limiting. Later, after noticing unusually high traffic from the same IP address, you adjust the configuration to reduce its query rate to 100 QPS before rate limiting applies. Finally, when the security team identifies the IP address as compromised and actively attacking the organization, you implement a custom denylist rule to block all traffic from it immediately.
Learning Content
Estimate Completion Time
-
2.5 to 3 Hours
Credentials
|
Description |
Username |
Password |
URL or IP |
|---|---|---|---|
|
Grid Manager UI |
admin |
infoblox |
|
|
NIOS-4 VM |
admin |
infoblox |
|
|
Support-Server |
training |
infoblox |
|
Requirements
-
Administrative access to the Grid
-
Usage of the NIOS Lab Environment (with Advanced DNS Protection) Lab environment
Lab Initiation
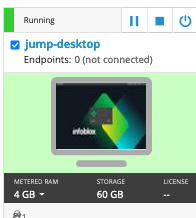
Access jump-desktop
Once the lab is deployed, you can access the virtual machines required to complete this lab activity. To initiate the lab, click on the jump-desktop tile and login to the Linux UI:
Username: training
Password: infoblox
Initiate lab
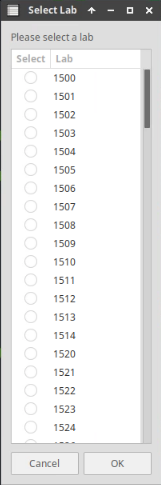
To initiate the lab, double-click the Launch Lab icon on the Desktop.

Choose the lab number from the list and click OK.
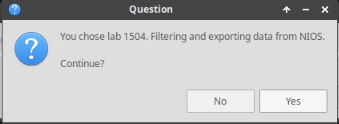
After clicking OK, you will see a pop-up message with a brief description of the lab task. If the description looks correct, click Yes to continue lab initiation.
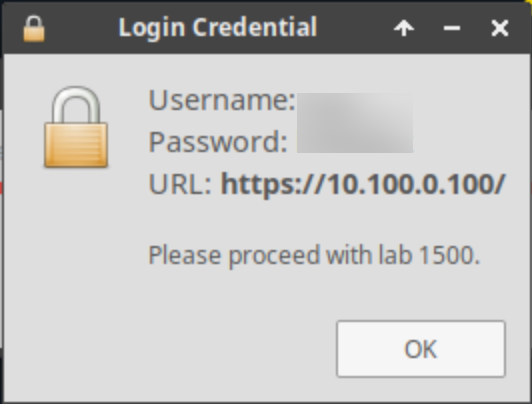
Lab initiation will take a couple of minutes to finish.
Once complete, you will see another pop-up message with the login credentials and the URL for the Grid Manager’s User Interface. Note that the credentials may differ from those from prior labs.
Tasks
-
Set up a new management interface for Grid Member extibns.techblue.net
-
Change LAN1 interface setting for Grid Member extibns.techblue.net
-
Verify extibns.techblue.net successfully joined the Grid after the restart
-
Configure extibns.techblue.net Reporting Settings
-
Set up the Reporting Server
-
Import the DNS-techblue.io.csv file and verify DNS services are running on extibns.techblue.net
-
Load ADP License Files to the Grid
-
Upload an Initial Ruleset
-
Configure Rule Update and Ruleset Download Policies
-
Configure and Enable the Threat Protection (ADP) Service
-
Start the Threat Protection Service
-
Create a Threat Protection Profile
-
Assign Profile to Grid Member
-
Identify Outliers
-
Establish a Baseline
-
Create a Profile for Tuned Rulesets
-
Manage Rule-Enabled/Disabled Categories
-
Tune Default Rules in the External - Tuned Profile
-
Test the new Configuration
-
Create a Custom Allowlist (Whitelist) Rule
-
Create a Custom Rate Limiting Rule
-
Create a Custom Denylist (Blacklist) Rule
-
Merge Rulesets
-
Modify the External - Tuned profile to use the new ruleset
-
Verify Threat Protection events in Syslog
-
Analyze the Grid Status and Health using Security Dashboard Widgets
-
Investigate the available Reporting Server Dashboards for Threat Protection (ADP)
-
Configure SNMP traps
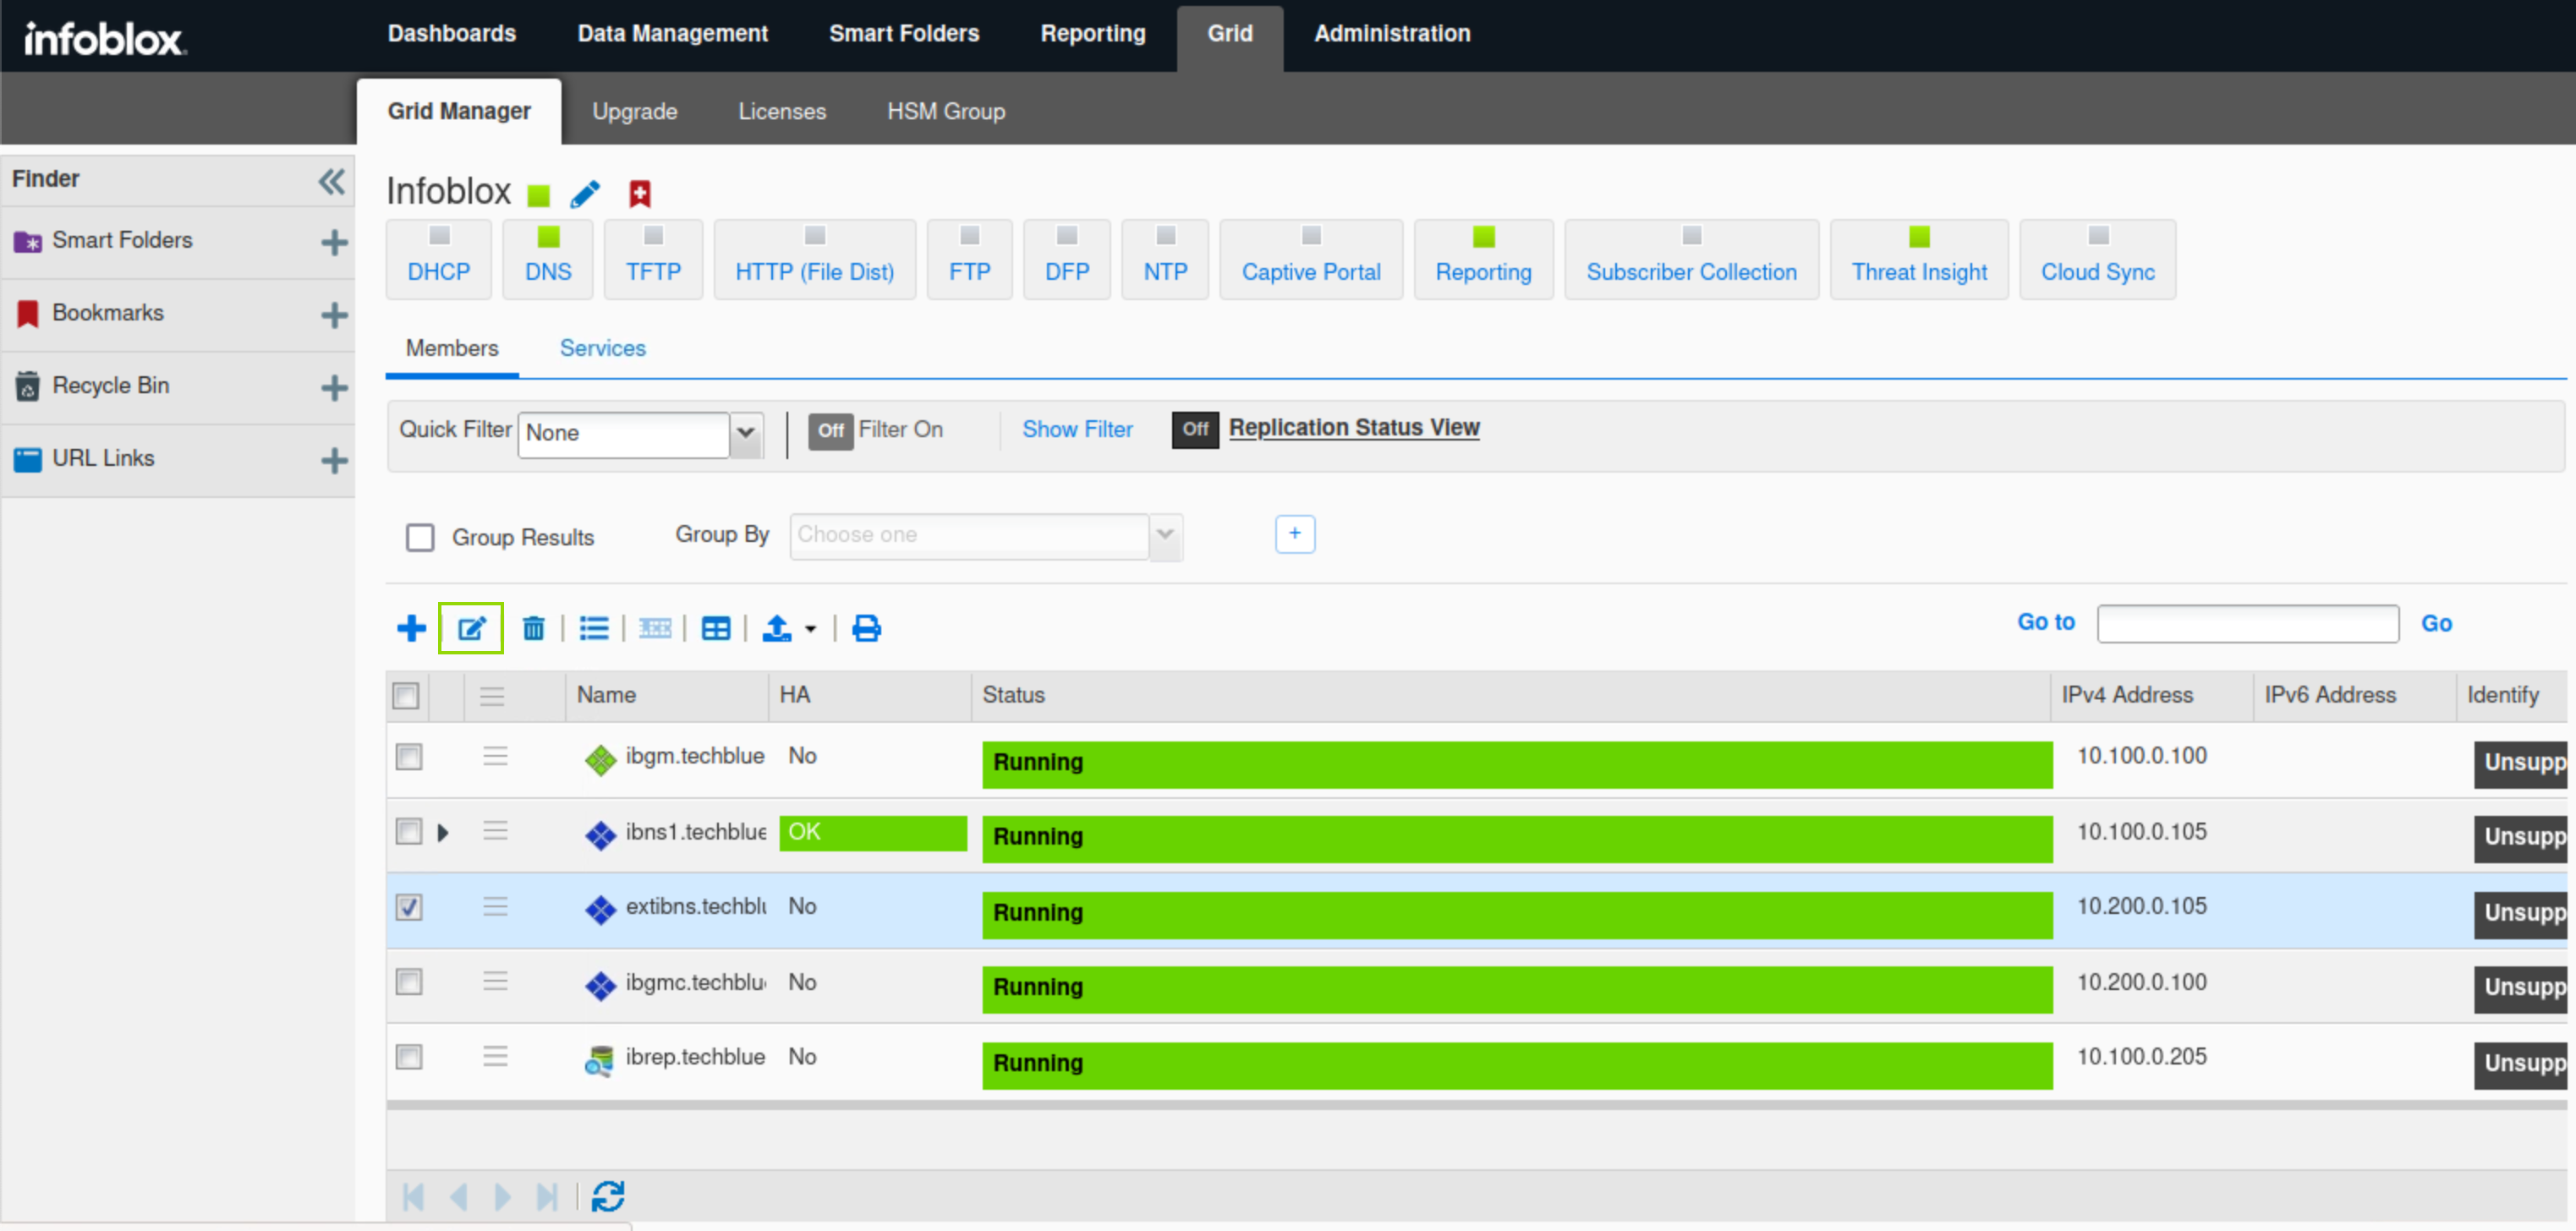
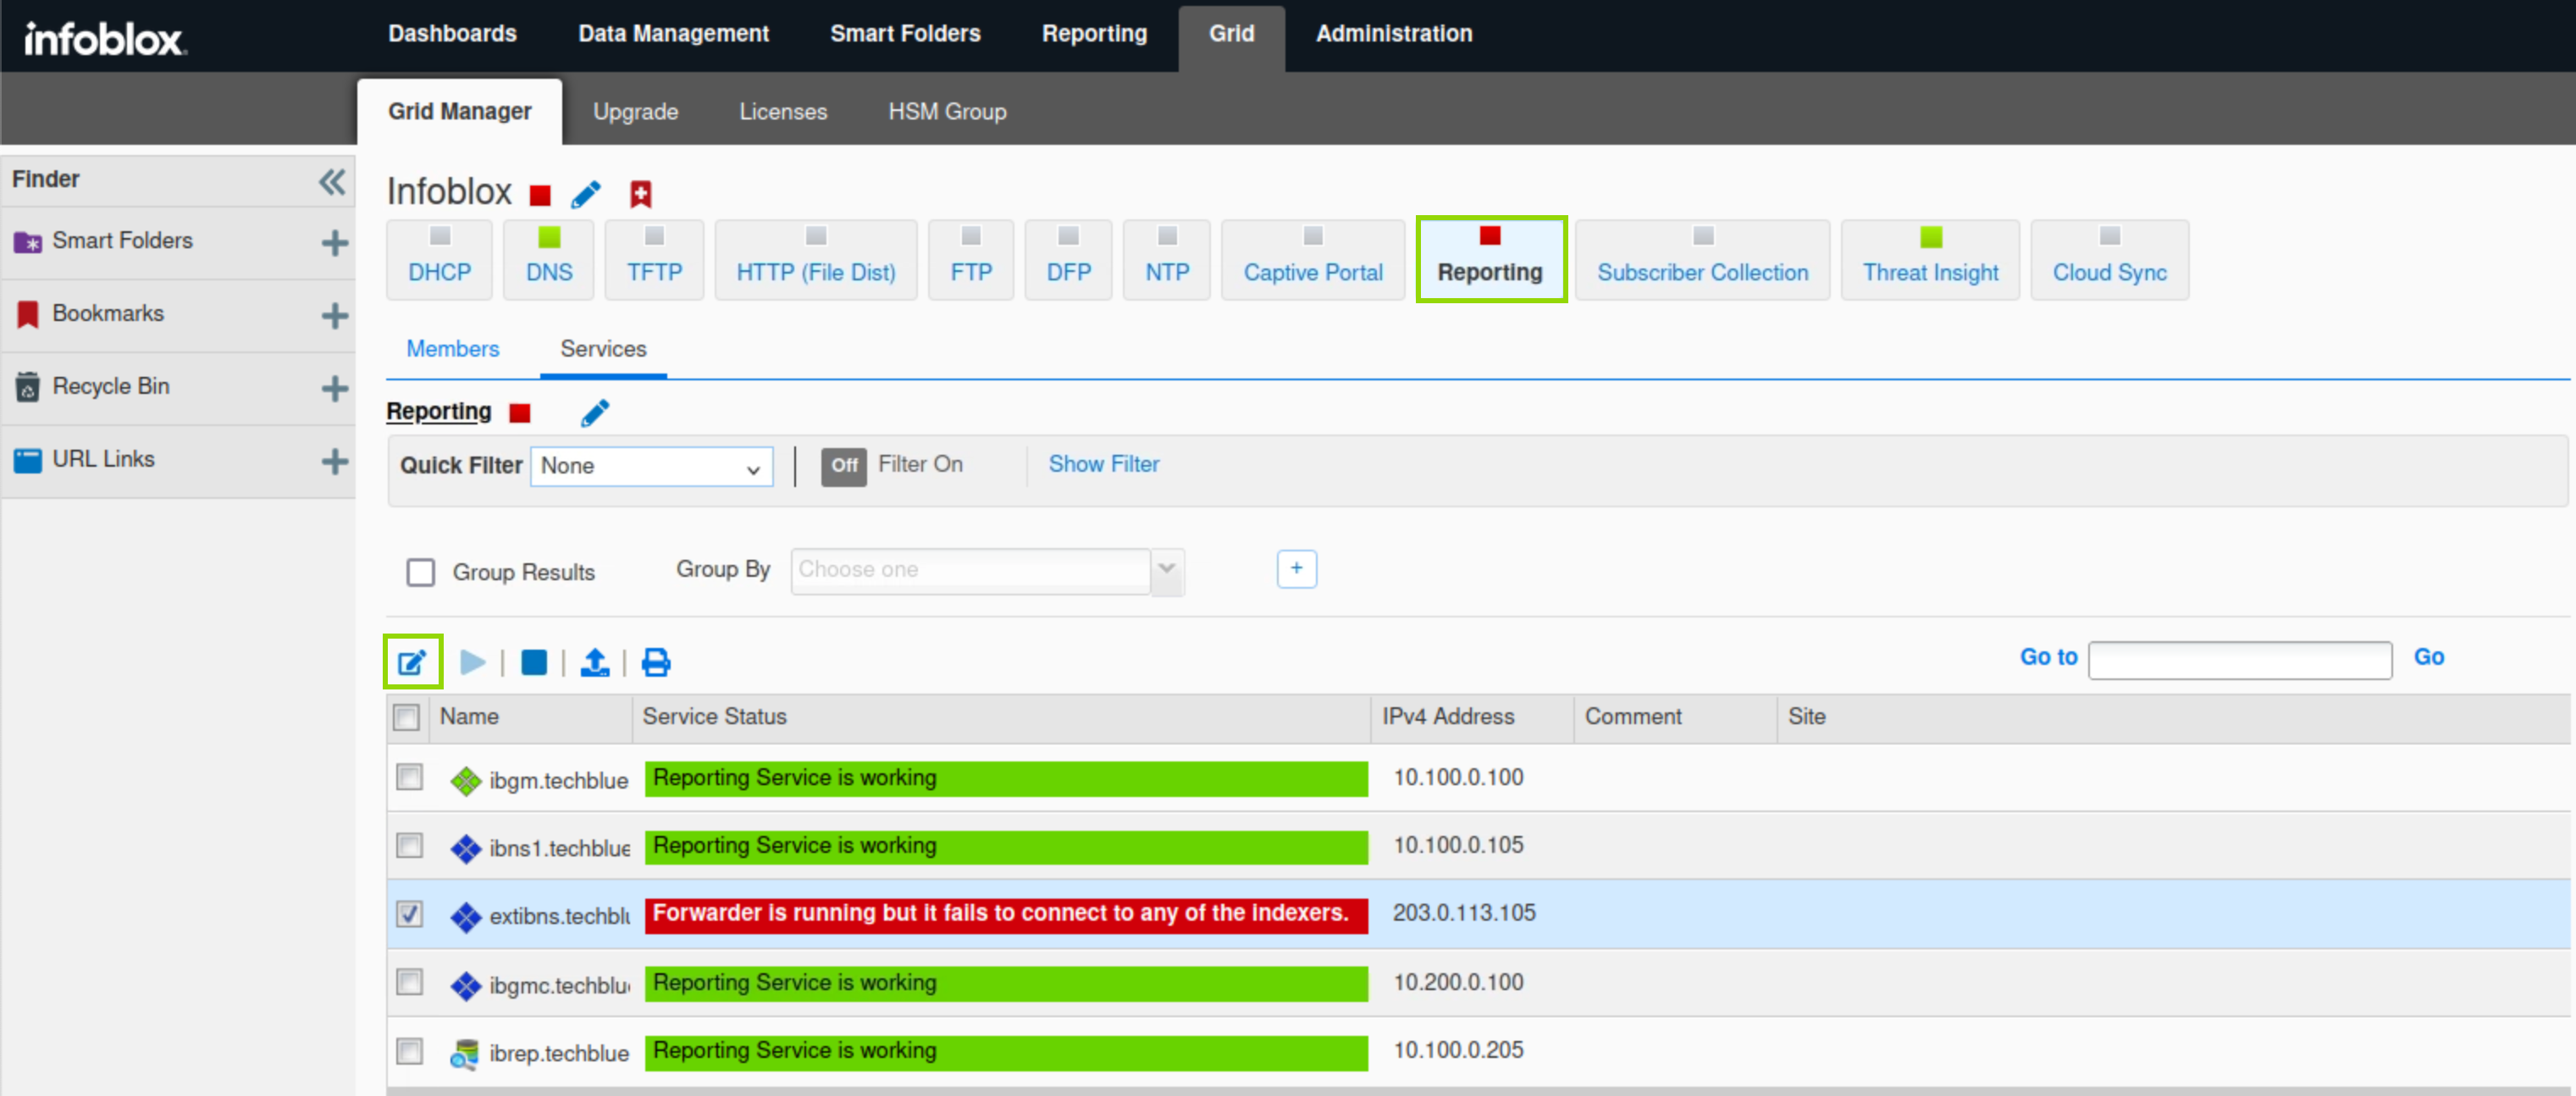
Task 1: Set up a new management interface for Grid Member extibns.techblue.net
-
A new IPv4 management port is added under the “Additional Ports and Addresses” section.
-
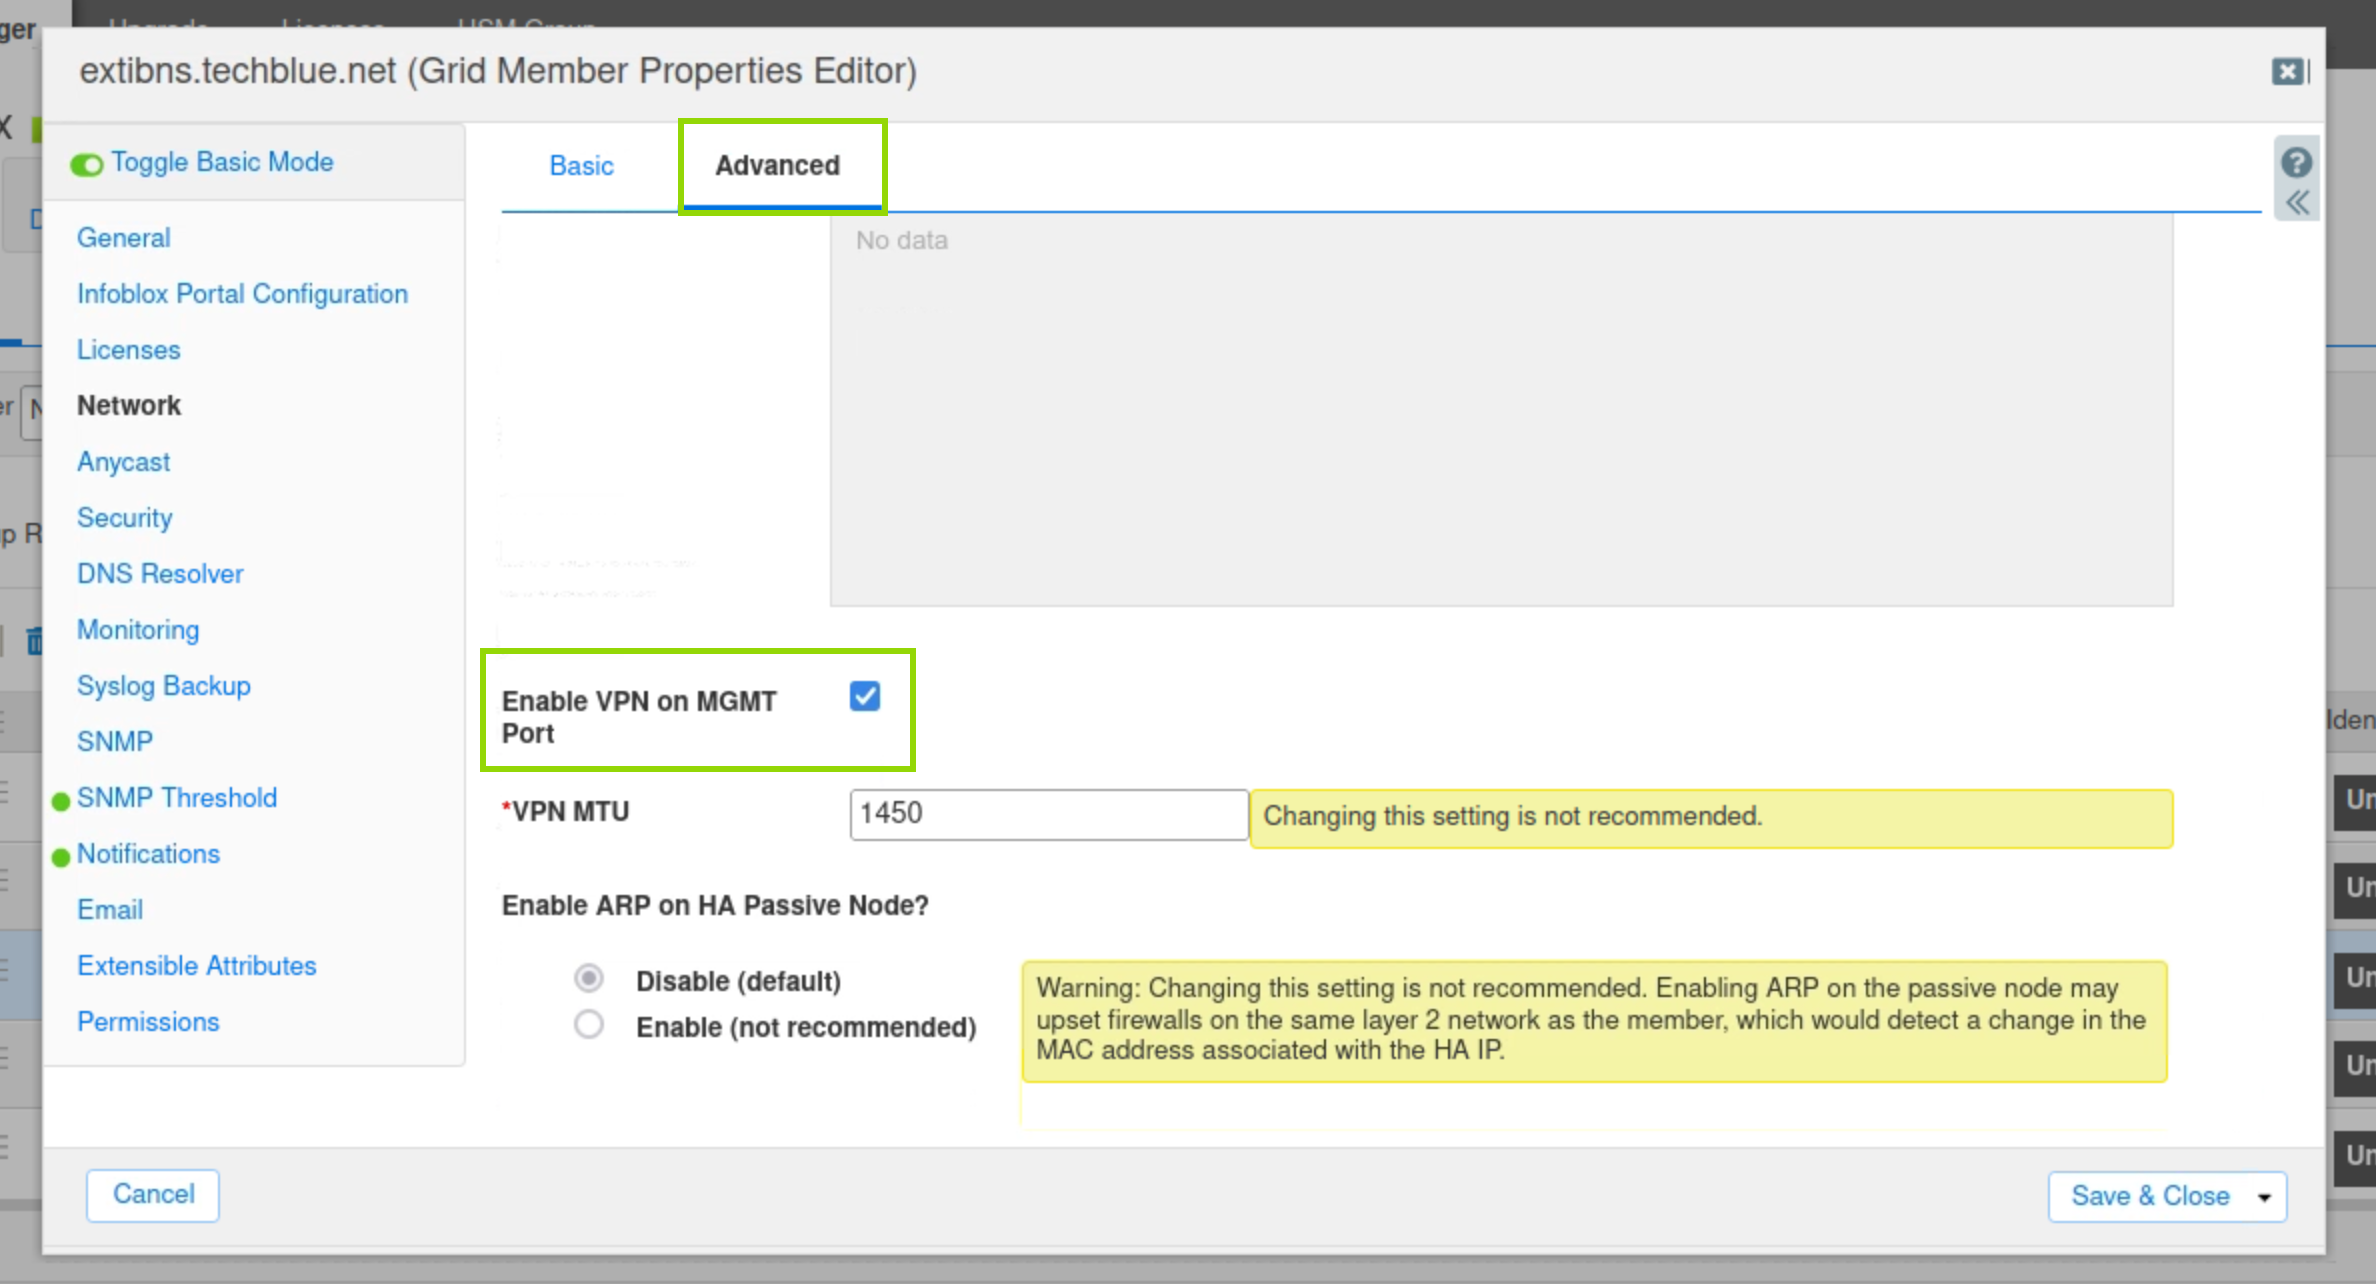
Enable VPN on MGMT Port setting for extibns.techblue.net.
-
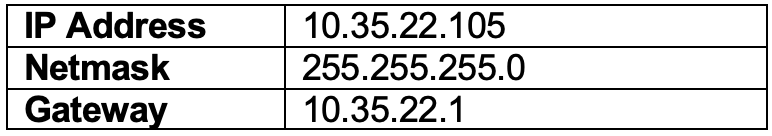
Use these settings for the new port:
|
IP Address |
10.35.22.105 |
|
Netmask |
255.255.255.0 |
|
Gateway |
10.35.22.1 |
Task 2: Change LAN1 interface setting for Grid Member extibns.techblue.net
-
Edit the IPv4 settings for the LAN1 interface on extibns.techblue.net.
-
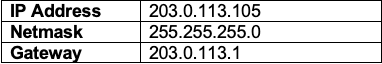
Use these Settings:
|
IP Address |
203.0.113.105 |
|
Netmask |
255.255.255.0 |
|
Gateway |
203.0.113.1 |
Task 3: Verify extibns.techblue.net successfully joined the Grid after the restart
Validate that extibns.techblue.net has successfully joined the Grid and is running
Task 4: Configure extibns.techblue.net Reporting Settings
Update the reporting configuration to utilize the management interface for sending data to the reporting server.
Task 5: Set up the Reporting Server
-
Set up the reporting server with the following information:
|
Configuration |
Value |
|
Username |
training |
|
Password |
infoblox |
|
Protocol |
SCP |
|
Host/ IP Address |
10.100.0.205 |
|
Port |
22 |
|
Path |
/home/training/Documents/ReportingData |
Task 6: Import the DNS-techblue.io.csv file and verify DNS services are running on extibns.techblue.net
-
Import a CSV file to populate the Grid with external data required for ADP to function in this lab environment, which will be used in subsequent ADP labs. The import will do the following:
-
Create a DNS View called External
-
Create a Name Server Group called External NSG, and assign extibns.techblue.net to the group
-
Create and populate the techblue.io zone and assign it to extibns.techblue.net
-
-
Verify DNS services are running on extibns.techblue.net.
Task 7: Load ADP License Files to the Grid
Add the ADP license by navigating to Shared Drive/Licenses/9.0. Select the ADP.lic file
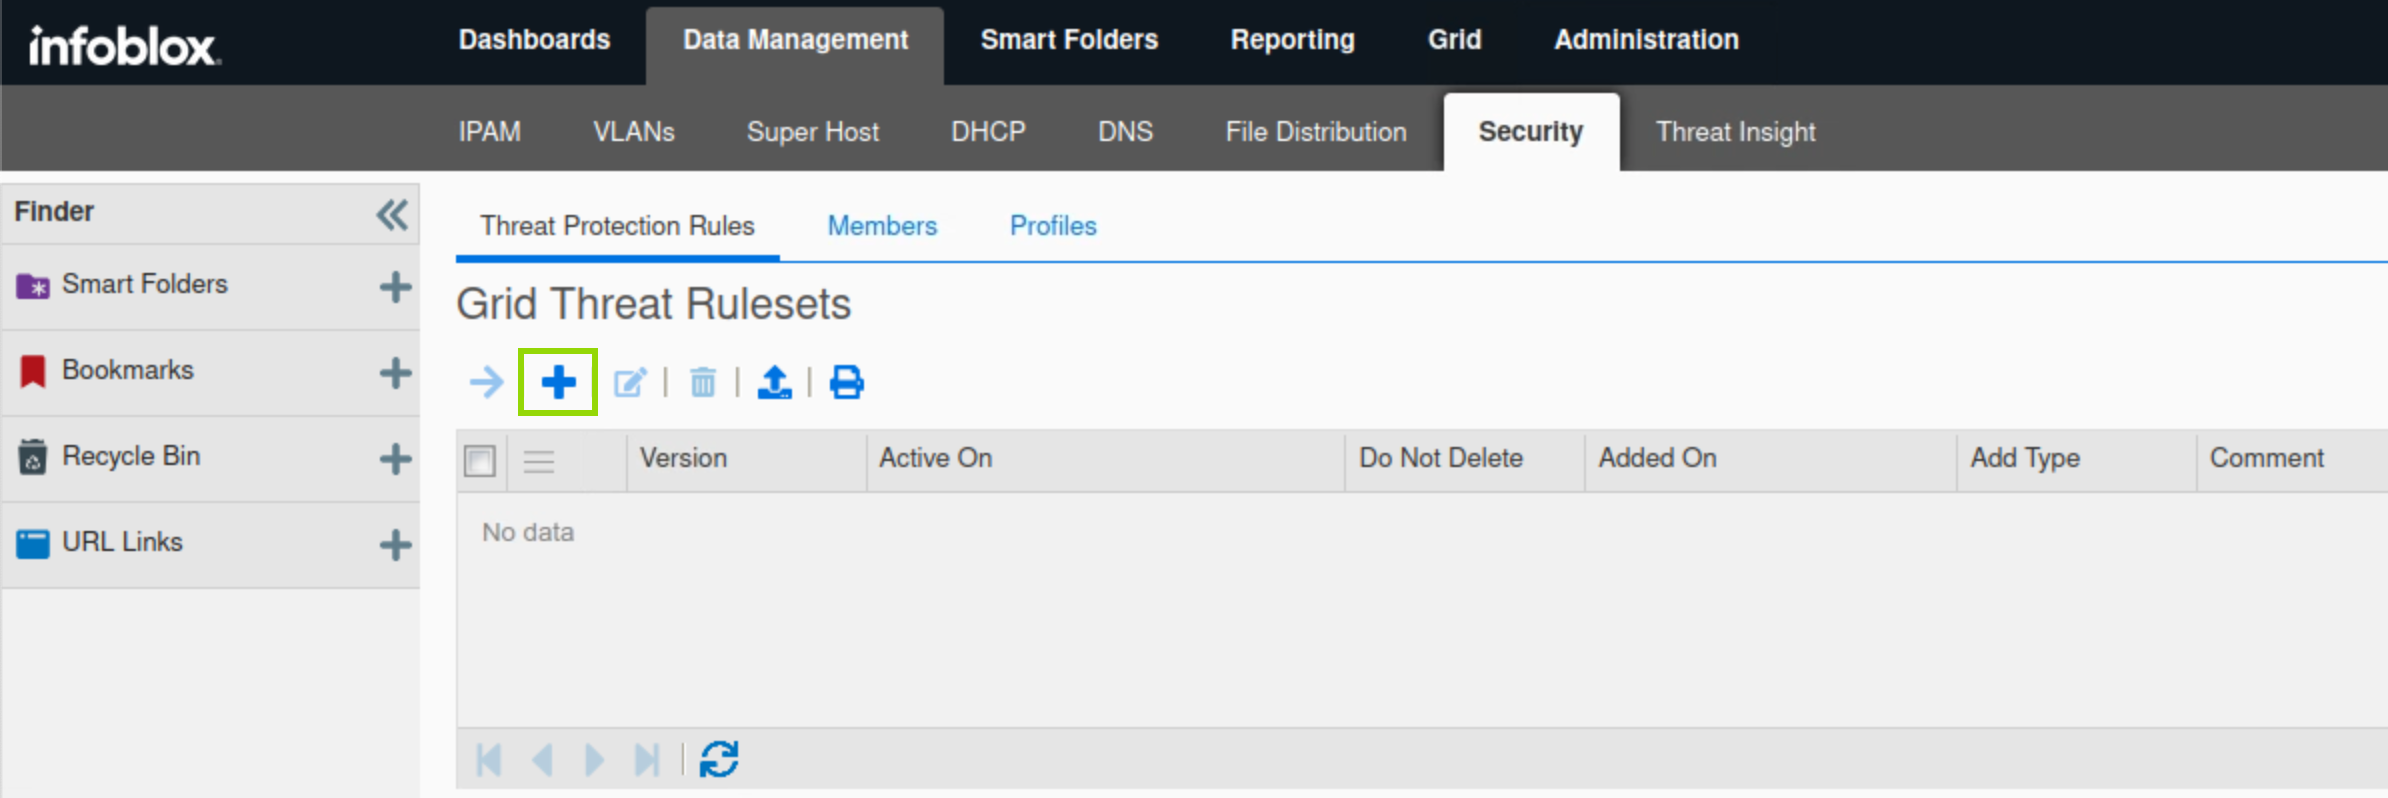
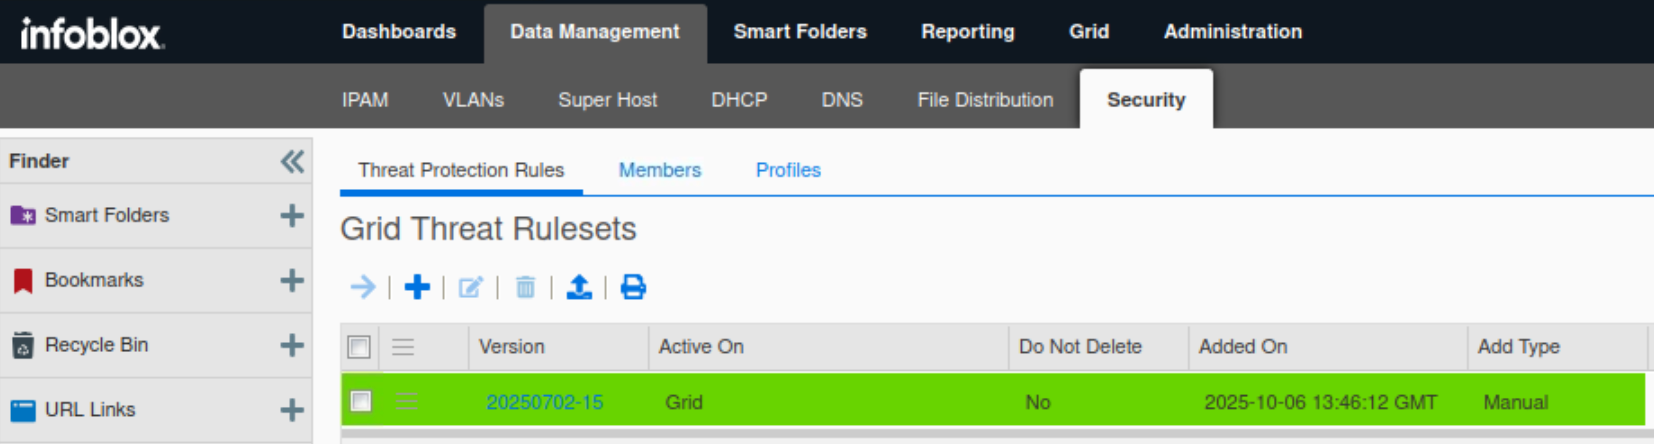
Task 8: Upload an Initial Ruleset
-
The Threat Protection Service (ADP) requires a ruleset to start. In this task, you upload a ruleset. Initially, an older ruleset is uploaded, allowing you to update to the latest ruleset later.
-
Use the rule set ruleset-20250702.bin2 from the Shared Drive file from the Shared Drive/NIOS-Imports folder.
Task 9: Configure Rule Update and Ruleset Download Policies
Set the Rule Update Policy to Manual, Enable Automatic Ruleset Downloads, and test the connection to ensure it works.
Task 10: Configure and Enable the Threat Protection (ADP) Service
The best practice is to always run ADP in monitor mode for at least a week to establish traffic patterns.
Configure the Threat Protection service to use monitor mode. This enables you to check that the service is configured correctly and that there are no unintended effects on the network traffic.
Task 11: Start the Threat Protection Service
Start the ADP service on the extibns.techblue.net member, and restart the service if required.
Task 12: Create a Threat Protection Profile
Create an ADP Profile, the profile is called External - Initial Configuration. The profile is created with default settings.
Task 13: Assign Profile to Grid Member
Assign the created profile to extibns.techblue.net.
Task 14: Identify Outliers
The Grid will require 30 to 35 minutes to fully load and be ready for tuning.
The ADP server hasn’t been running for long enough, so dashboards such as DNS Daily Peak Hour Query Rate by Member might not be accurate or useful in this instance. However, this is an important dashboard to check in a production system where ADP has been running for several days or weeks.
Use the Reporting Server dashboards to identify clients that are generating excessive data.
Task 15: Establishing a Baseline
The information you want to gather here is usually found under Hourly Grid-wide QPS, DNS Query Rate by Member, or Daily Peak Hour Query Rate by Member.
You need to establish the normal rate of DNS queries per second to tune ADP accordingly. Use the Reporting Server dashboards to do so.
Task 16: Create a Profile for Tuned Rulesets
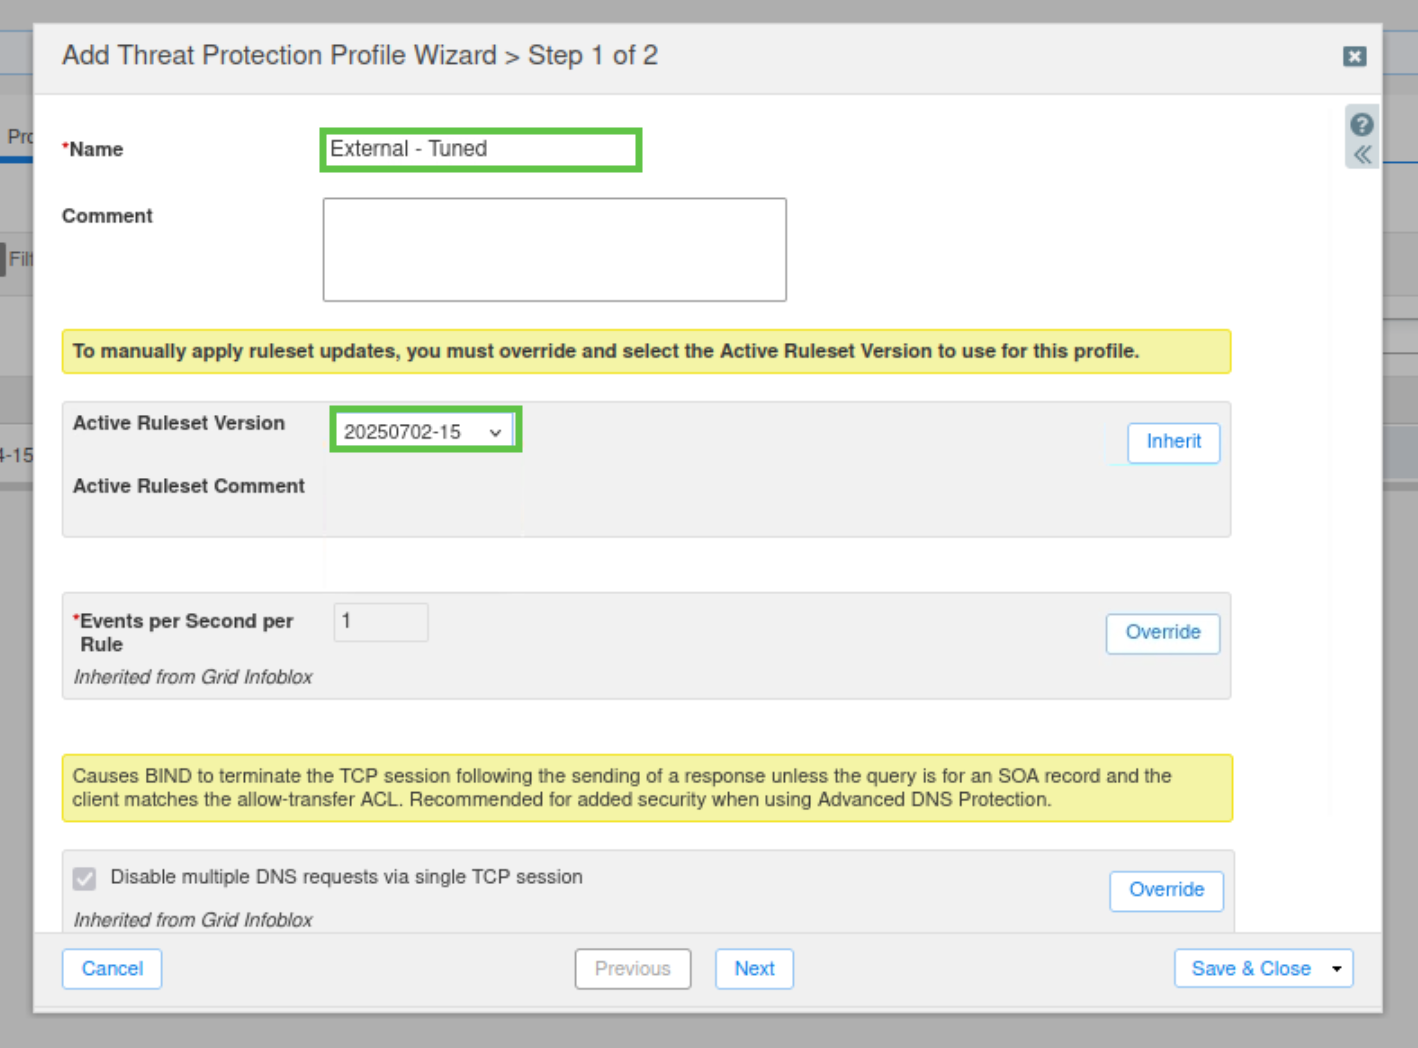
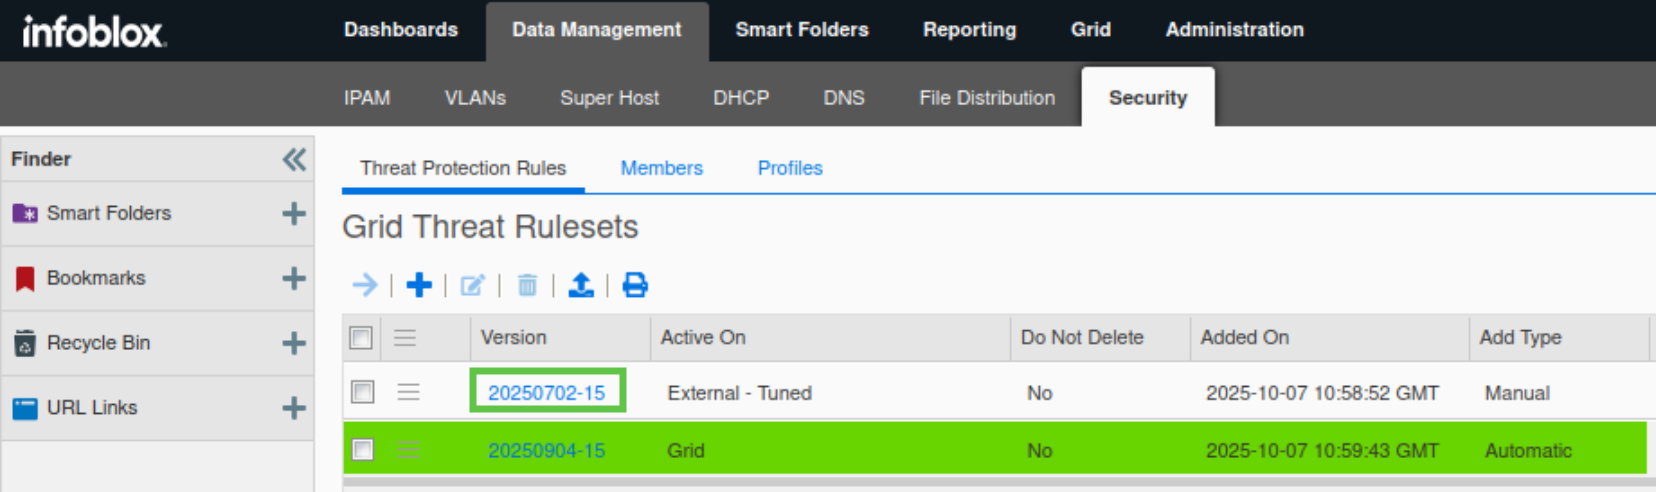
Create a new ADP profile named External - Tuned. Override the Active Ruleset and select the old 20250702-15 ruleset for the new profile we are creating. Then assign the profile to extibns.techblue.net.
Task 17: Manage Rule Categories
Since extibns.techblue.net is an authoritative-only DNS server. Certain Rule Categories are not required.
-
Disable the following rule categories:
-
DNS Malware
-
DNS DDoS
-
DNS Tunneling
-
Task 18: Tune Default Rules in the External - Tuned Profile
The values used in this task are specific to the lab and do not reflect the values you should use in a production environment
You will tune three rules to suit your current lab environment; these rules are to protect against TCP and UDP flood attacks.
-
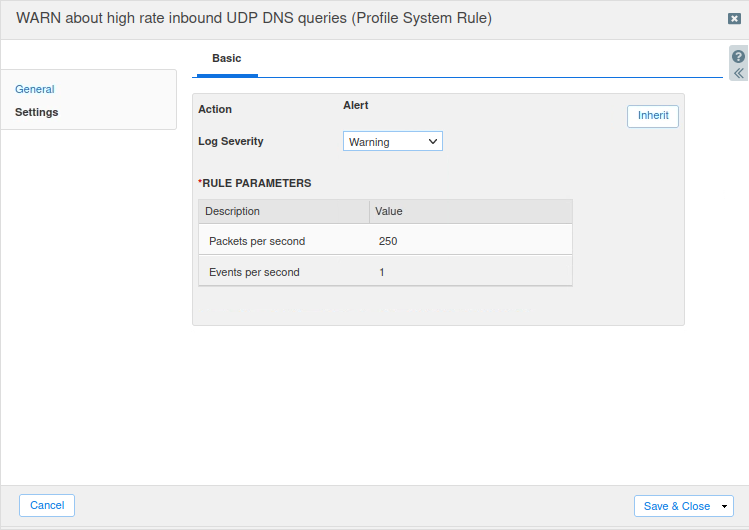
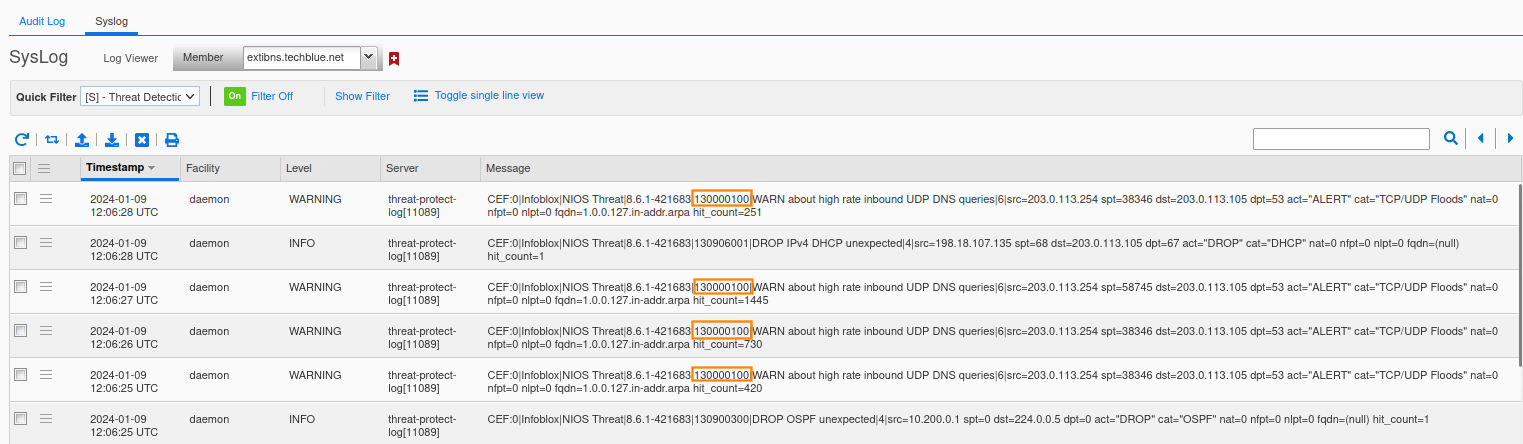
Tune the rule ID 130000100 (WARN about high rate inbound UDP DNS queries) as follows:
-
Log Severity: Warning
-
Packets per second: 250
-
Enable the rule
-
-
Tune the rule ID 130000200 (WARN & BLOCK about high rate inbound UDP DNS queries) as follows:
-
Log Severity: Critical
-
Packets per second: 500
-
Enable the rule
-
-
Tune the rule ID 100000100 (EARLY PASS UDP response traffic) as follows:
-
Log Severity: Critical
-
Packets per second: 15000
-
Task 19: Test the new Configuration
You will test the External Tune Profile, which contains the modified rules.
-
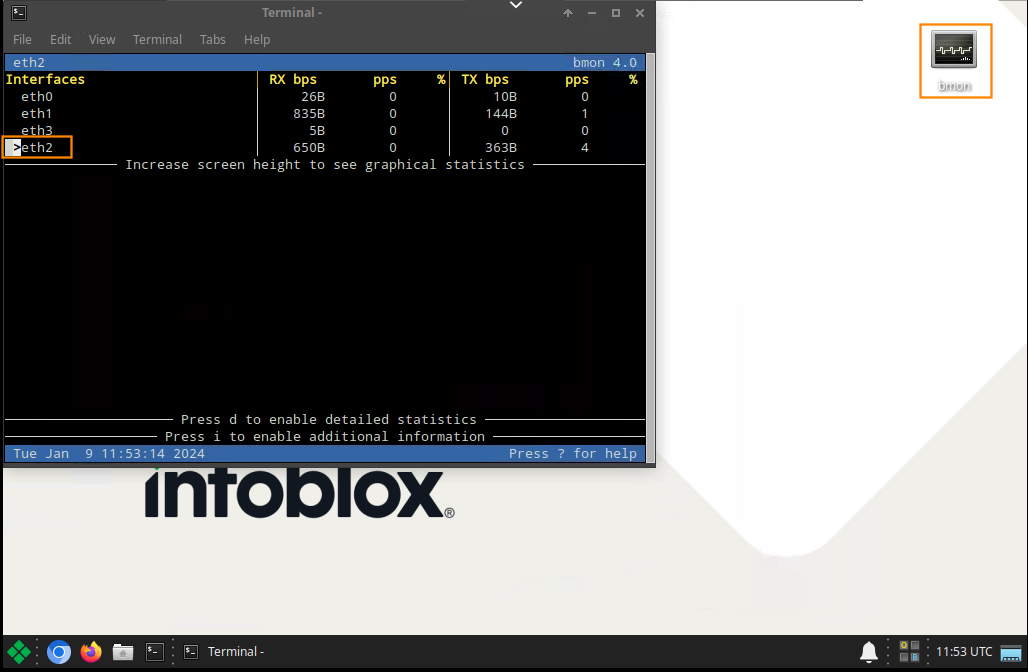
A monitoring tool called bmon is installed on the support-server, Use it to monitor eth2 interface.
-
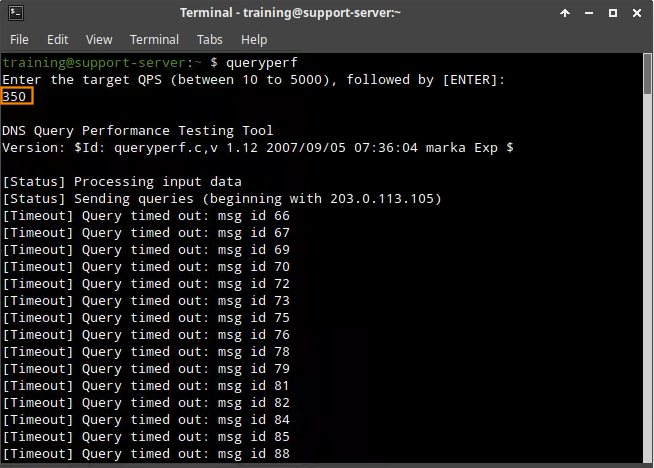
The queryperf tool is used to send DNS queries to the extibns.techblue.net DNS server at the rate you specify.
-
Test both 13000100 and 13000200 by setting the query rate in queryperf to 350 initially, then to 600.
-
Monitor eth2 interface health using bmon.
-
Use NIOS syslogs and Dashboards to verify your observations.
-
-
Disable Monitor Mode on NIOS-4 (extibns.techblue.net).
-
Repeat your tests again with the same query rates, 350 then 600, and observe the difference in the eth2 interface health.
-
Use NIOS syslogs and Dashboards to verify your observations.
-
Task 20: Create a Custom Allowlist (Whitelist) Rule
Once this Task is completed, disable the rule and republish
Create an exception for our critical customer, coming from the IP address 203.0.113.254.
-
203.0.113.254 is the IP Address of an important customer; traffic from this customer cannot be blocked or rate-limited.
-
Use queryperf and bmon on support-server to test your configuration by sending 1000 QPS to extibns.techblue.net.
Task 21: Create a Custom Rate Limiting Rule
Once this Task is completed, disable the rule and republish
After applying the custom allowlist, you noticed the customer’s IP address is sending an abnormal amount of traffic. You decide to implement some rate-limiting for their IP address.
-
Create a custom Rate Limited rule to control traffic from the IP Address 203.0.113.254.
-
In this scenario, 203.0.113.254 is generating a significant amount of traffic, and we want to limit the QPS it can send to 100 before it is rate-limited.
Task 22: Create a Custom Denylist (Blacklist) Rule
The security team has contacted you and informed you that the customer’s network has been compromised, which explains the abnormal amount of traffic originating from their IP address. You decide to block them completely until the security issues resolved.
-
Create a custom Denylist rule to block traffic from the IP Address 203.0.113.254.
-
Use the queryperf on support-server and NIOS syslogs to test your configuration.
Task 23: Merge the current Ruleset with the newly downloaded Ruleset
Merge the current Ruleset 20250702-15 with the new Ruleset 20250904-15. Ensure that you merge the custom rules created for your organization into the new Ruleset.
Task 24: Modify the External - Tuned profile to use the new ruleset
-
Modify the External - Tuned profile to use the newly updated ruleset.
-
Certain Rule Categories are not required because the server only responds to DNS queries. No DNS traffic is recursed/passed through the server. Disabling categories and rules prevents the ADP engine from having to interrogate against rules that aren’t applicable. Check that the following Rule Categories are still disabled:
-
DNS Malware
-
DNS DDoS
-
DNS Tunneling
-
Confirm that the previously created Custom Rules are present.
-
Task 25: Verify Threat Protection events in Syslog
View Syslog records generated on the extibns.techblue.net member to verify that Threat Protection rules are being triggered.
Task 26: Analyze the Grid Status and Health using Security Dashboard Widgets
-
Use the Security Dashboard to investigate the status of the Grid name servers, ibns1.techblue.net and extibns.techblue.net
-
Use the Security Dashboard to investigate the recent spike in DNS traffic.
Task 27: Investigate the available Reporting Server Dashboards for Threat Protection (ADP)
Use the Reporting Server to provide information about recent DNS spikes and what Threat Protection rules were triggered.
Task 28: Configure SNMP Traps
Configure SNMP Traps for the Grid to be triggered when DNS traffic exceeds a preset threshold. This will enable us to respond more quickly to DDoS or any future triggering attacks. The traps will be sent to the SNMP receiver 10.100.0.10.
Solutions
Task 1 Solution: Set up a new management interface for Grid Member extibns.techblue.net
In this task, we configure a new management interface which will be used for the Grid Master to connect and manage extibns.techblue.net.
-
On the jump-desktop machine, open a browser window and surf https://10.100.0.100.
-
Navigate to Grid → Grid Manager → Members.
-
Select extibns.techblue.net and click the Edit button.
-
Click Toggle Advanced Mode.
-
Select the Network tab.
-
Scroll down the page to Additional Ports and Addresses.
-
Click the plus (+) symbol, and add an MGMT(IPv4) port.
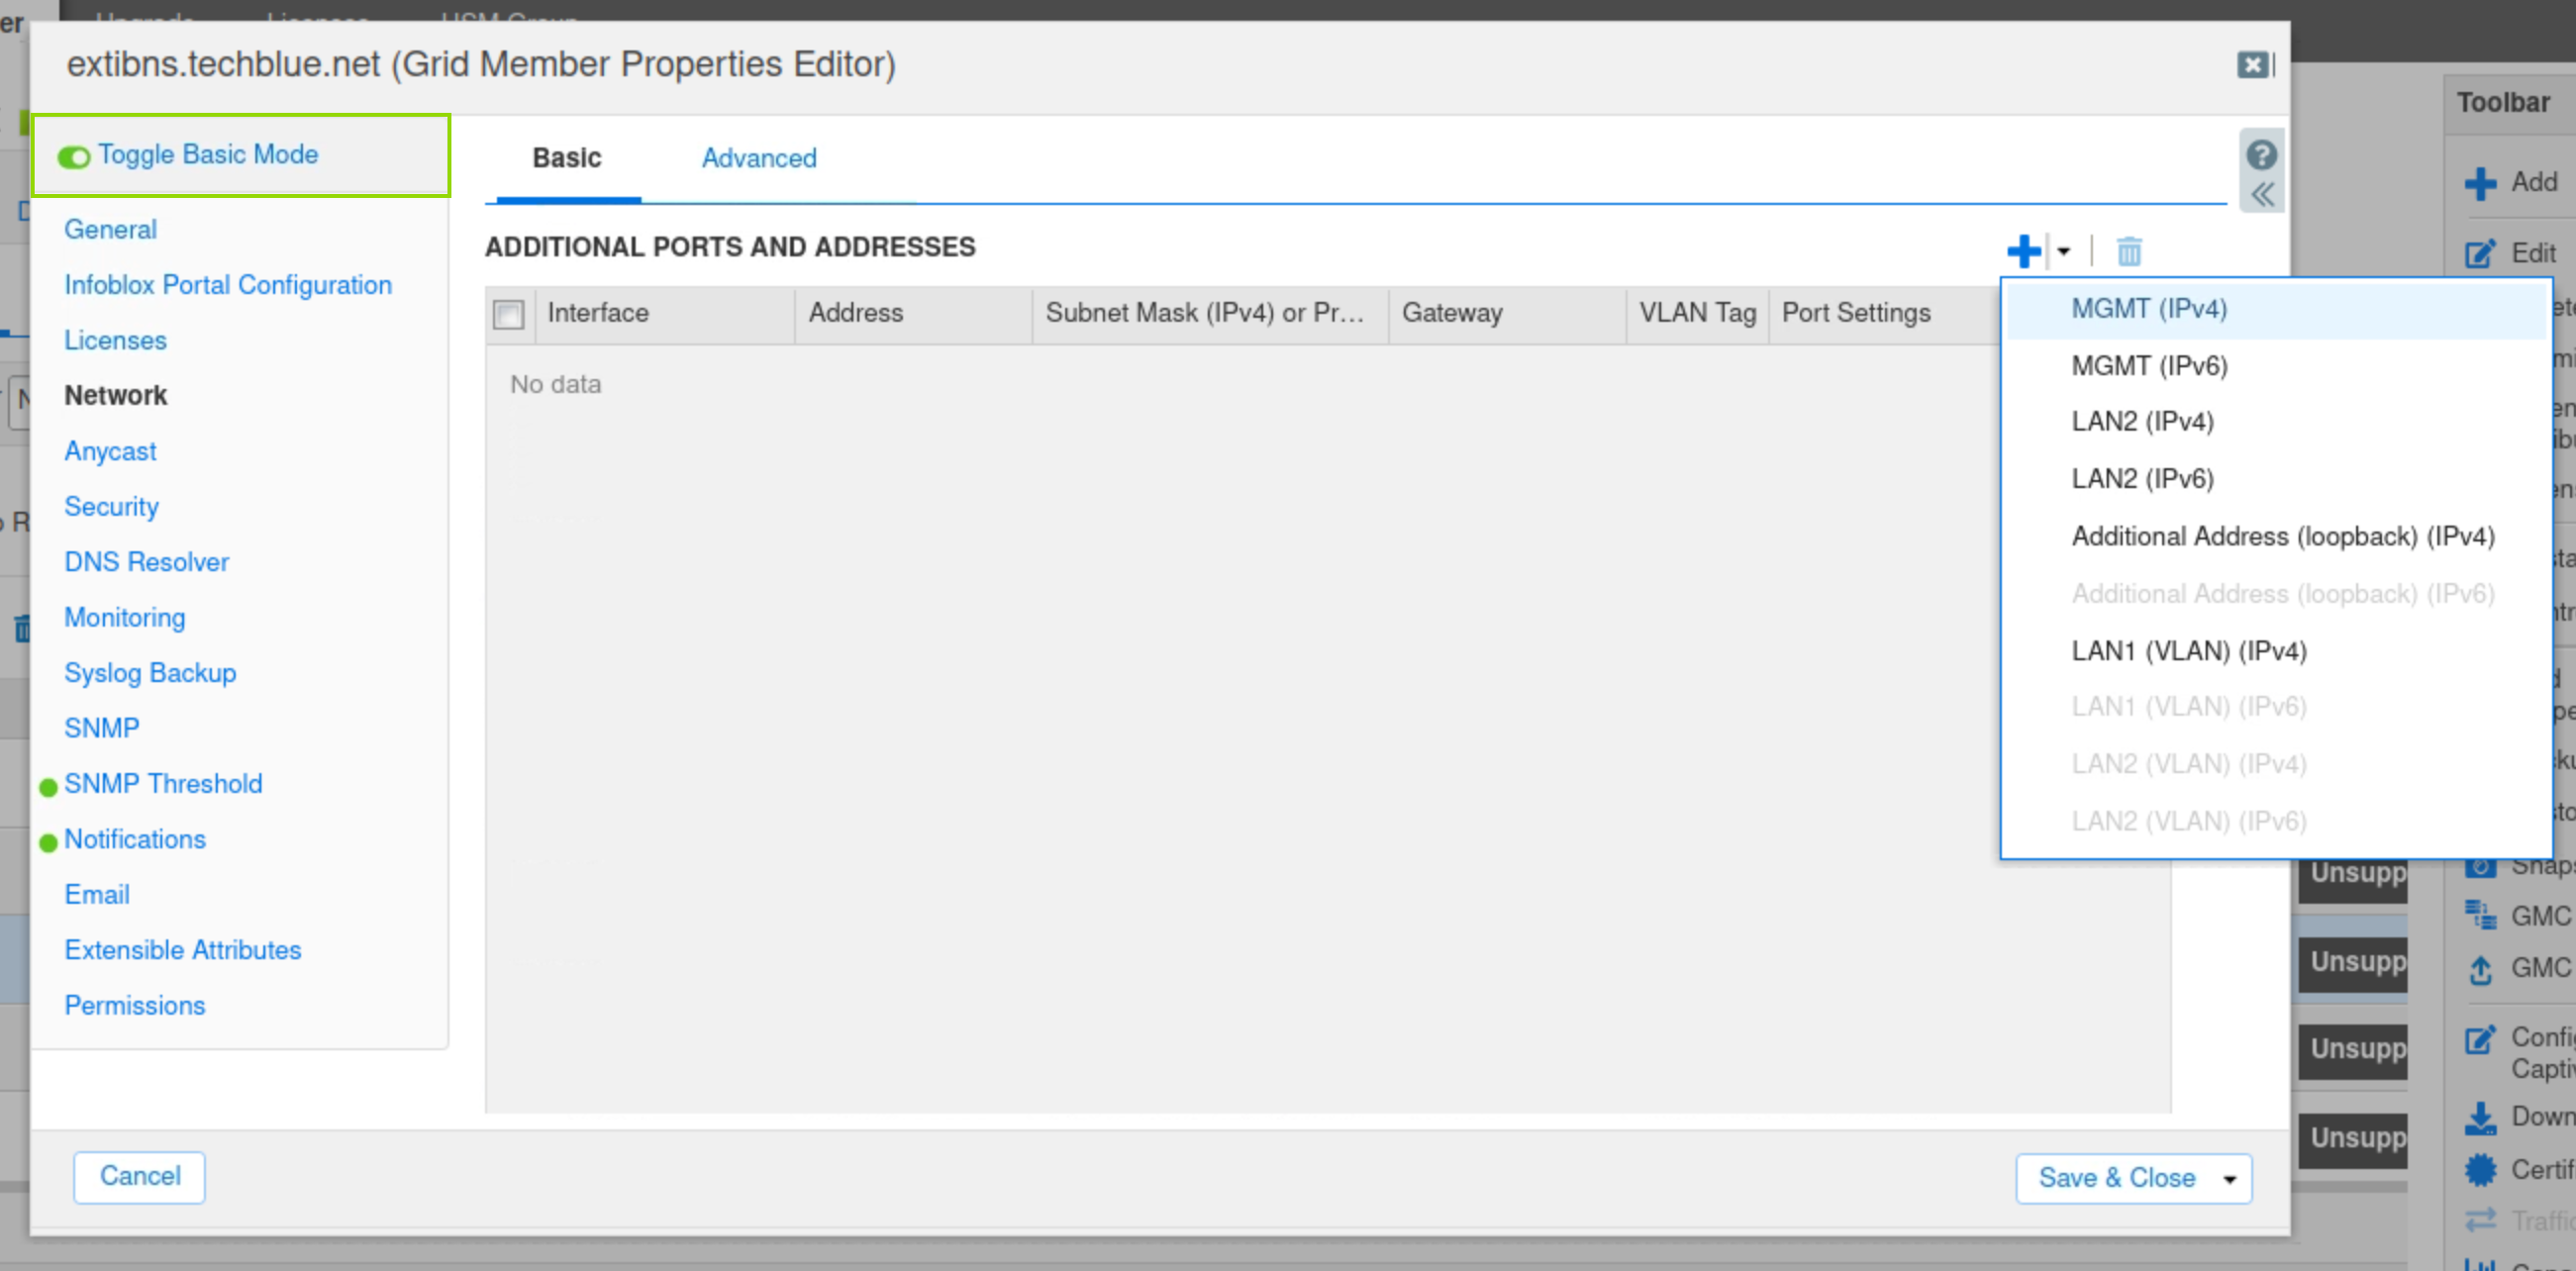
-
Use these settings for the new port:
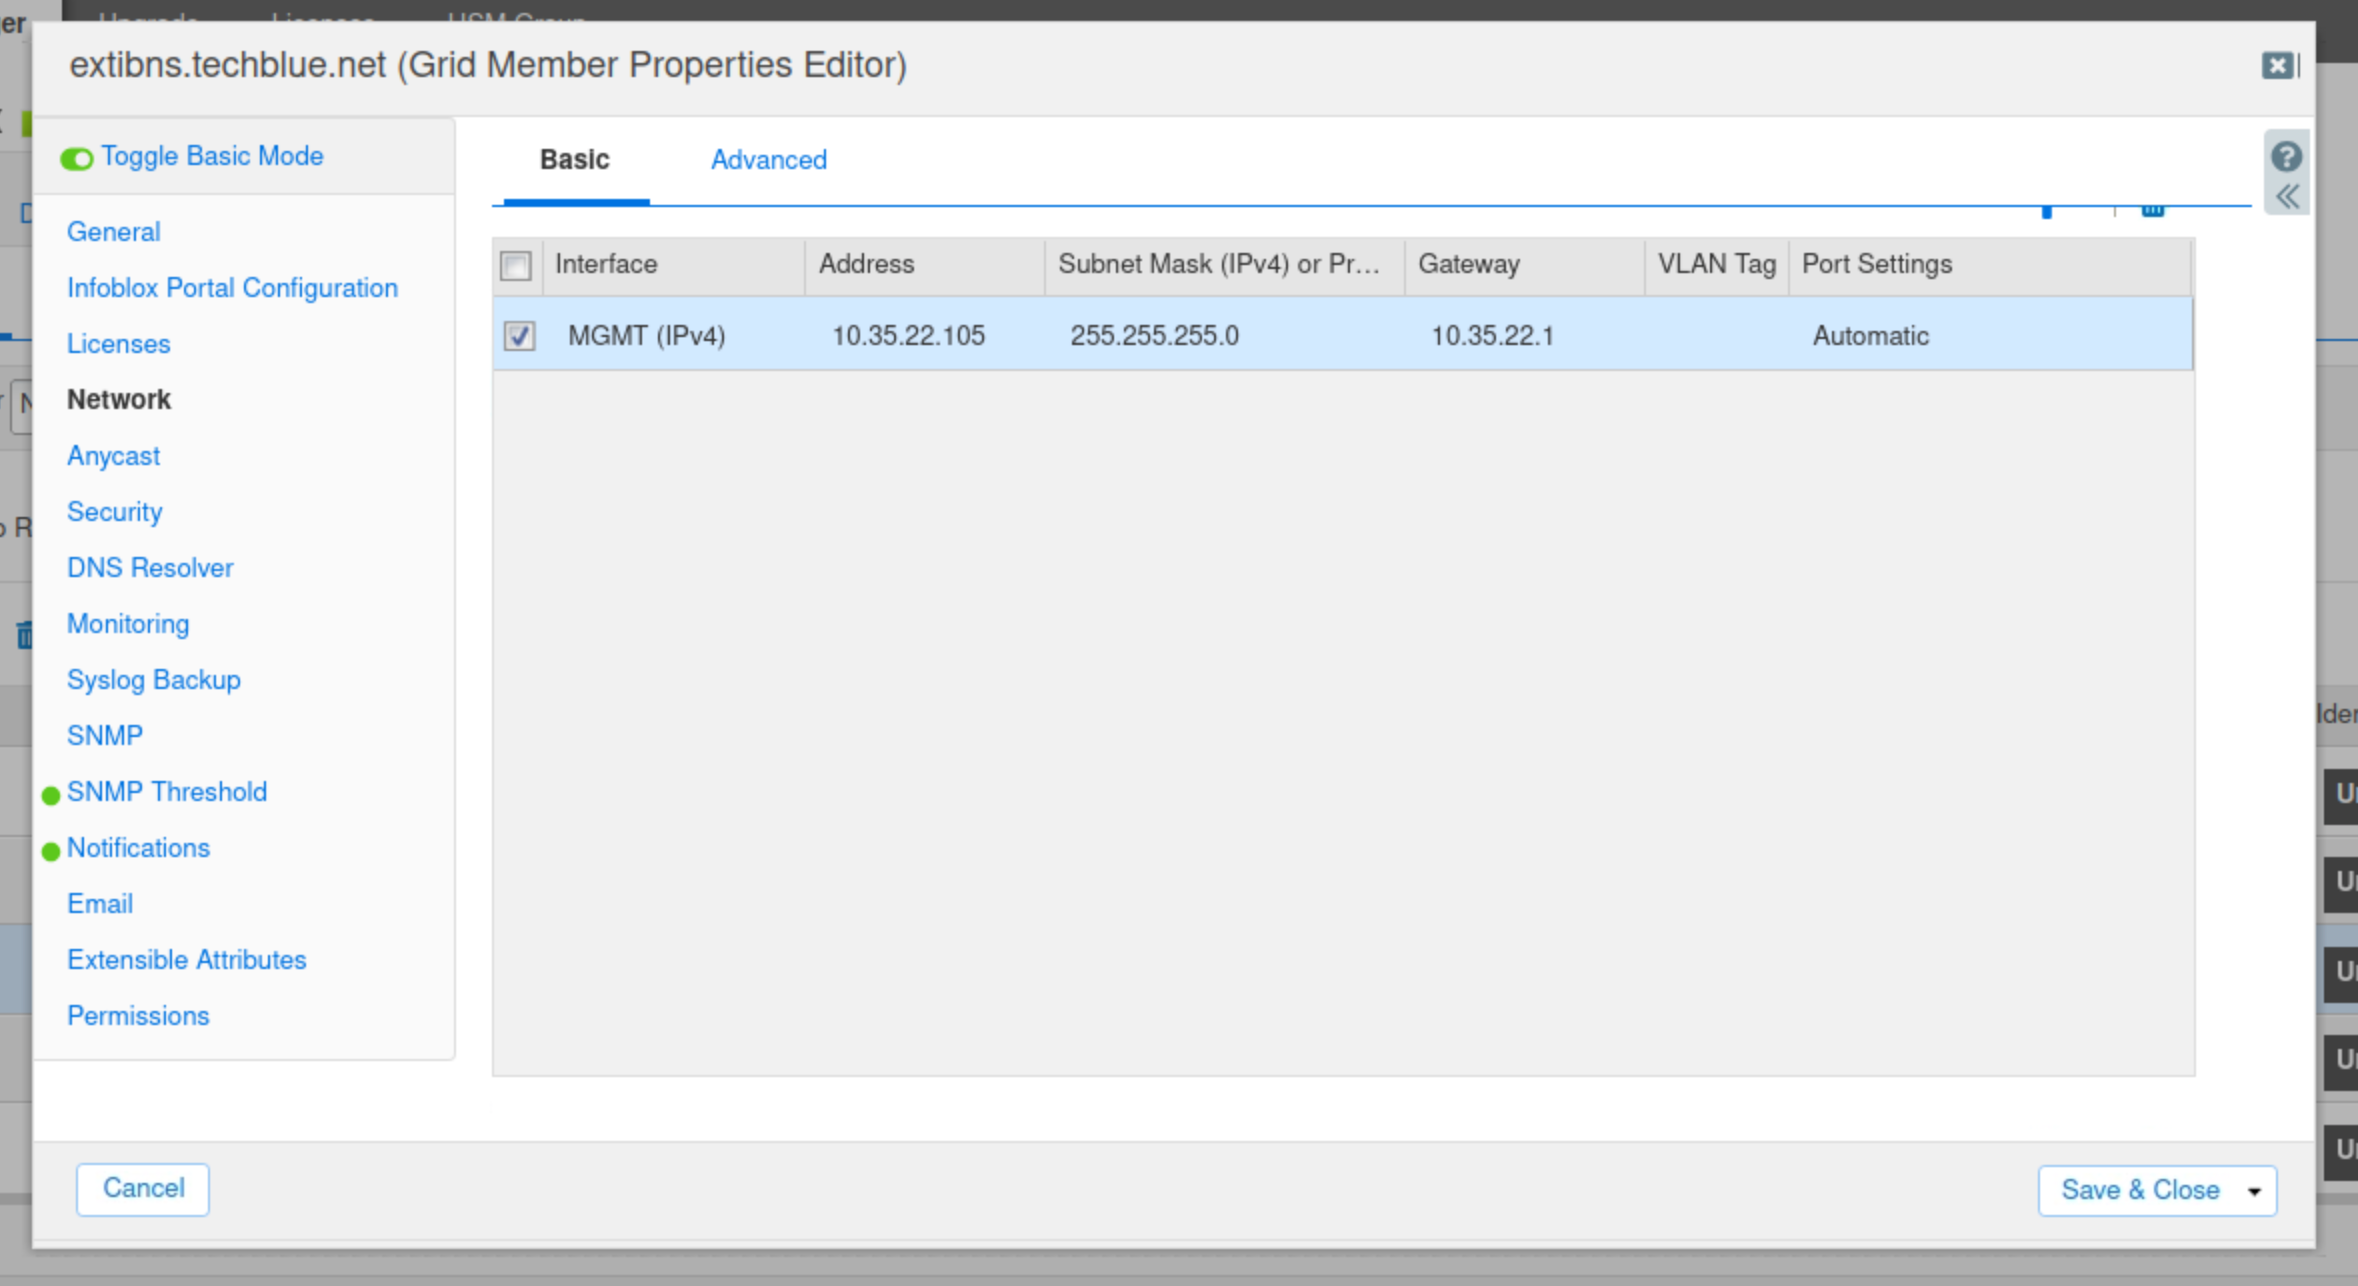
-
Select the Advanced tab at the top of the screen.
-
Scroll down and check Enable VPN on the MGMT port.
-
Click Save & Close to save the configuration settings.
Task 2 Solution: Change LAN1 interface setting for Grid Member extibns.techblue.net
In this task, we modify the configuration of the LAN1 interface on extibns.techblue.net, which is the interface connecting it to the internet.
-
Select extibns.techblue.net and click the Edit button.
-
Select the Network tab
-
Under the “Ports and Addresses” section, edit the LAN1 interface’s settings using the information in the table below.
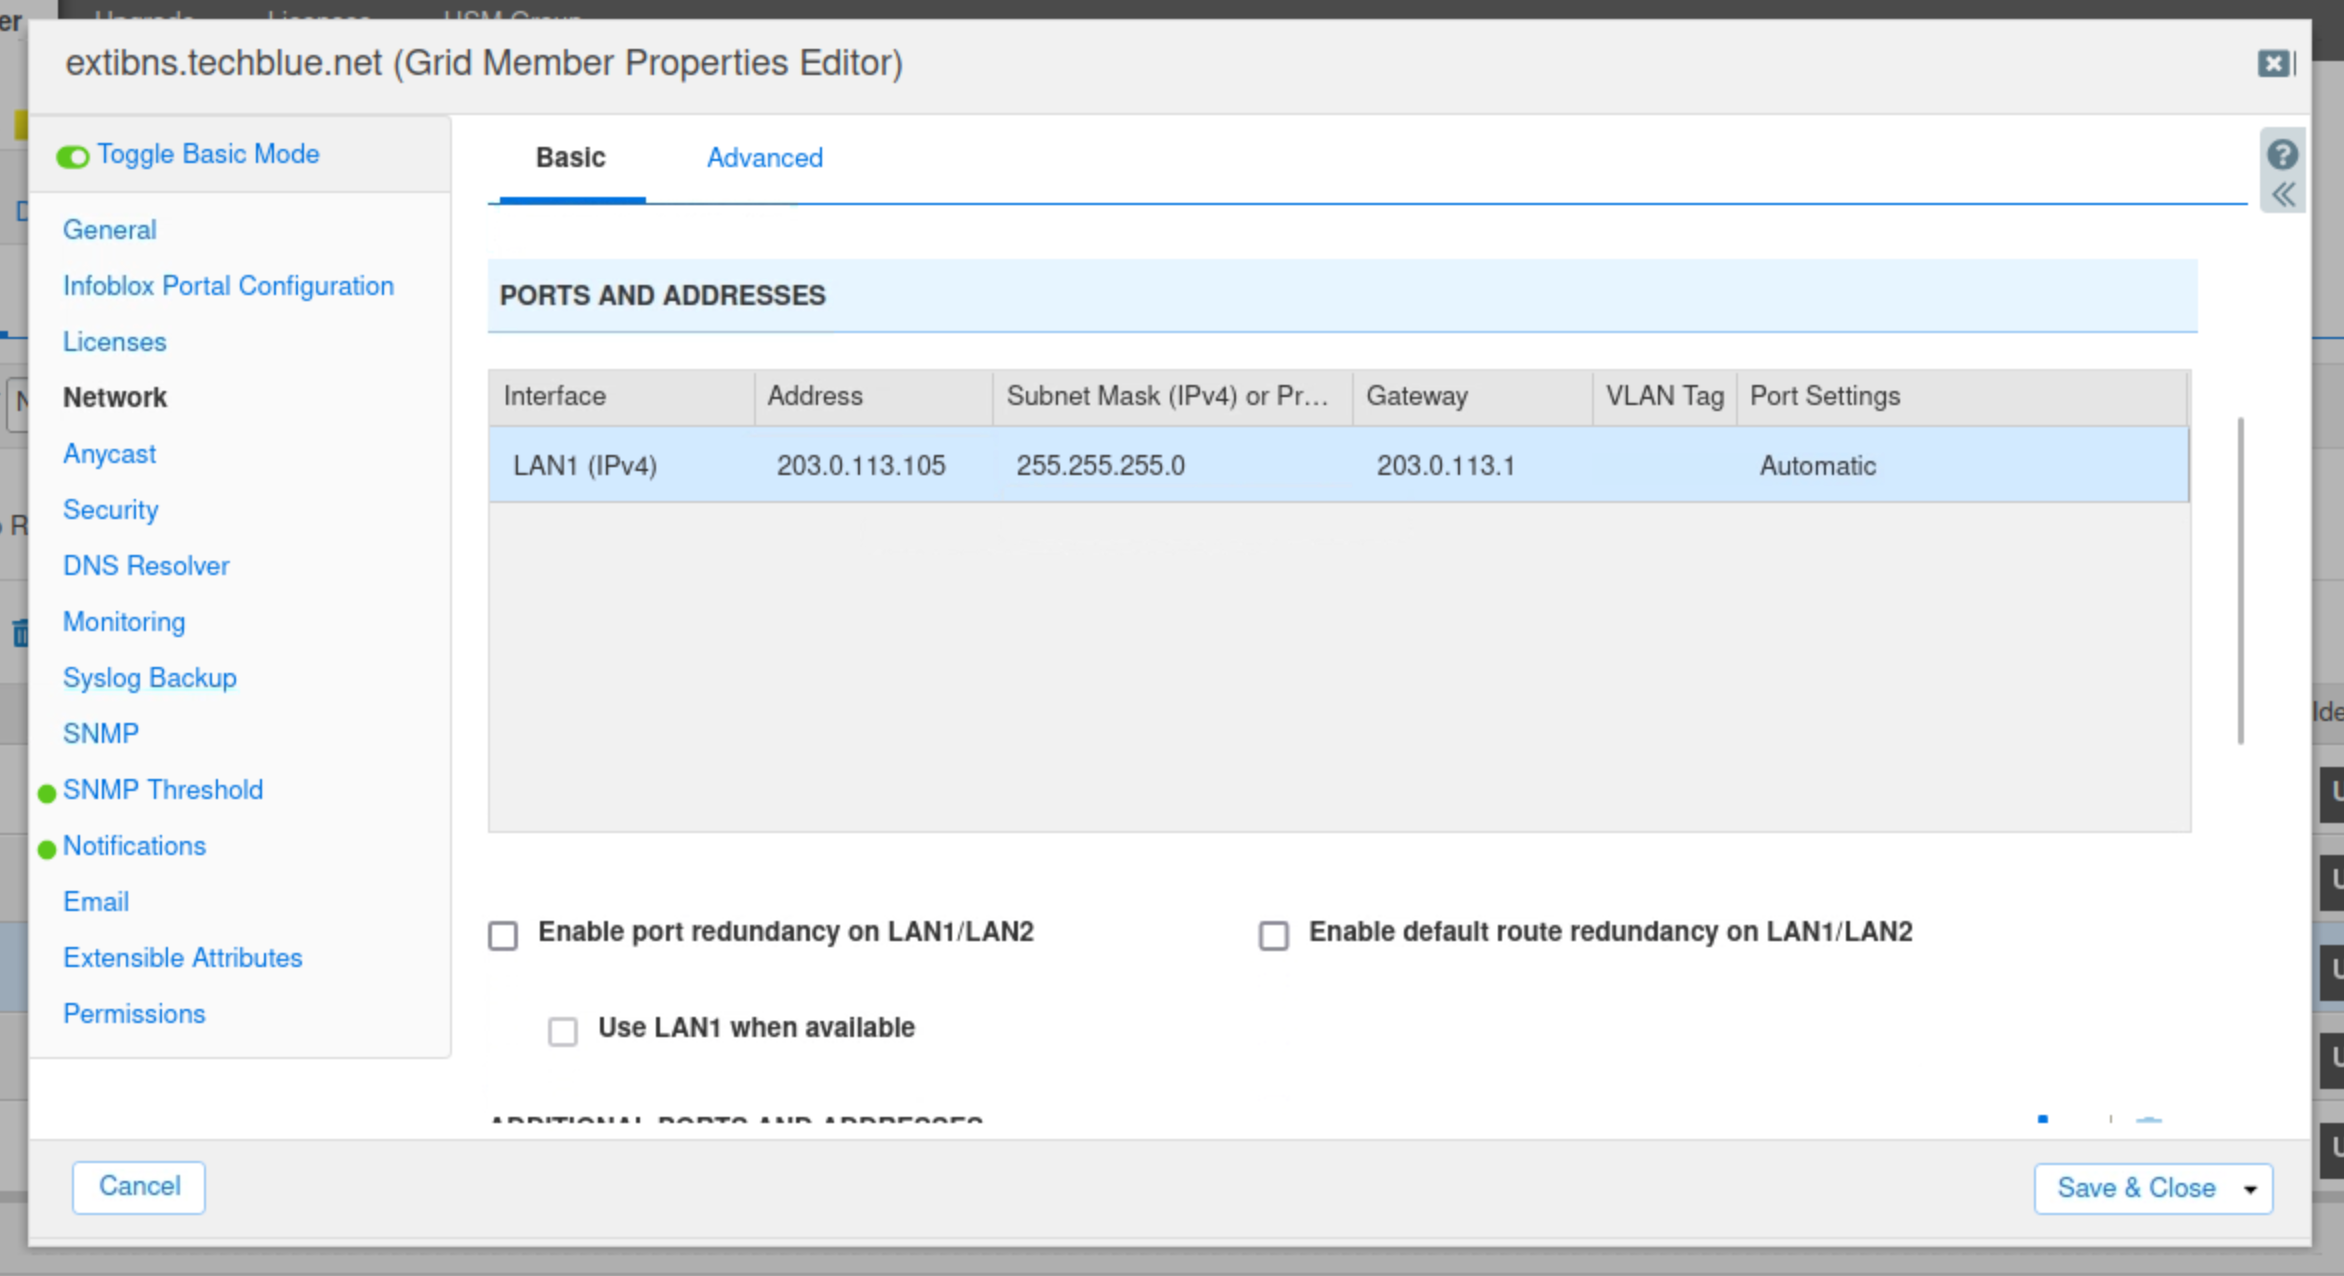
-
Click Save&Close.
-
Restart the services when prompted.
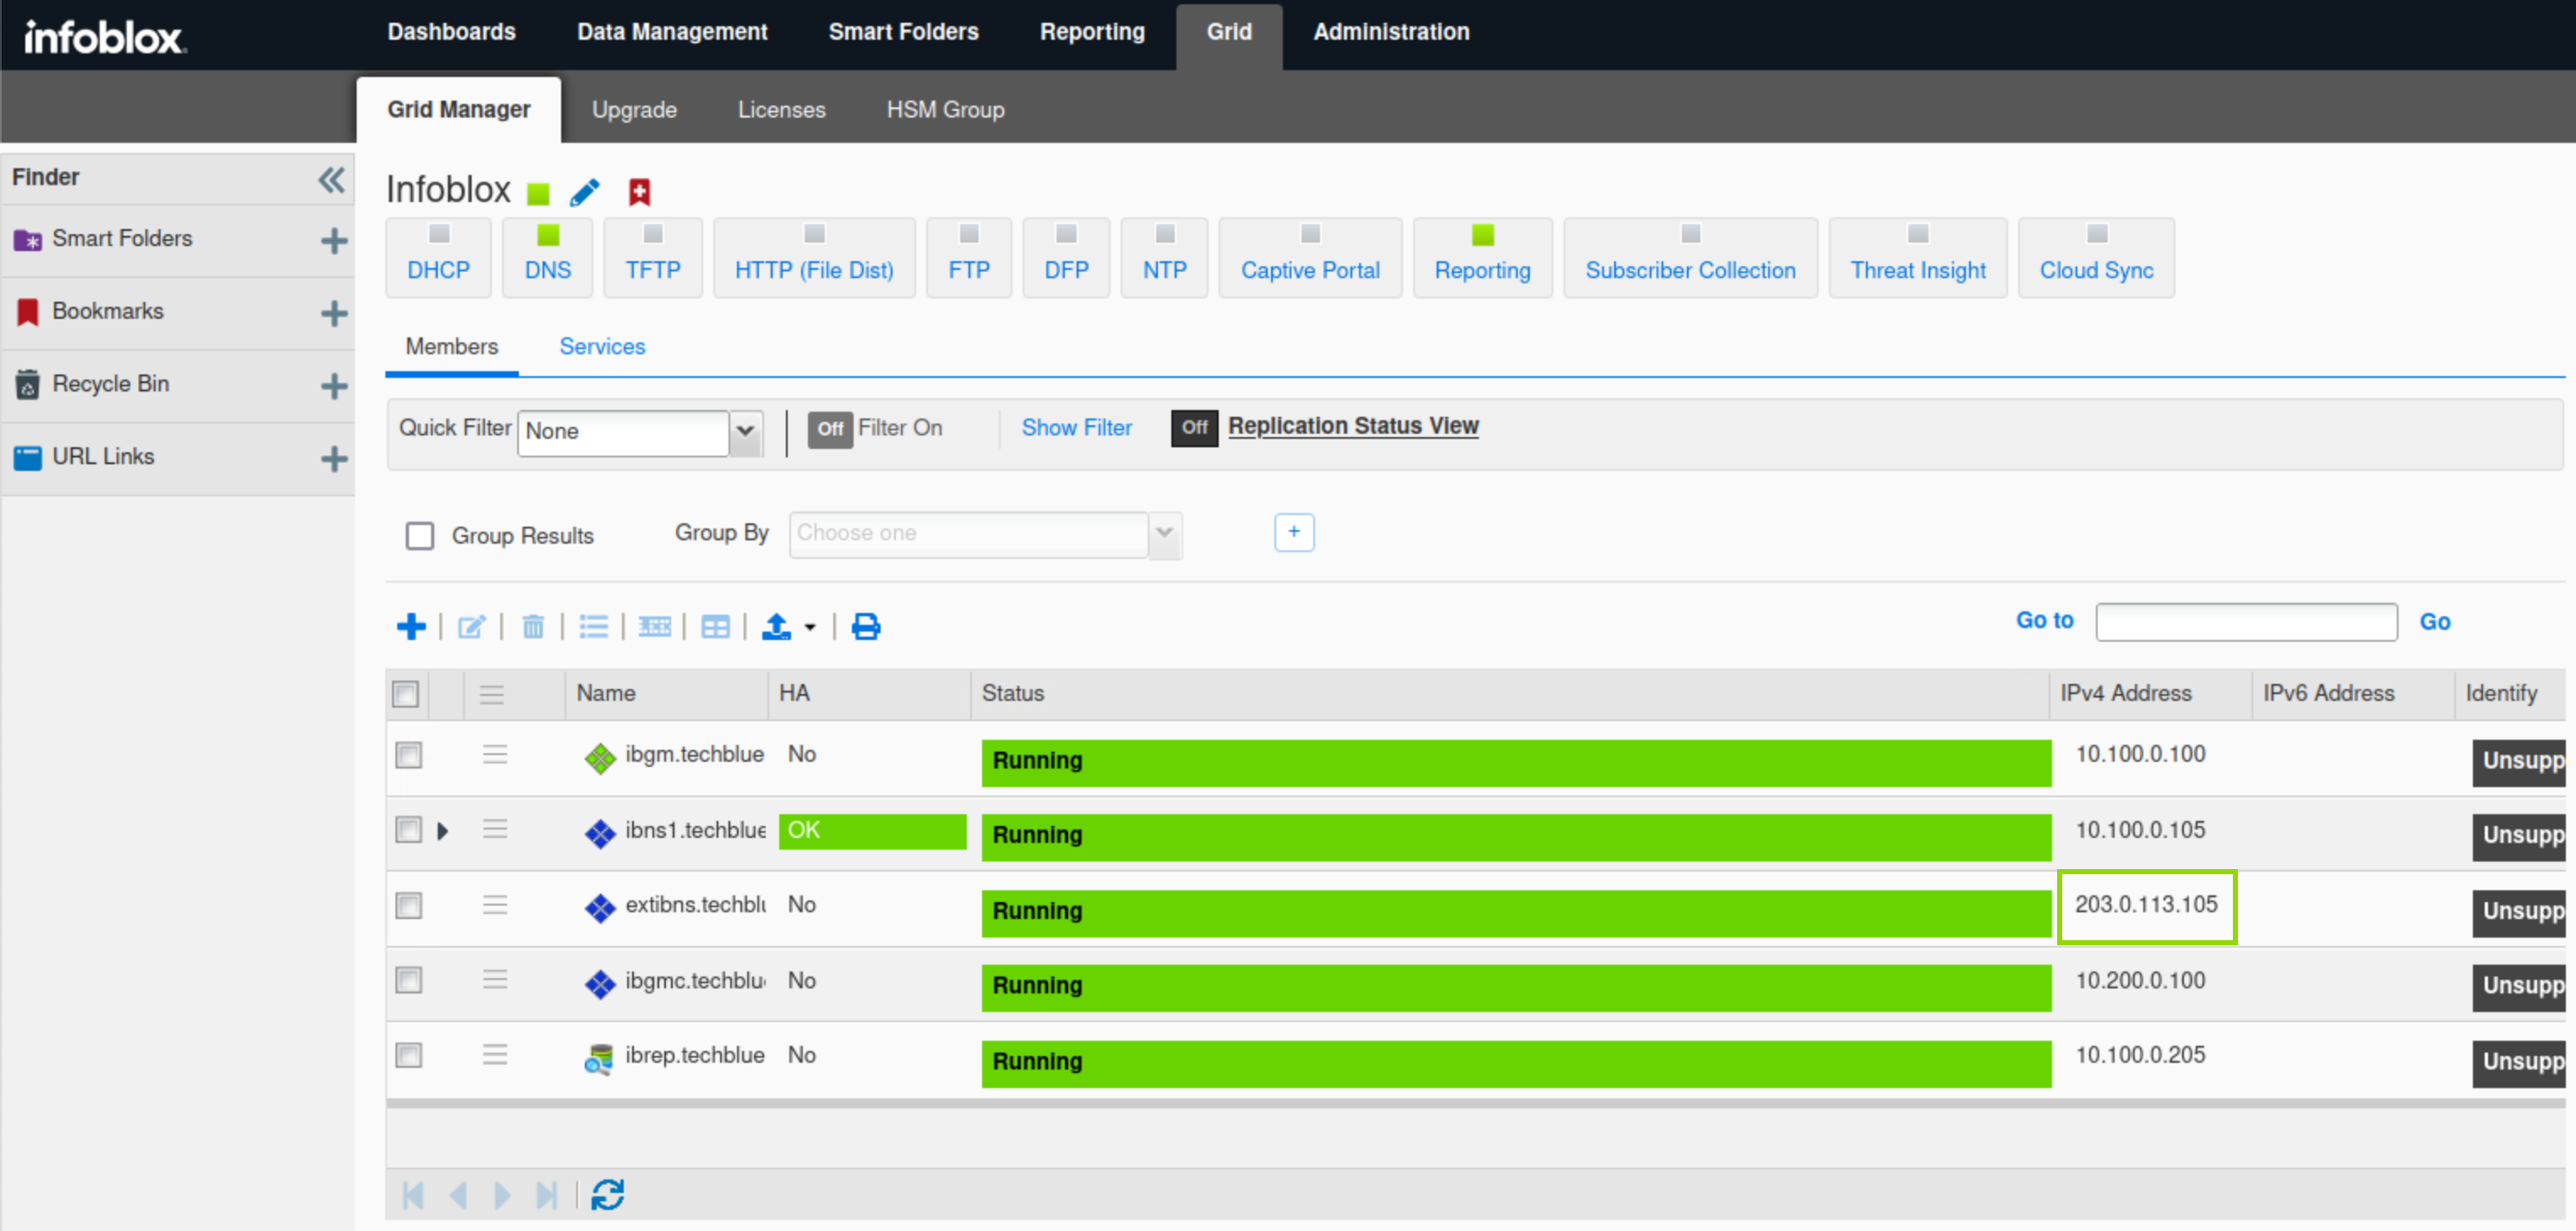
Task 3 Solution: Verify extibns.techblue.net successfully joined the Grid
In this task, we are verifying that extibns.techblue.net has successfully rejoined the grid with the new Interface configurations we added in the previous two steps.
-
Click the Refresh icon under Grid → Grid Manager → Members to validate that extibns.techblue.net has successfully rejoined the Grid and is running.
-
It should take between 3 to 5 minutes for extibns.techblue.net to rejoin the grid.
-
Task 4 solution: Configure extibns.techblue.net Reporting Settings
In this task, we update the reporting configuration to allow extibns.techblue.net to use its management interface to send data to the reporting server.
-
Navigate to Grid → Grid Manager → Reporting.
-
Select extibns.techblue.net and click the Edit button.
-
Under General, select the Advanced tab.
-
From the Forwarding Interface drop-down menu, select MGMT.
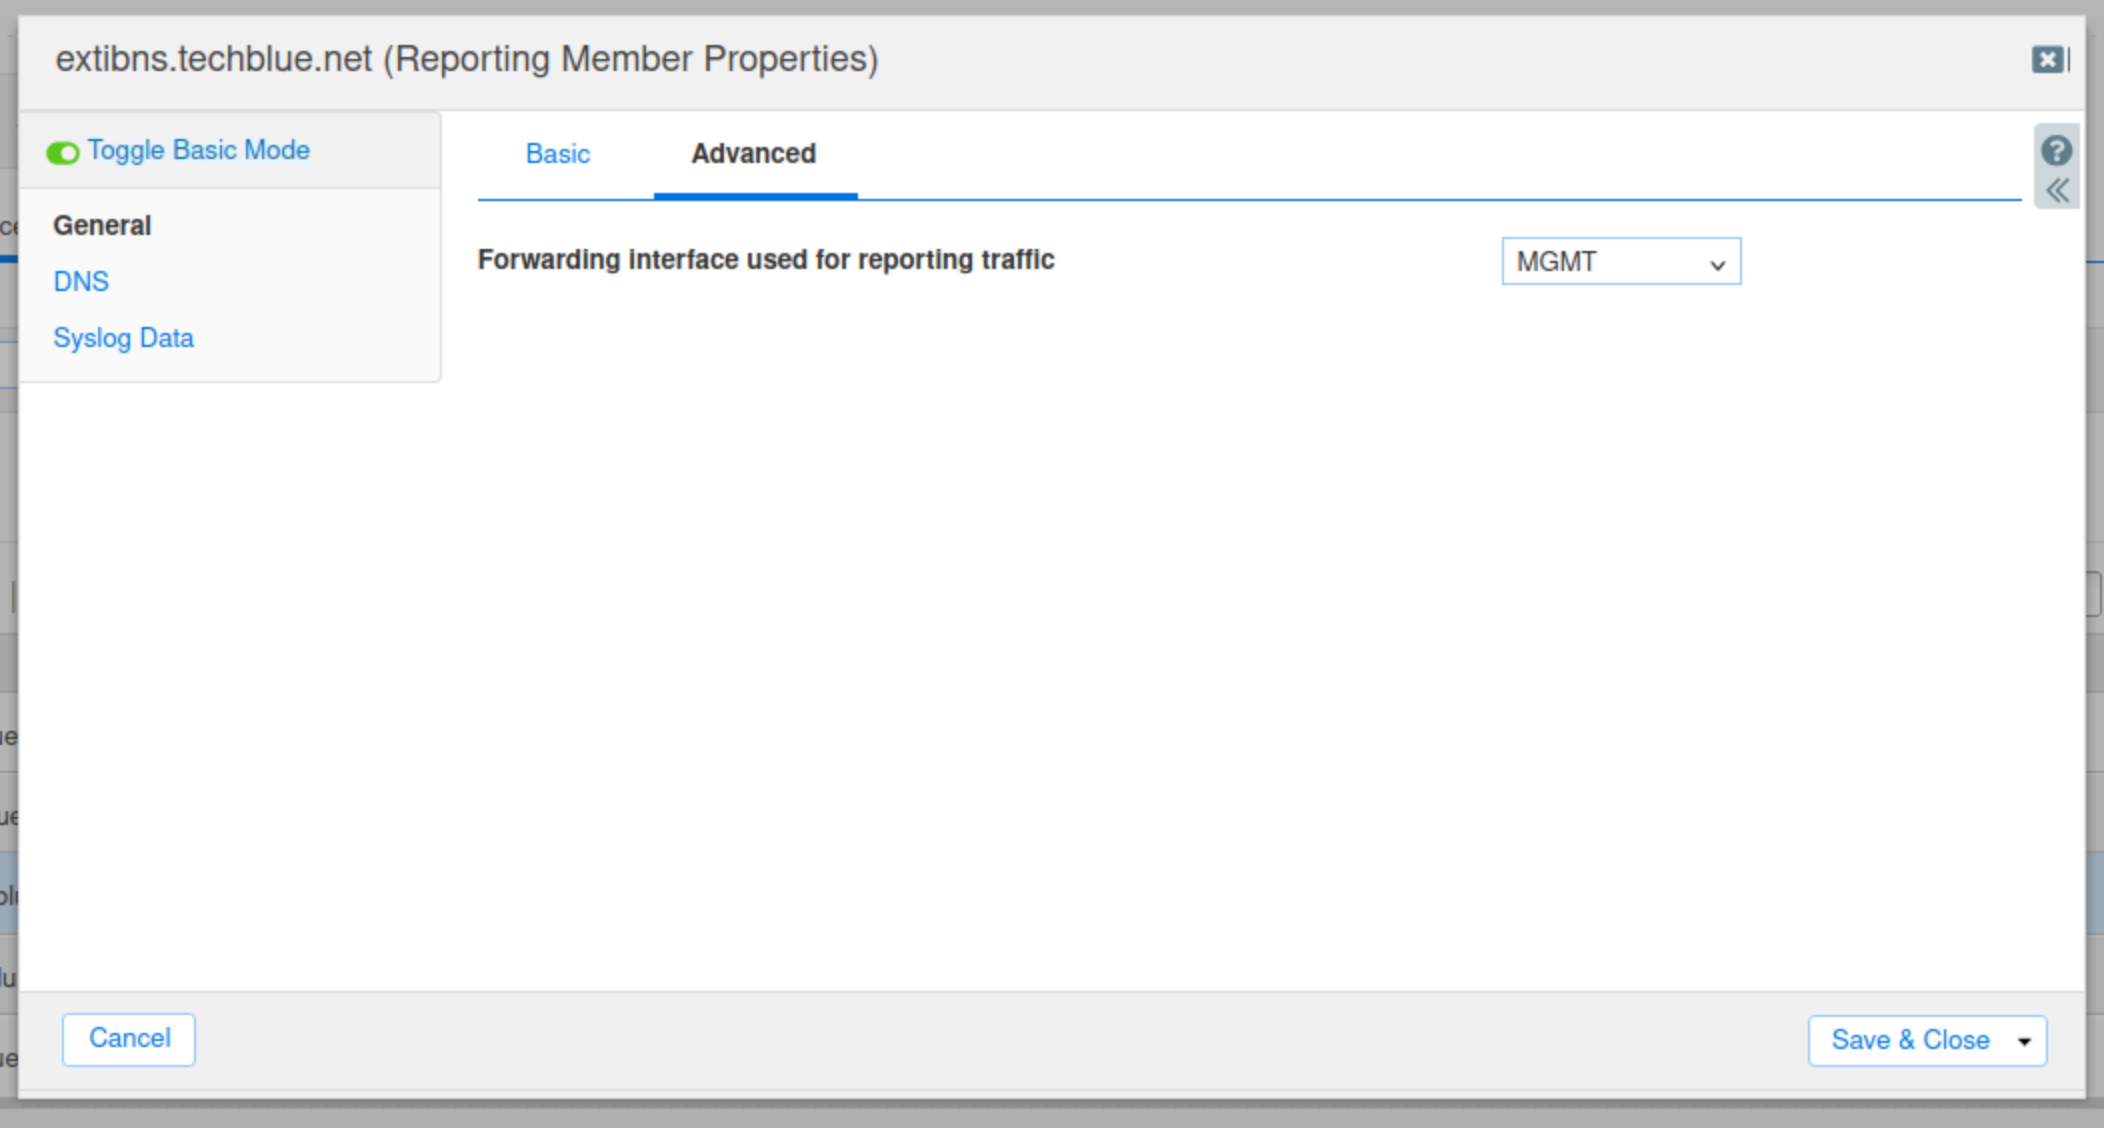
-
Click Save & Close.
-
Restart Services when prompted.
Task 5 Solution: Set up the Reporting Server
-
Navigate to Reporting and click Continue to App Setup page.
-
Use the information from this table to set up the reporting server:
|
Configuration |
Value |
|
Username |
training |
|
Password |
infoblox |
|
Protocol |
SCP |
|
Host/ IP Address |
10.100.0.205 |
|
Port |
22 |
|
Path |
/home/training/Documents/ReportingData |
Task 6 Solution: Import the DNS-techblue.io.csv file and start DNS services on extibns.techblue.net
-
Navigate to Grid → Grid Manager → Members.
-
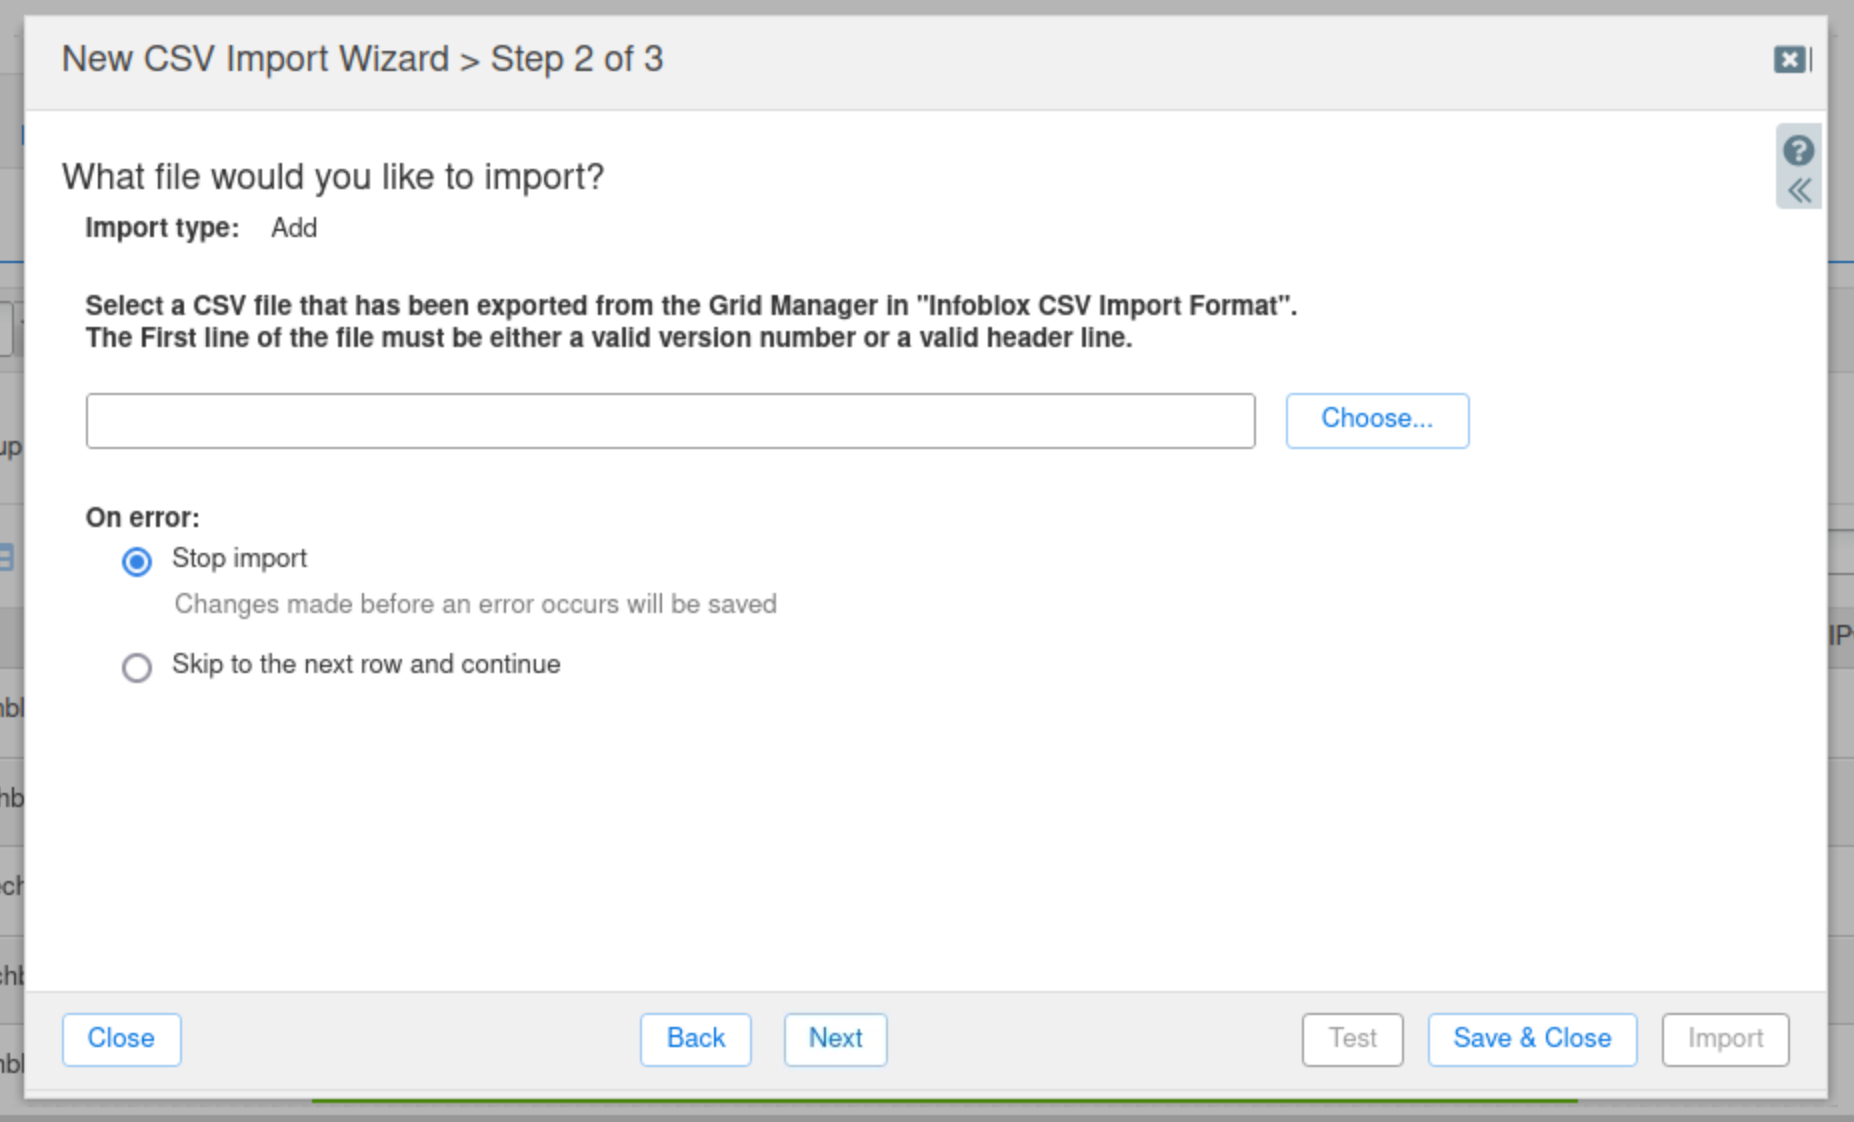
Click CSV Import on the Toolbar.
-
Select Add, then click Next.
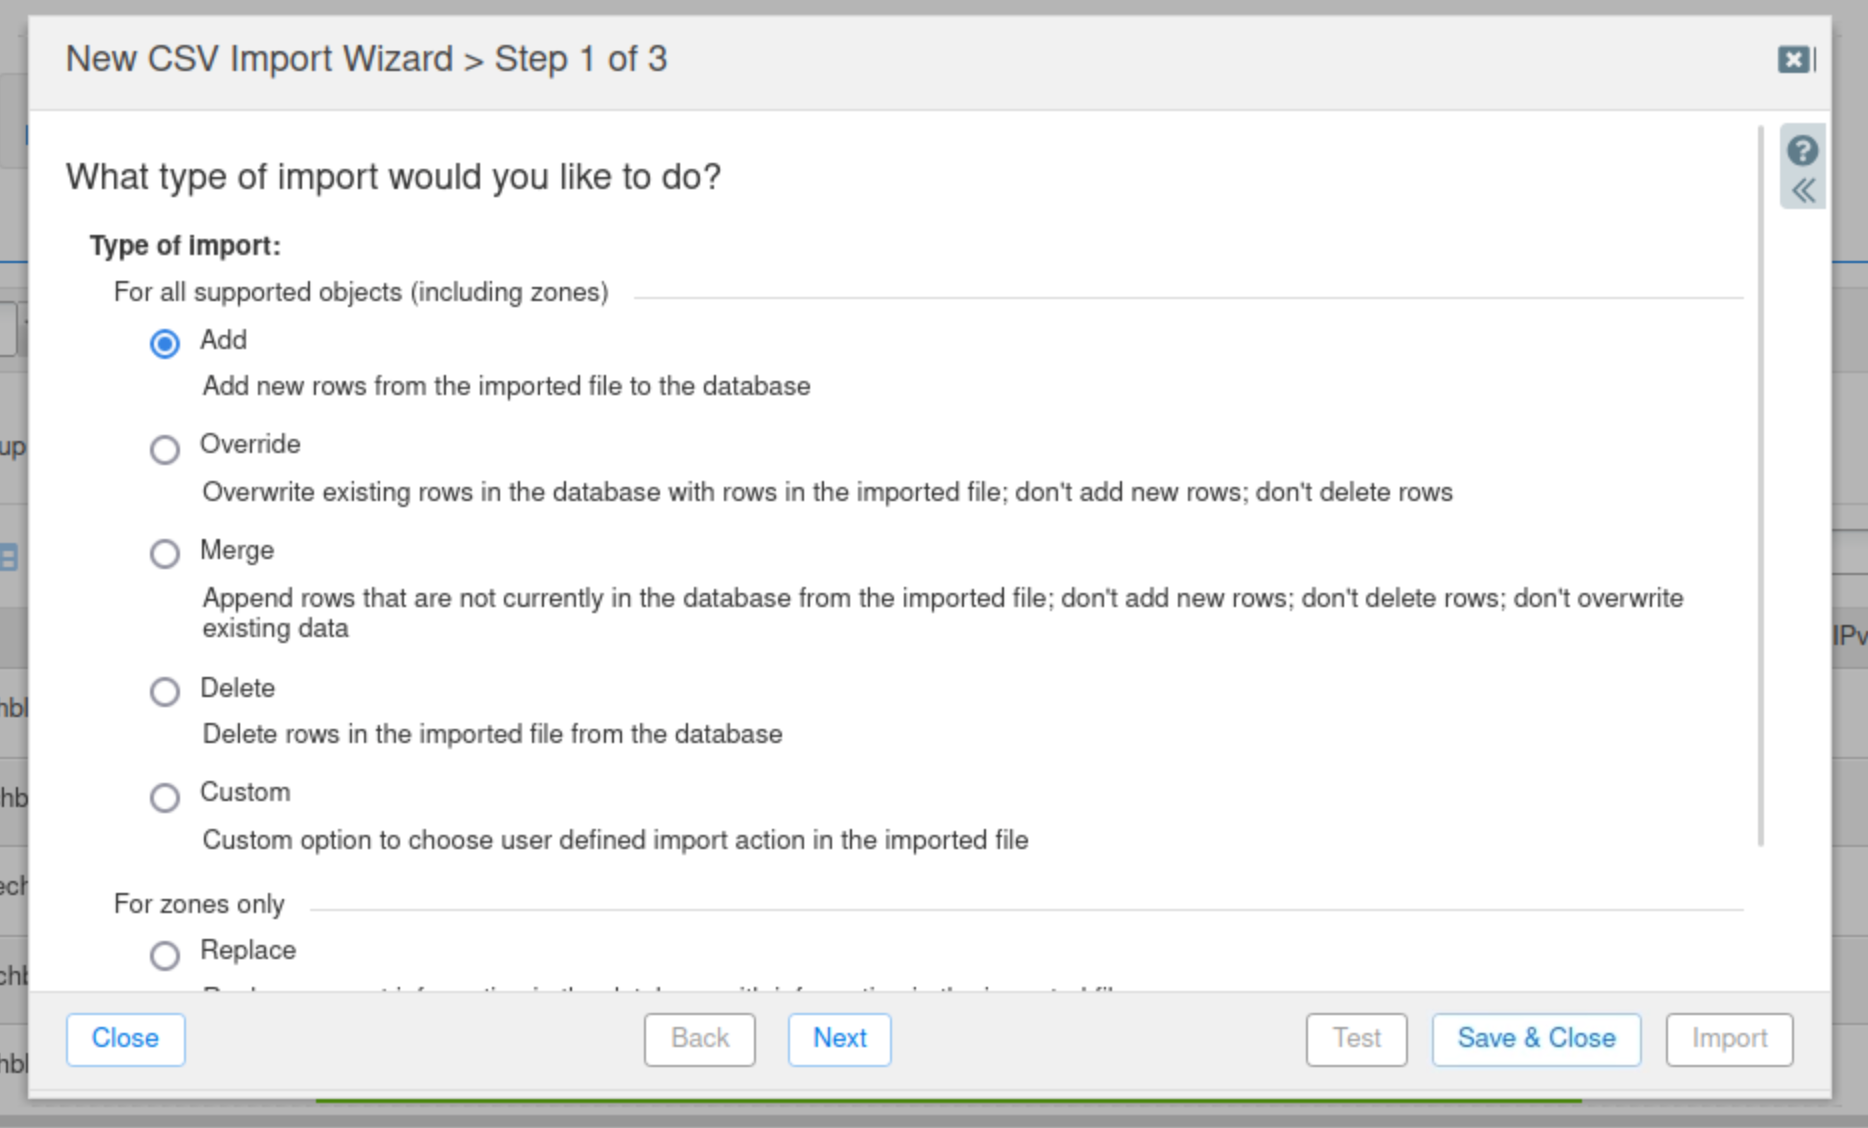
-
Select Choose.
-
Navigate to the
Shared Drive/nios-importsfolder and select the DNS-techblue.io.csv file.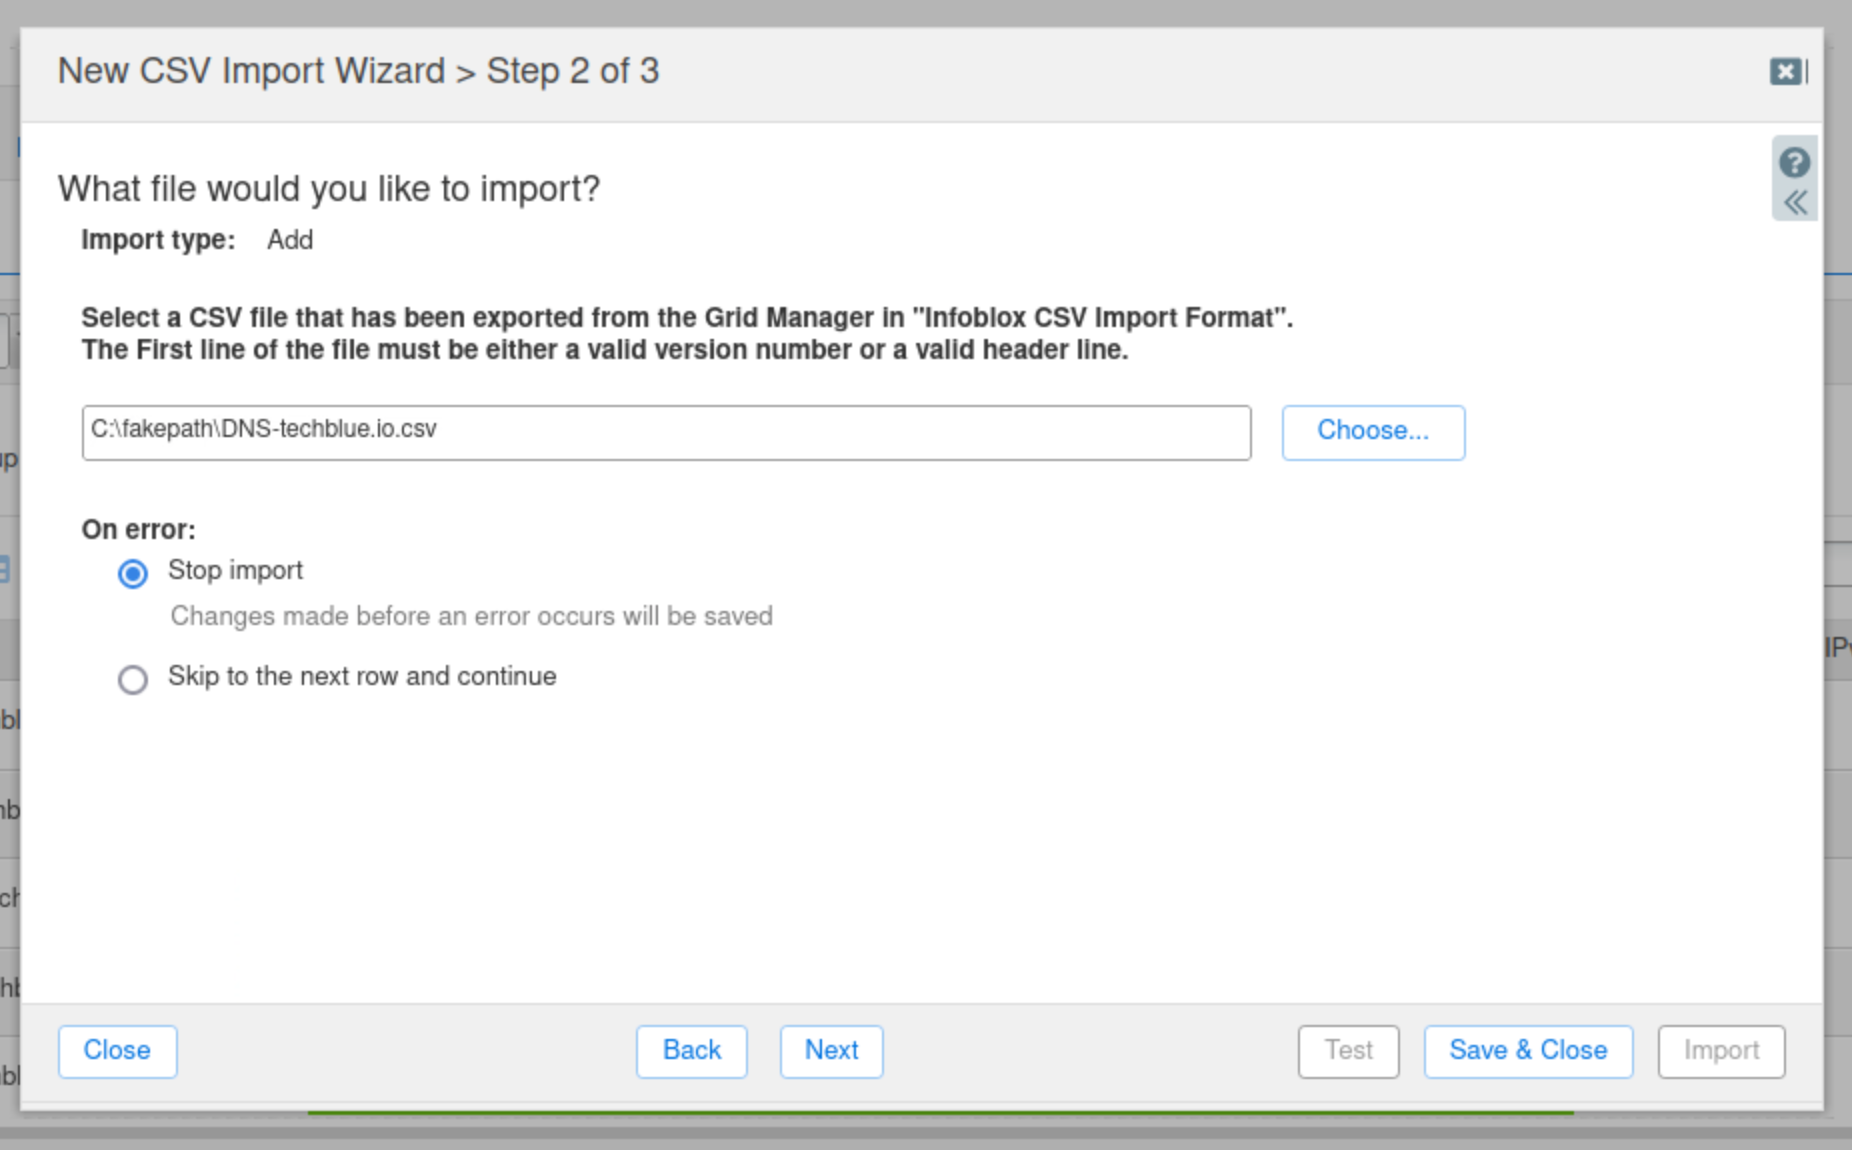
-
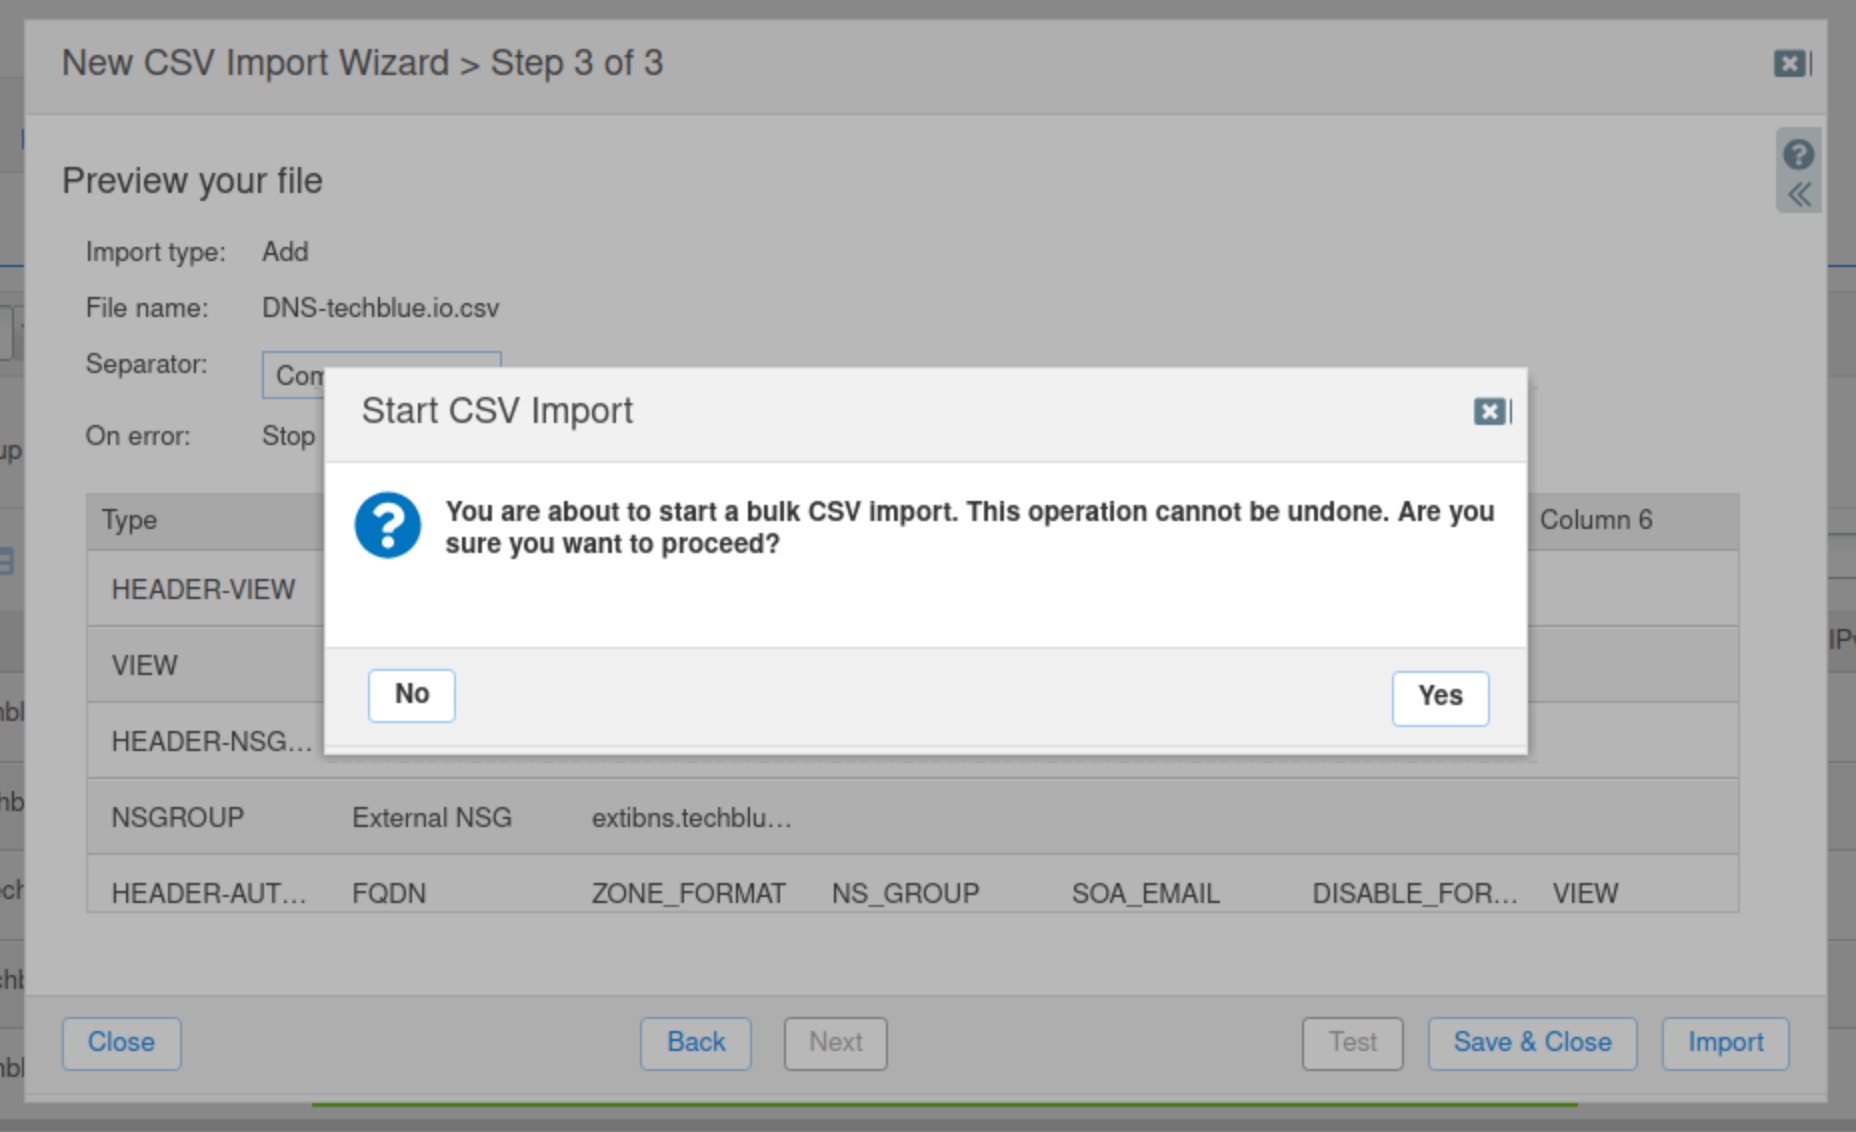
Click Next to go to Step 3 of the Import wizard, then click Import to start importing.
-
Click Yes to confirm the import.
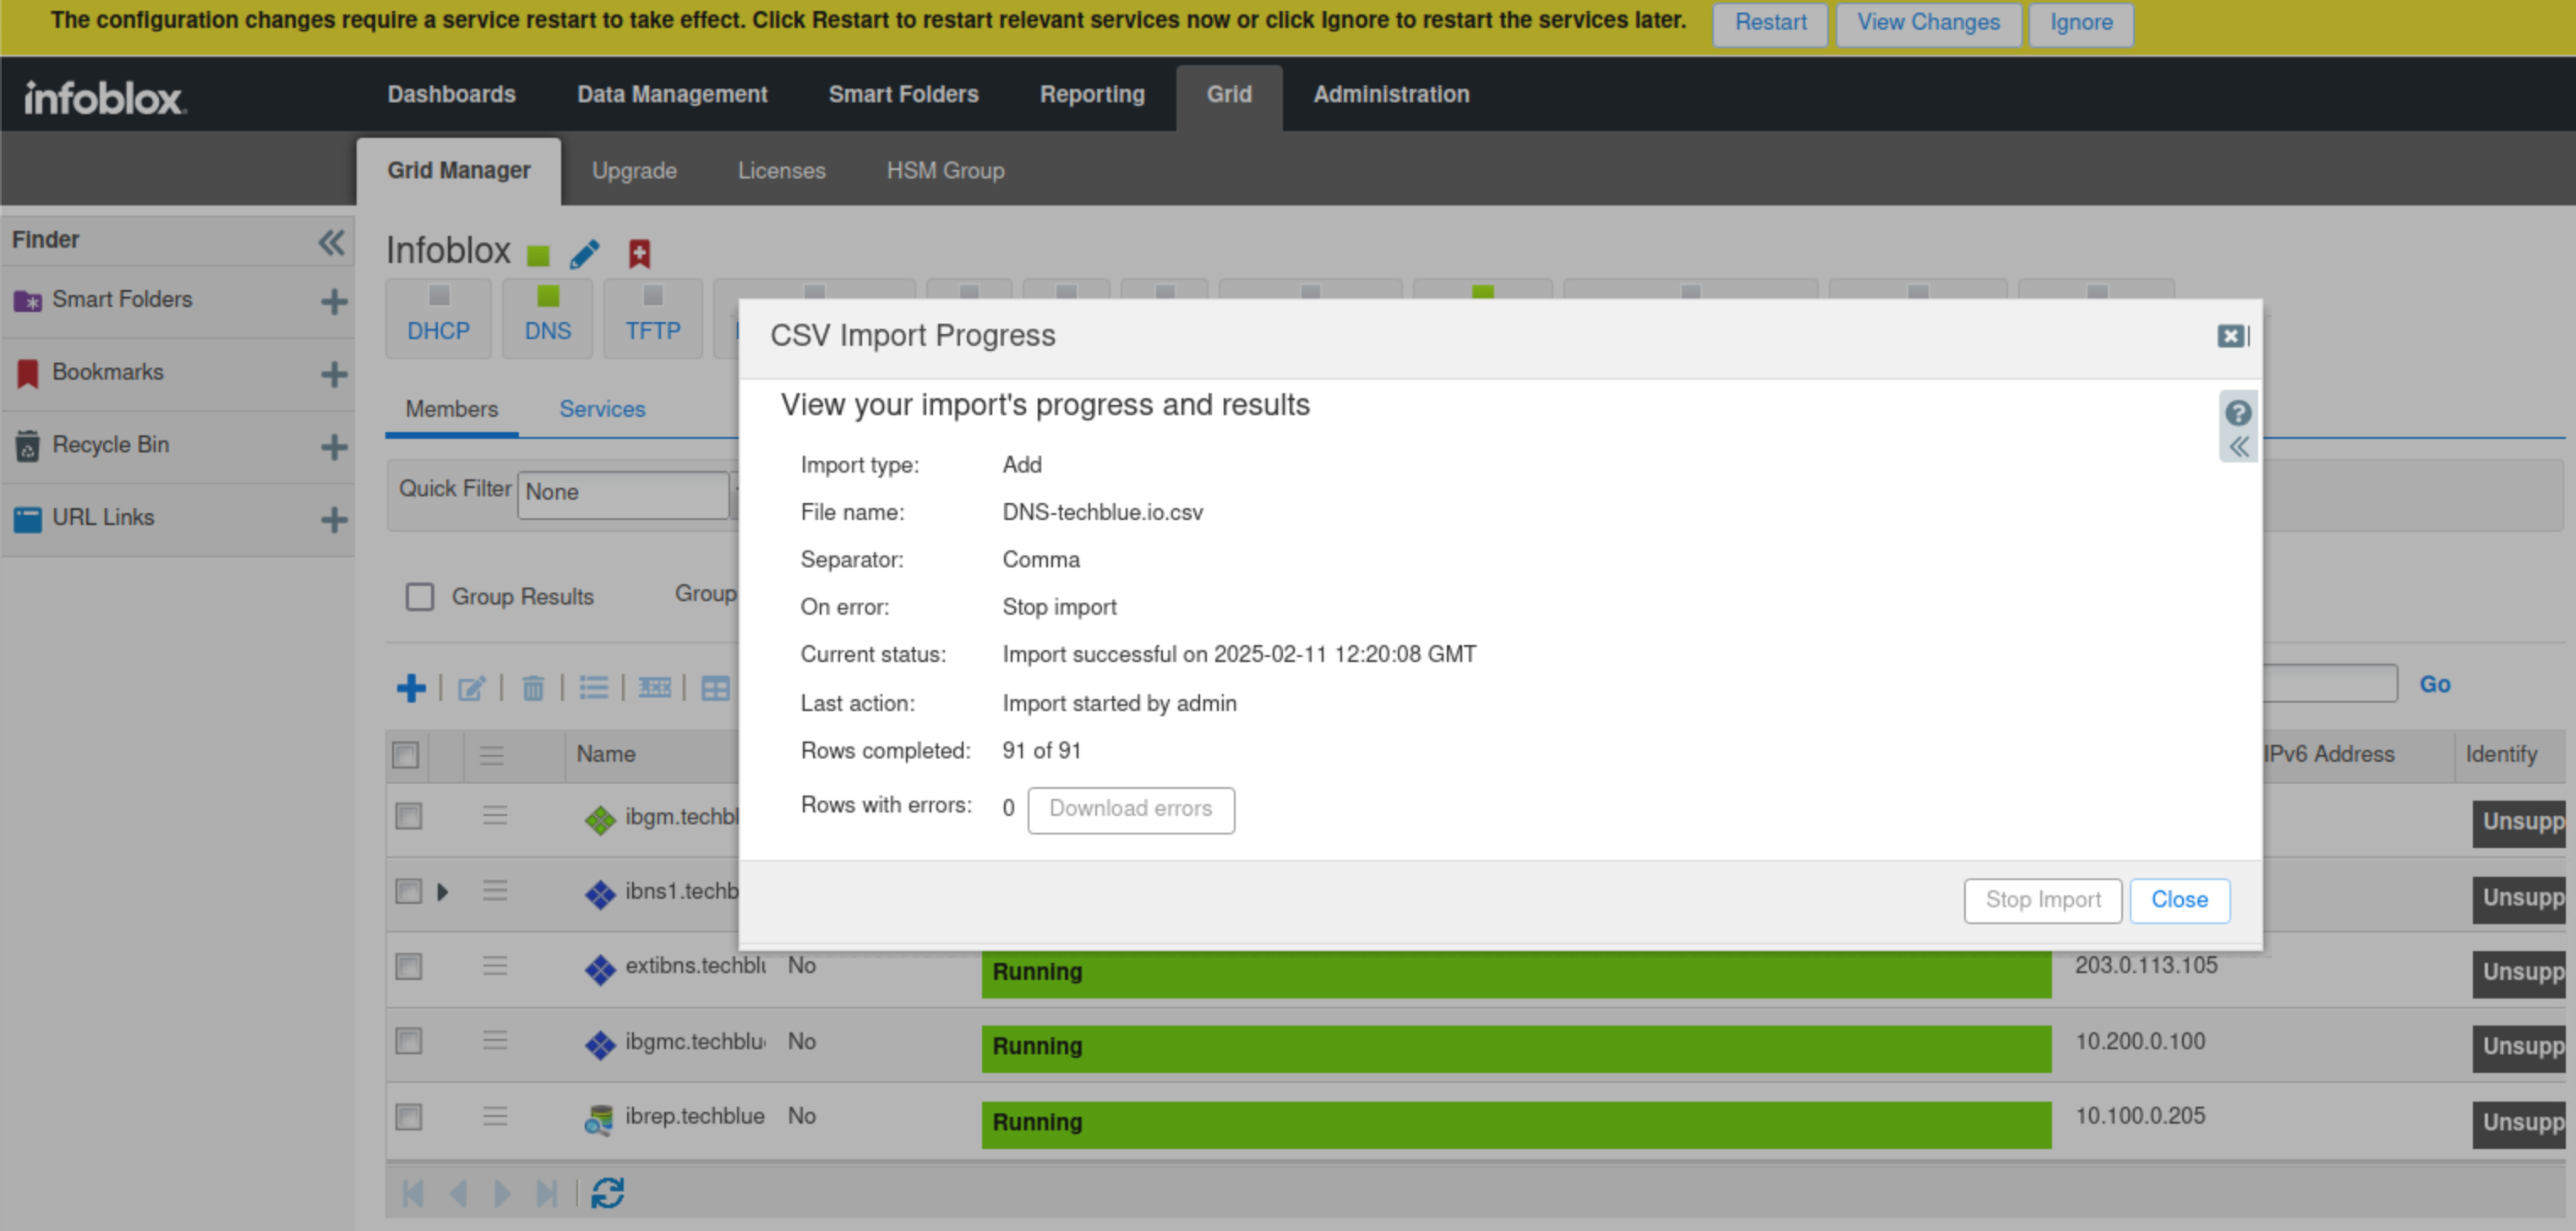
-
Click Close once the import is successfully completed.
-
Restart services when prompted.
-
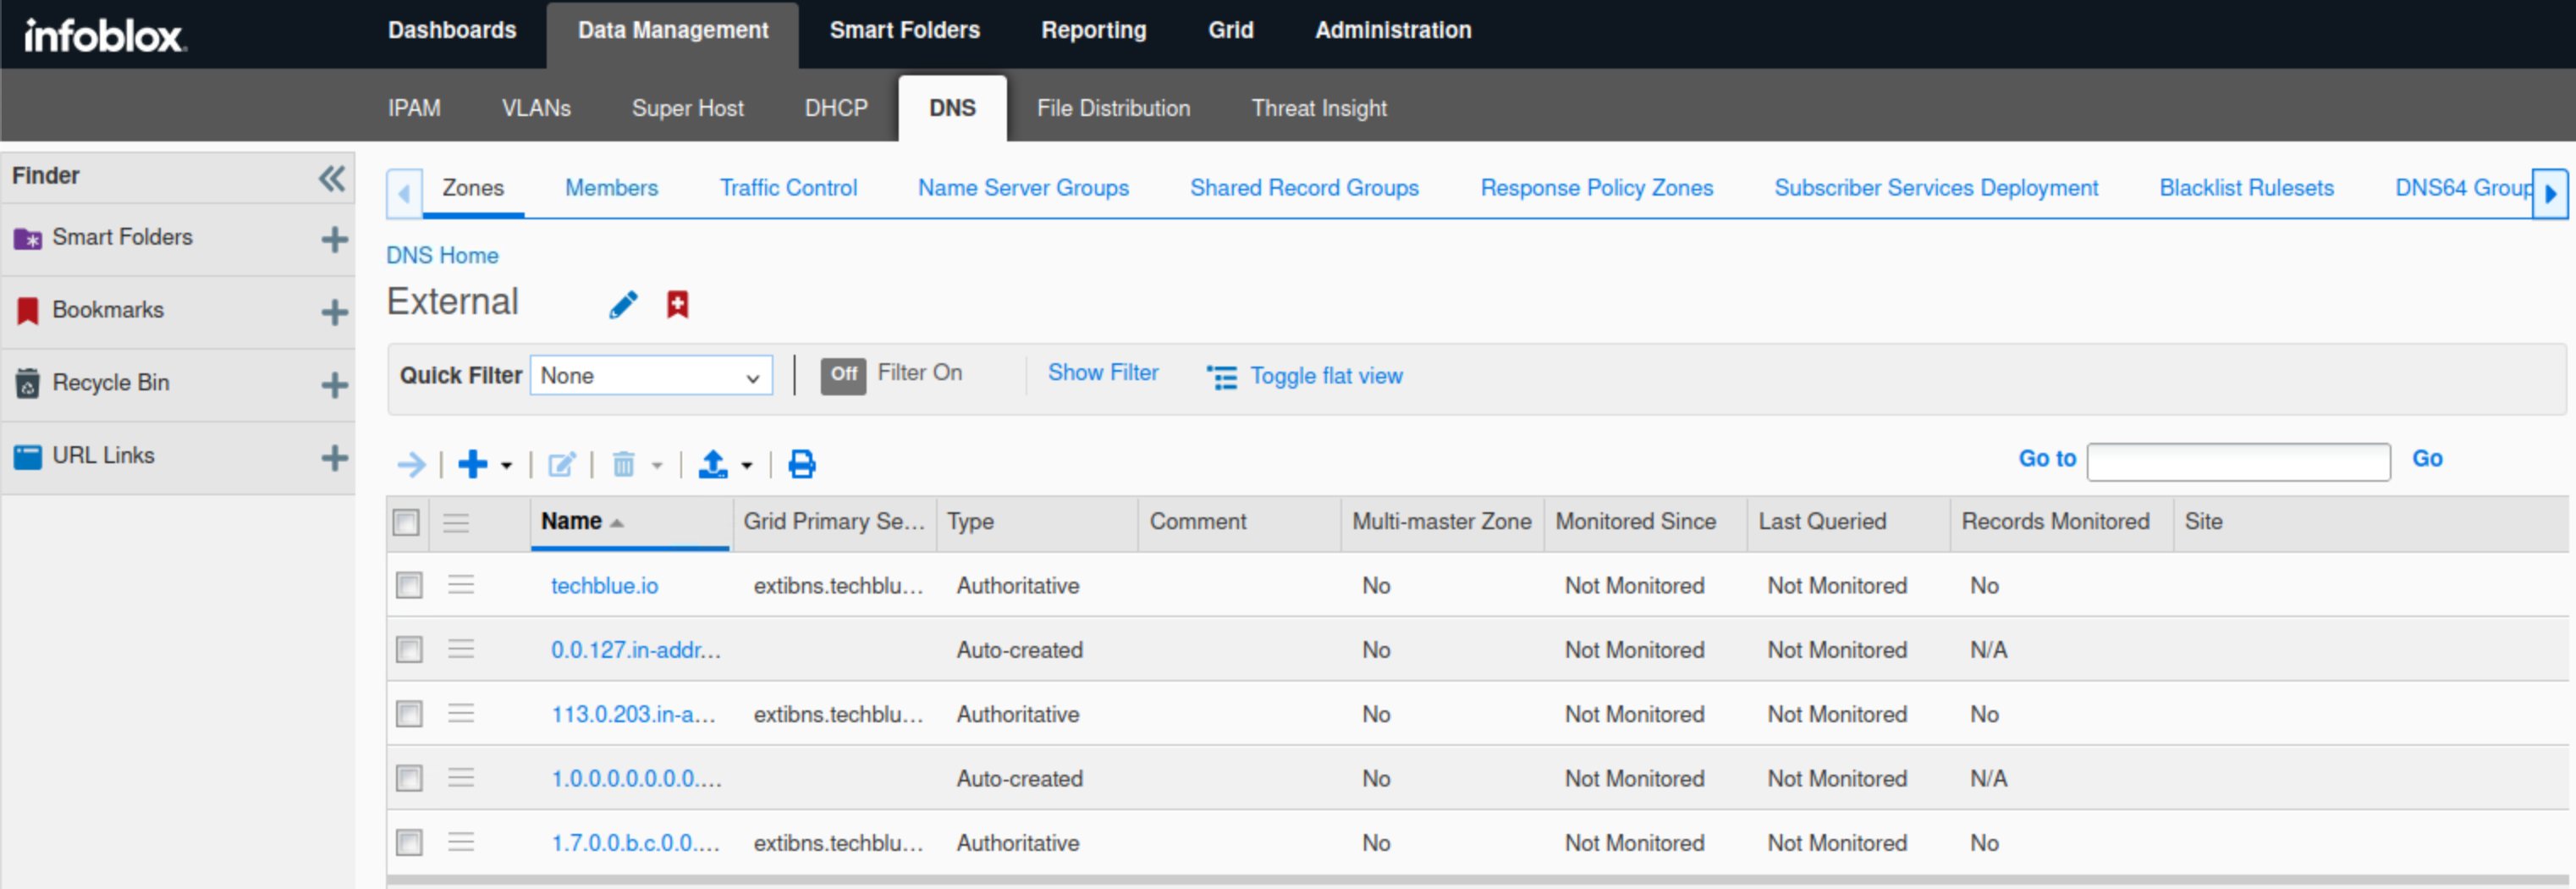
Confirm that the DNS view External is created by navigating to Data Management → DNS → Zones.
-
Click the External view name to see the zones.
-
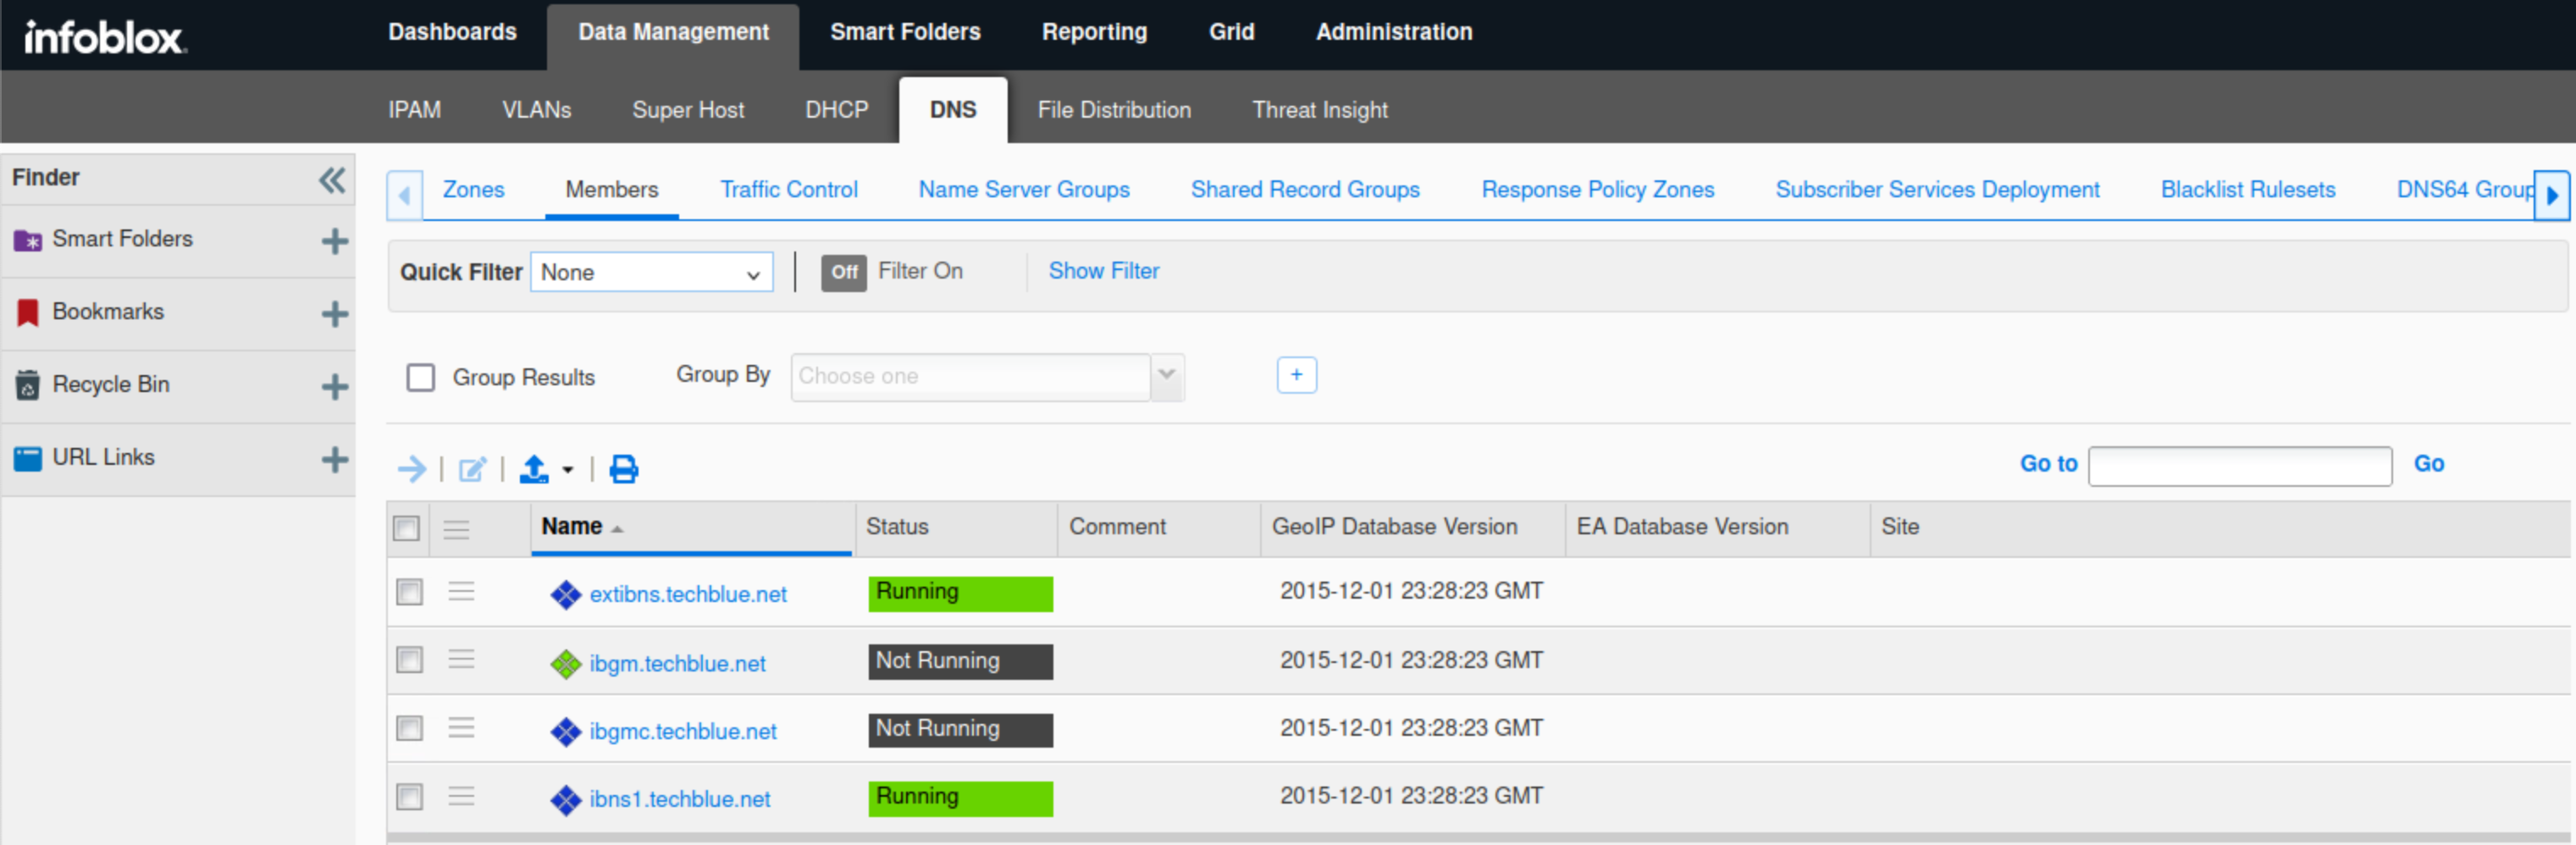
Navigate to Data Management → DNS → Members.
-
Verify that the service is started/green, and is showing as “Running”.
Task 7 Solution: Load ADP License Files to the Grid
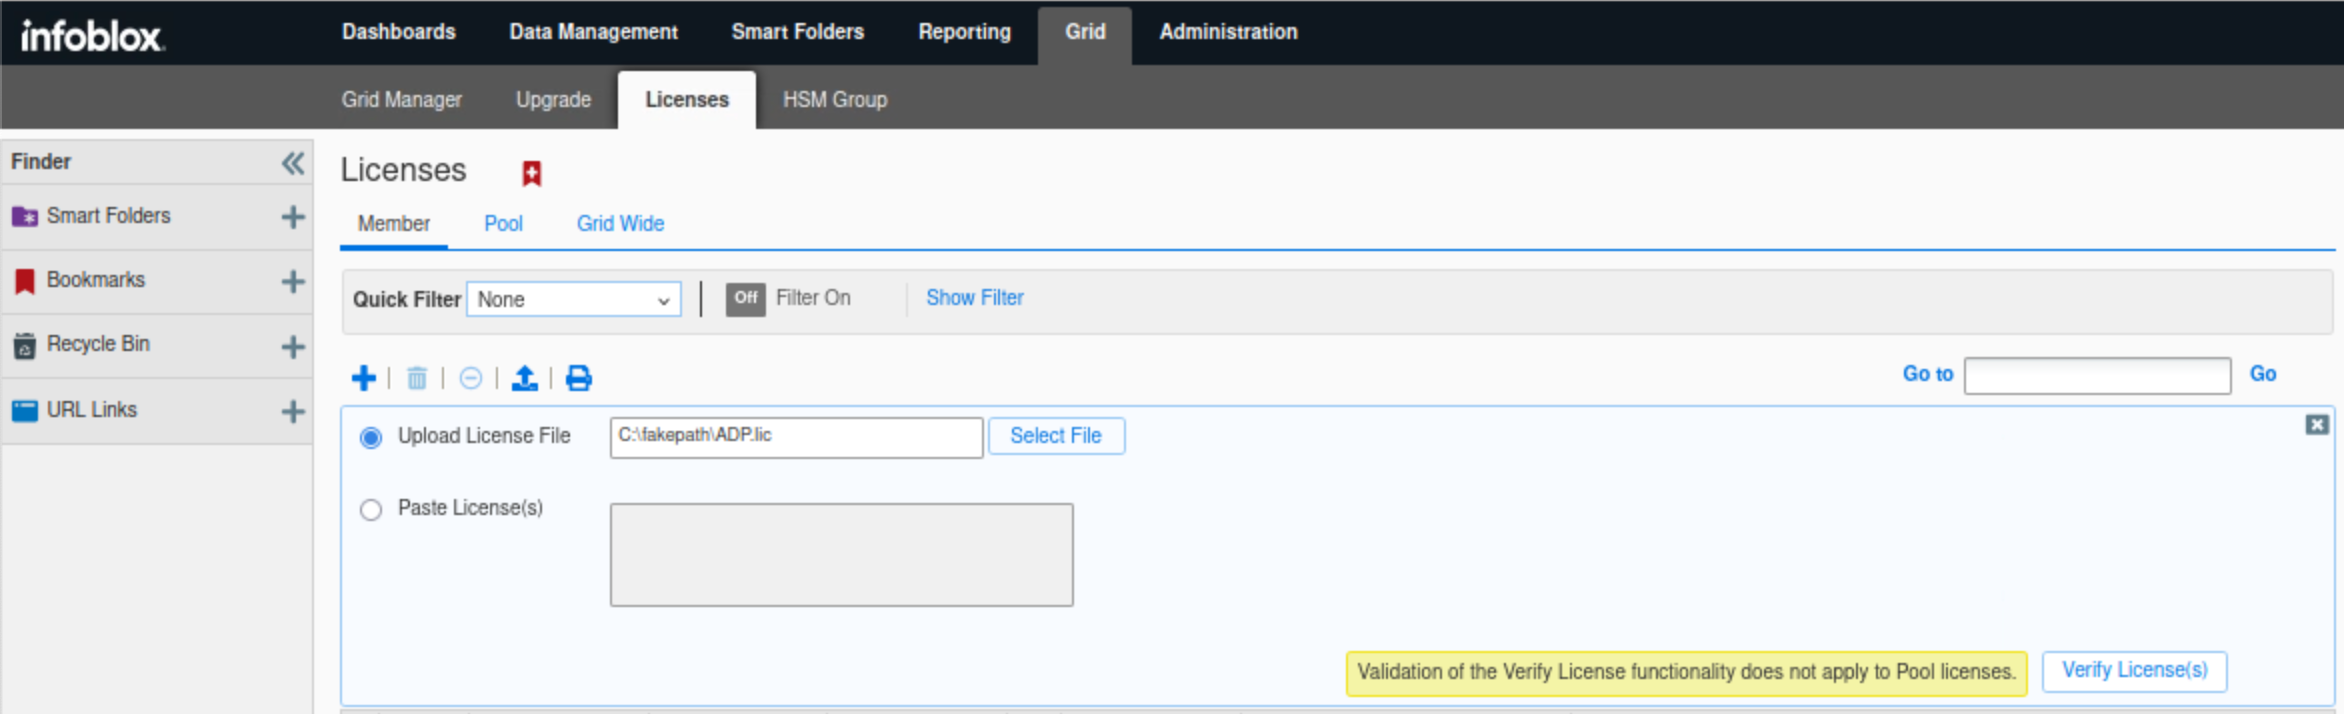
In this task, we will load the ADP license into the Grid.
-
On the jump-desktop machine, open a browser window and surf https://10.100.0.100.
-
Navigate to Grid → Licenses → Members.
-
Click the plus (+) symbol to add a new license.
-
Click Select File to upload the license file.
-
Navigate to
Shared Drive/Licenses/9.0. -
Select the ADP.lic file and click Open.
-
Click Verify License(s), then Save All Valid Licenses.
-
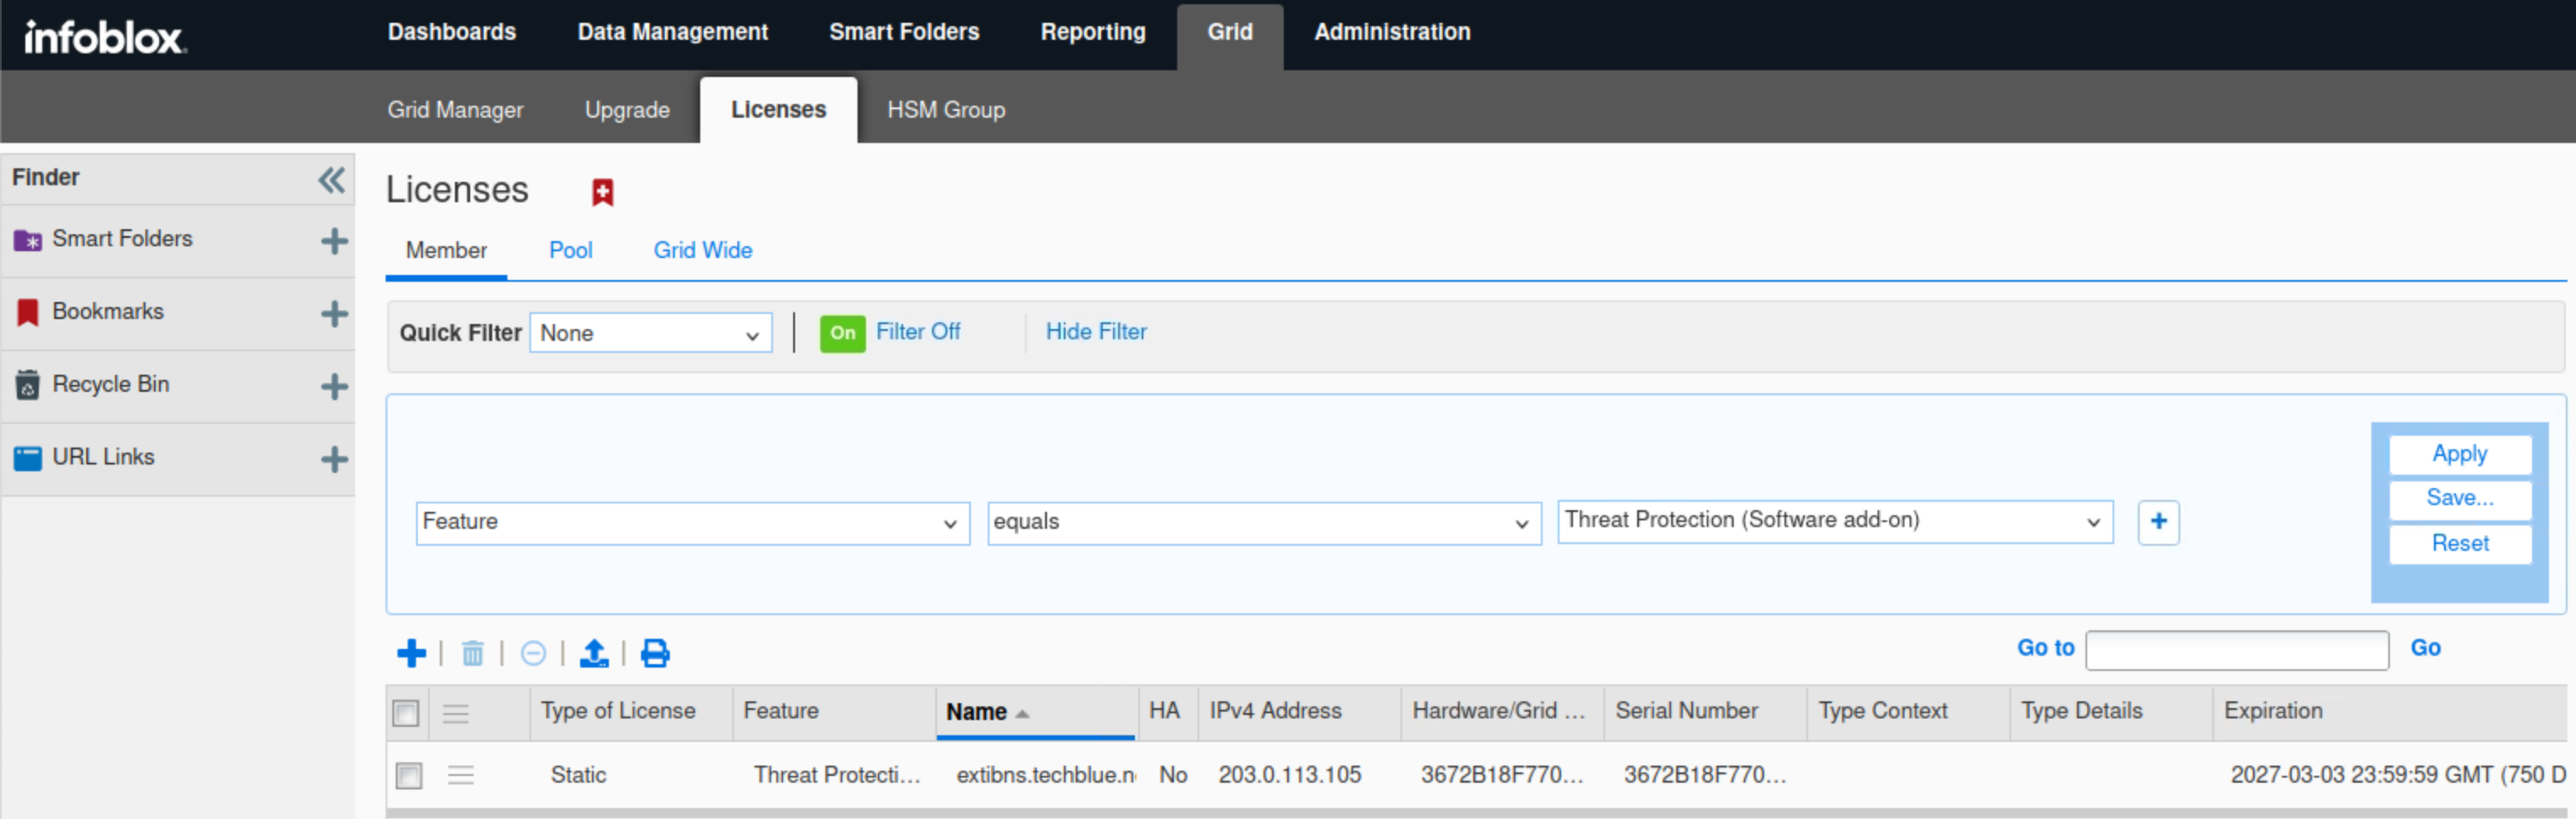
Click on the Show Filter link
-
Select Feature equals Threat Protection (software add-on), then click Apply.
-
Since ADP in this lab is not running on hardware, but rather on a virtual machine, we need to use this filter.
-
-
Select Feature equals Threat Protection update, then click Apply.
-
This license allows ADP rulesets to be updated automatically if configured.

-
Task 8 Solution: Upload Initial Ruleset
The Threat Protection Service (ADP) requires a ruleset to function; this will be automatically downloaded when the ADP service is started. In this task, we will upload an older ruleset so that we can update it to the latest ruleset in a later step.
-
Navigate to Data Management → Security → Threat Protection Rules.
-
Click the plus (+) symbol to add a ruleset.
-
Click Select to upload a file.
-
Select the ruleset-20250702.bin2 file from the
Shared Drive/NIOS-Importsfolder. -
Click Upload.
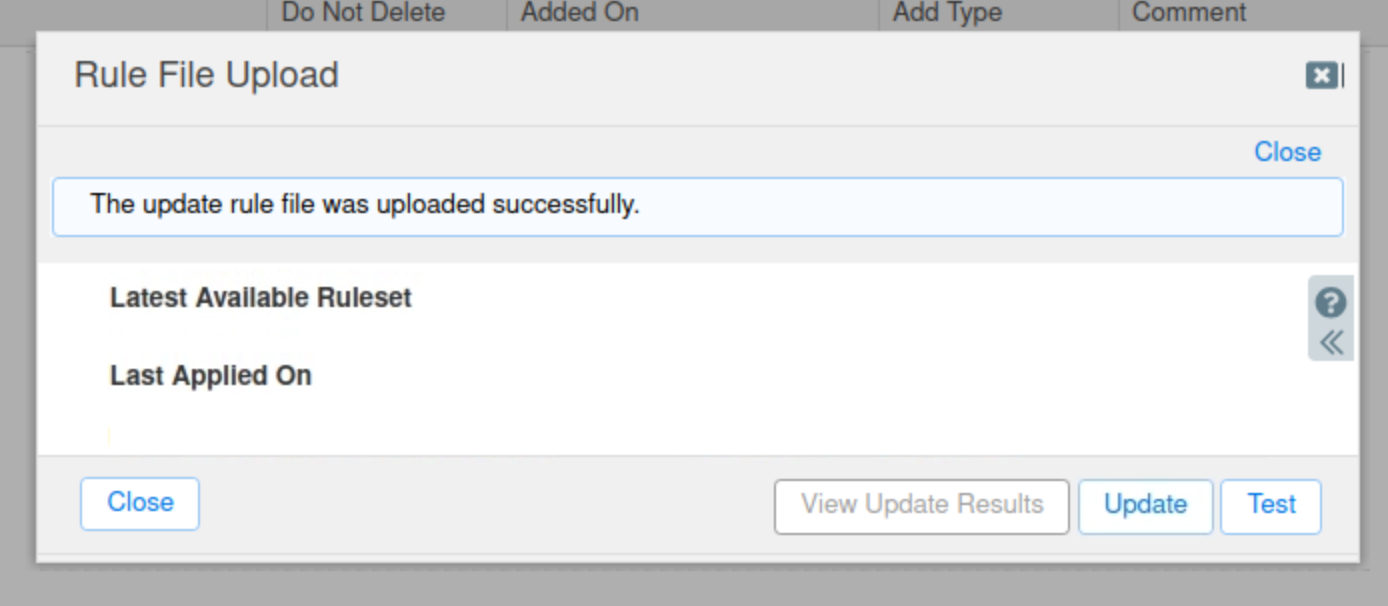
-
Click Test to verify that the ruleset file is not corrupted.
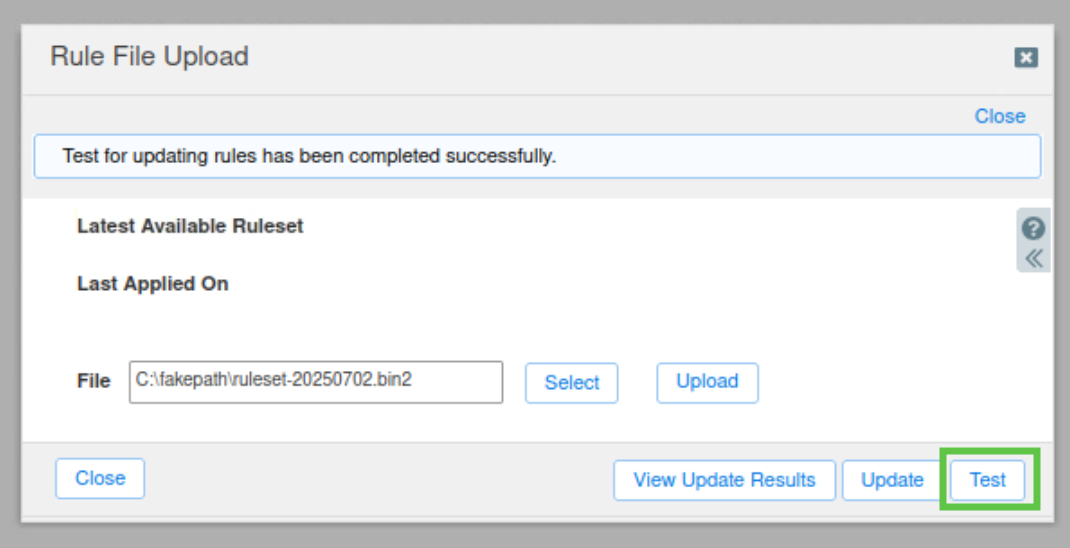
-
Click Update to update the rules.
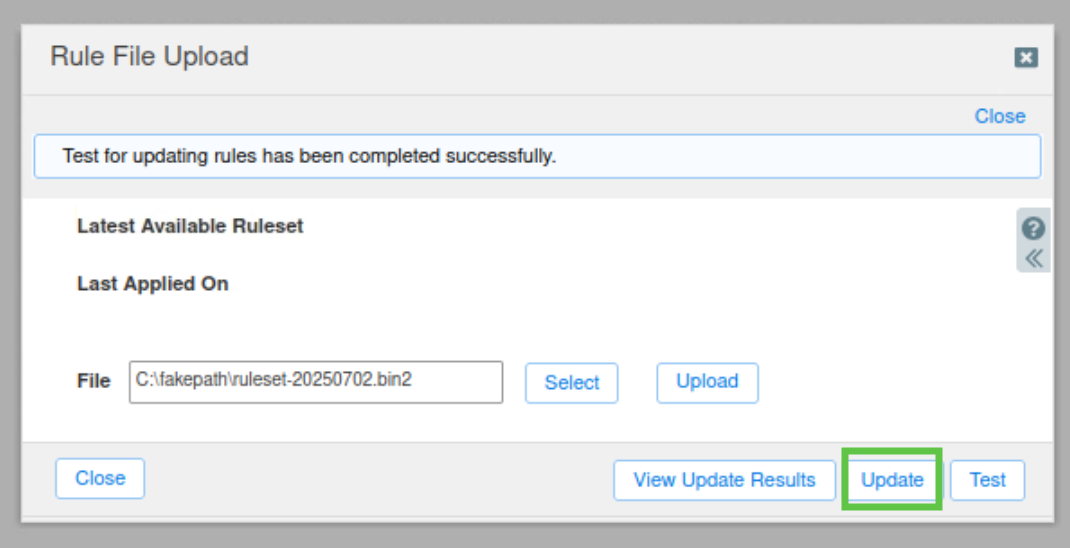
-
Close the Rule File Upload window.
-
The uploaded ruleset has become the active ruleset, as it’s the first one
Task 9 Solution: Configure Rule Update and Ruleset Download Policies
In this task, we will test our Grid’s connection to the ADP ruleset update servers and download the latest ruleset available for us to use, we wont be activating it yet.
-
Navigate to Data Management → Security → Threat Protection Rules.
-
Select Grid Security Properties from the Toolbar.
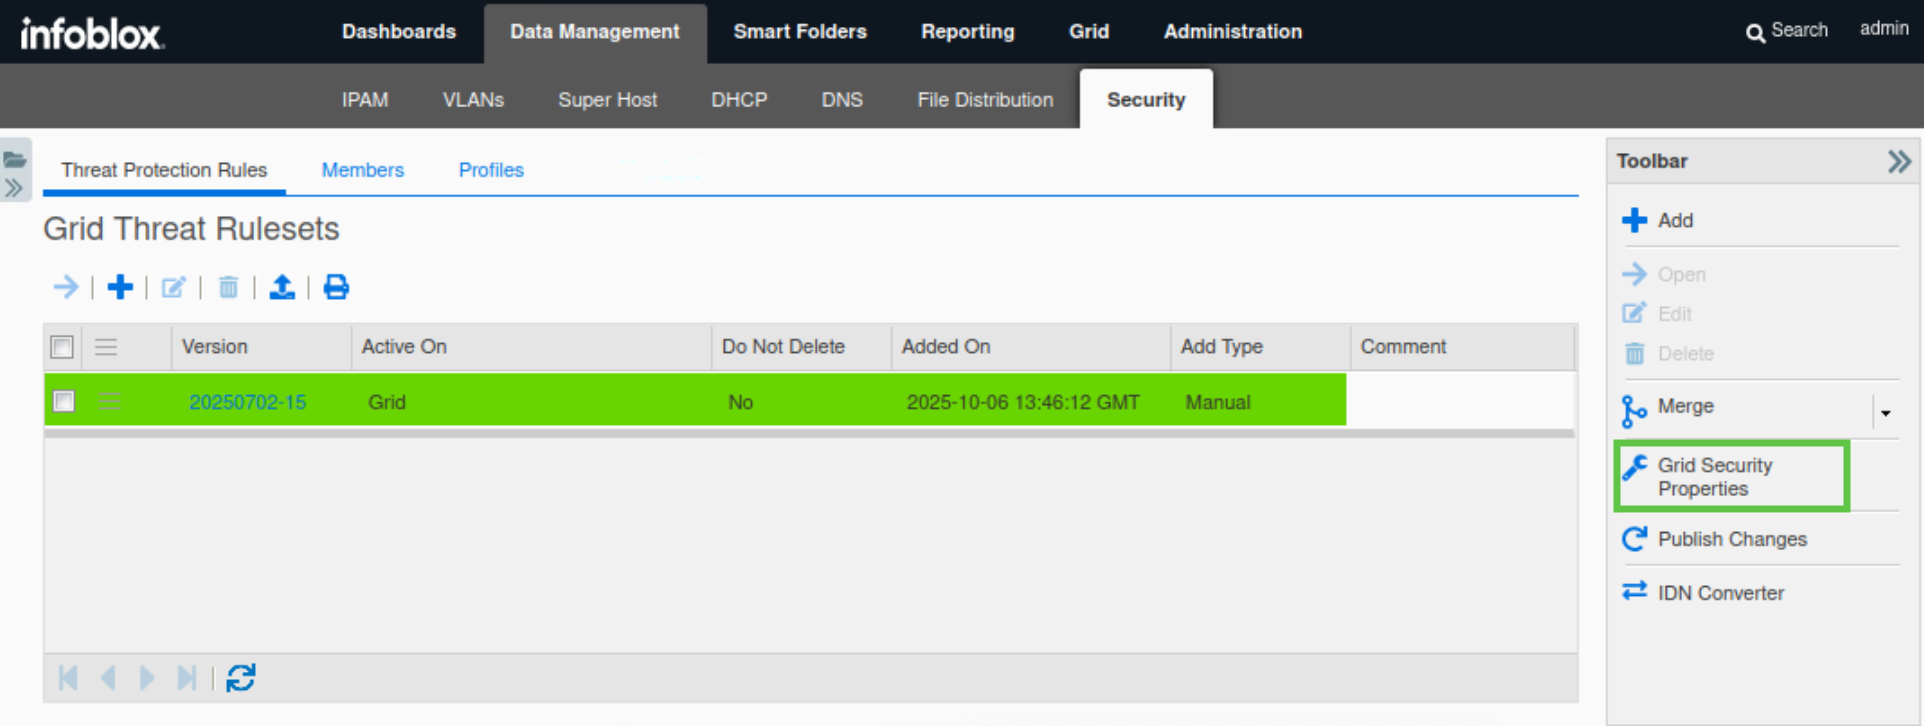
-
Under Threat Protection → Basic, Set the Rule Update Policy to Manual.
-
Select the checkbox next to Enable Automatic Ruleset Downloads.
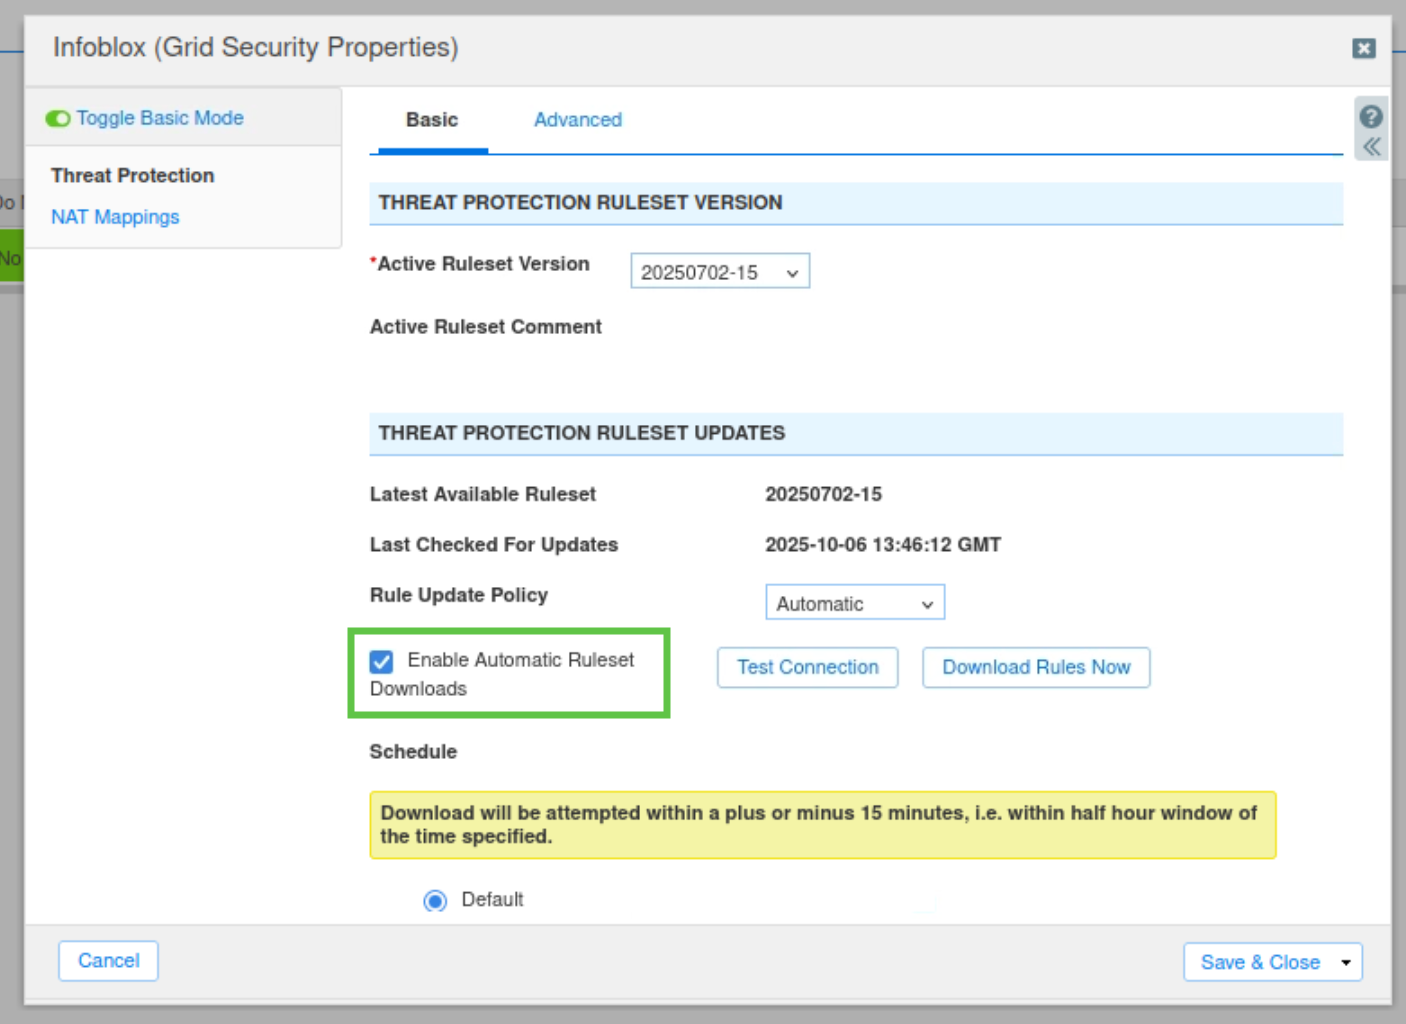
-
Click Test Connection. When the test is successful, a blue banner displays at the top of the current window. Ensure the connection works.
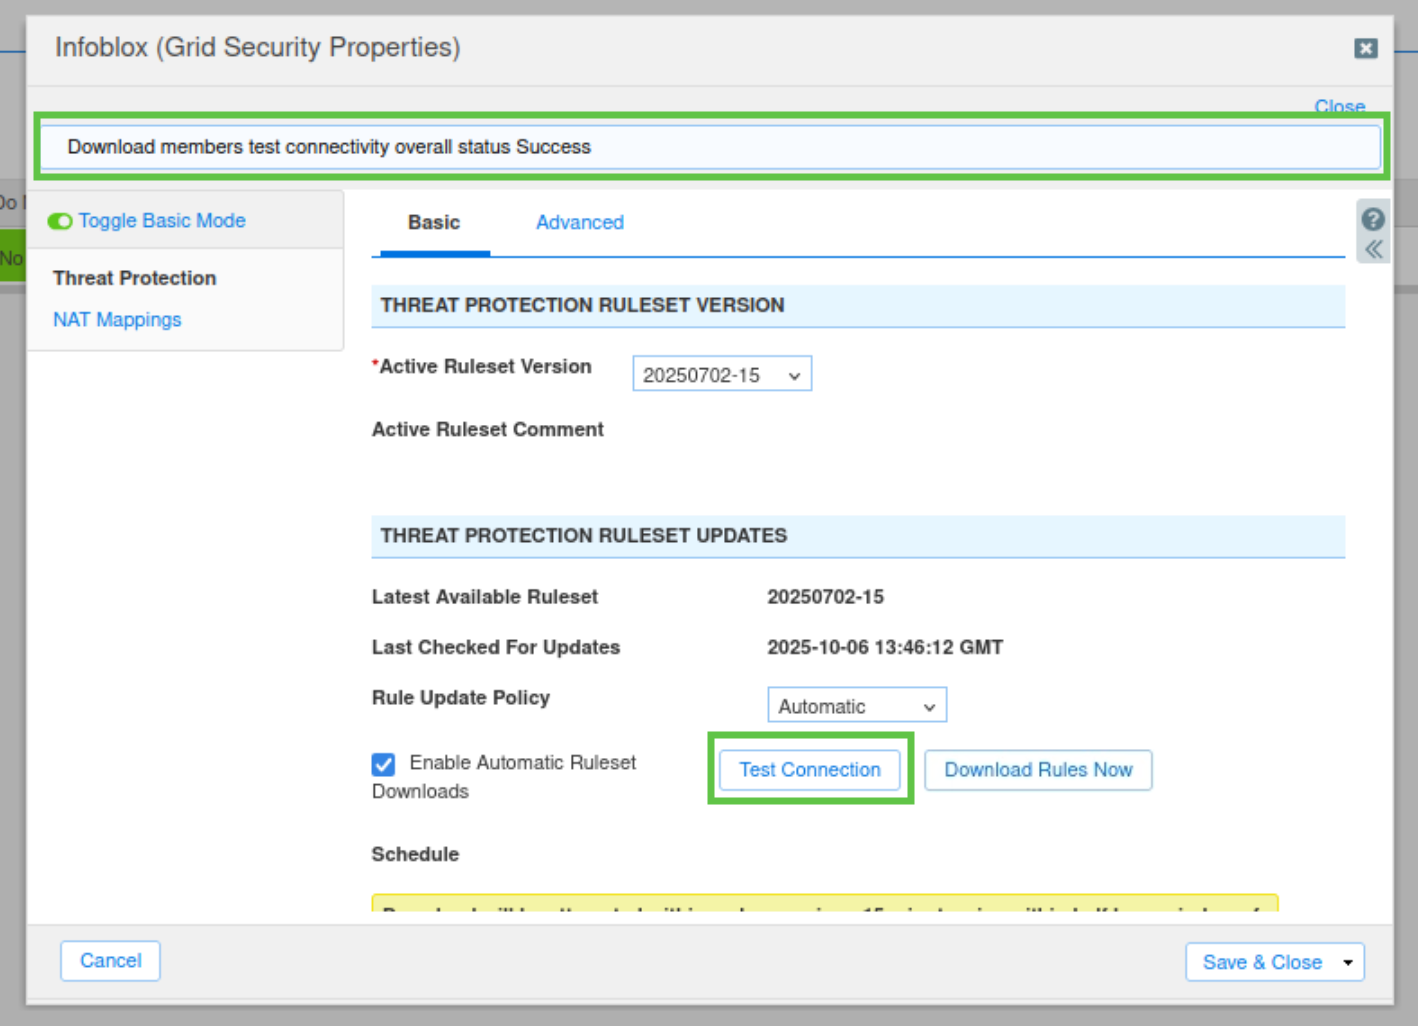
-
Click Download Rules Now.
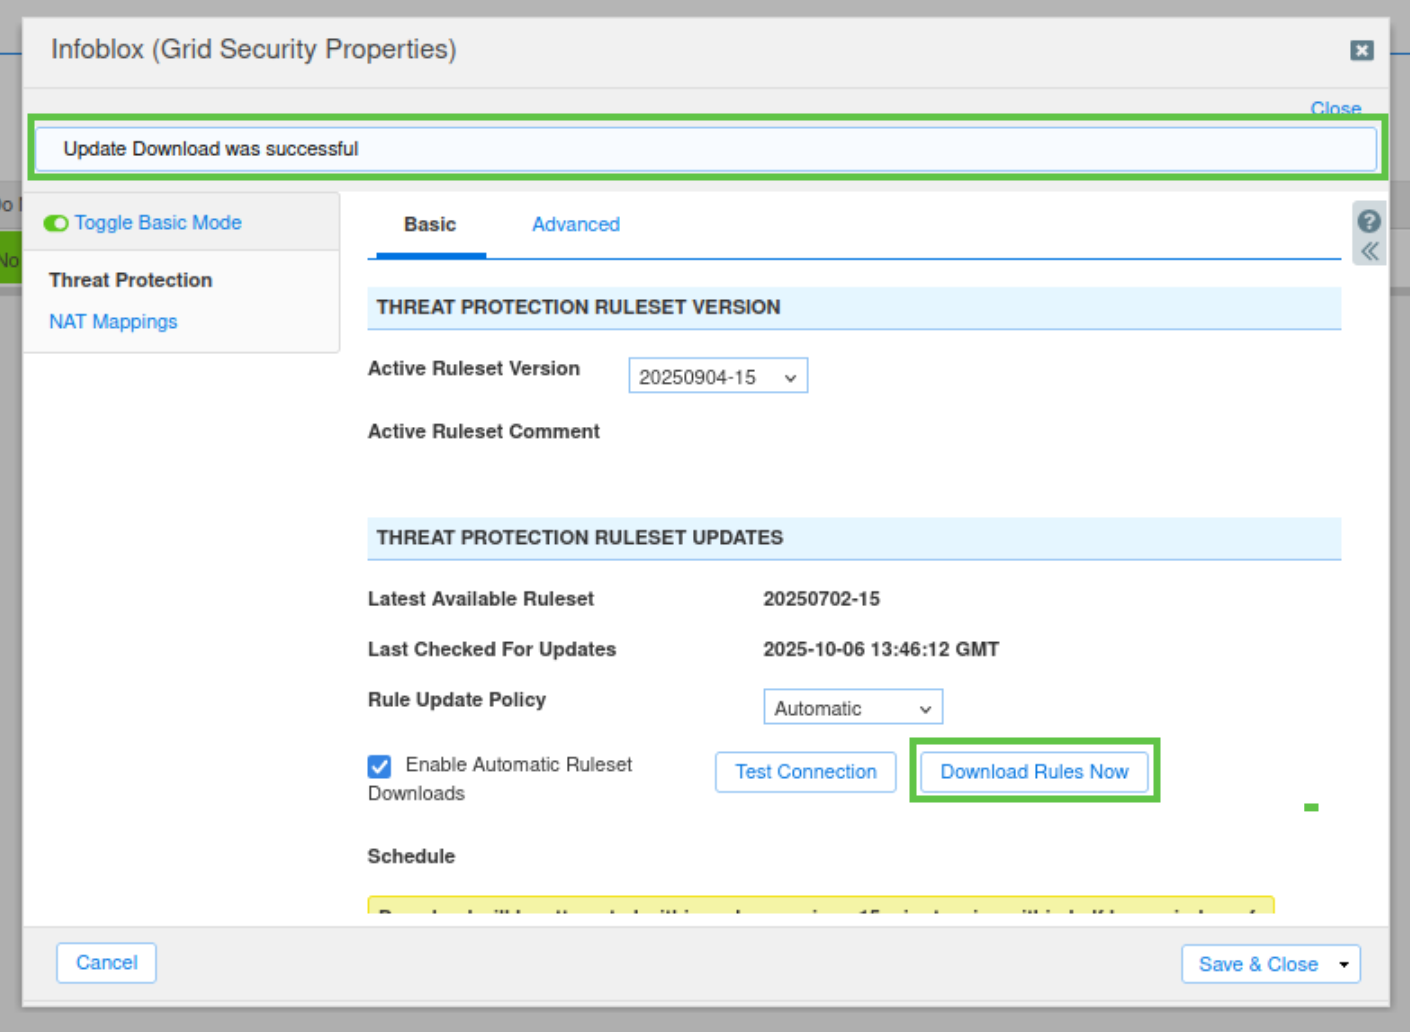
-
Click Save & Close and confirm you wish to close the Infoblox (Grid Security Properties) window.
-
There should be two rule sets.
-
Click the hamburger icon next to the OLD ruleset and select Activate.
-
Verify that the OLD ruleset is still active – do not activate the new ruleset yet.
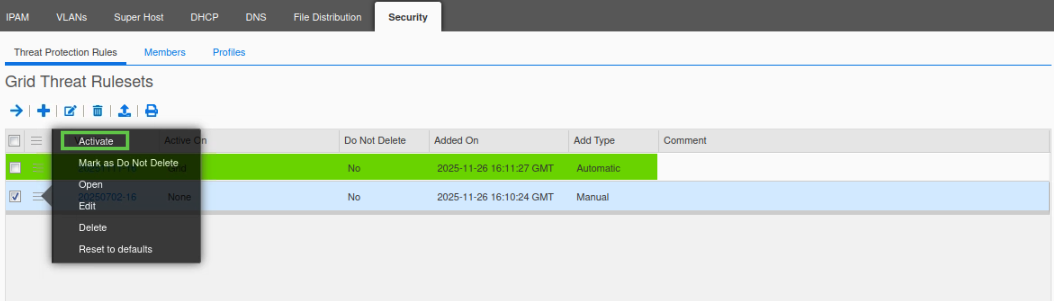
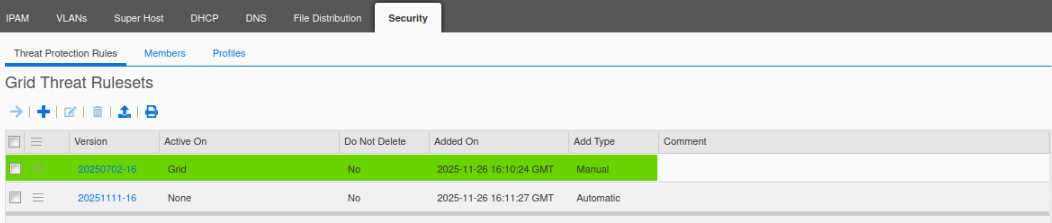
-
If the new ruleset is active, you will need to manually activate the old ruleset.
-
Verify the update configuration to ensure that Rule Update Policy is set to Manual (as per the instructions above).
-
Click on the hamburger icon next to the old ruleset and select Activate from the menu.
-
-
Task 10 Solution: Configure and Enable the Threat Protection (ADP) Service
The best practice is to always run ADP in monitor mode for at least a week to establish traffic patterns.
In this task, we configure the Threat Protection service to use monitor mode. This enables us to check that the service is configured correctly and that there are no unintended effects on the network traffic.
-
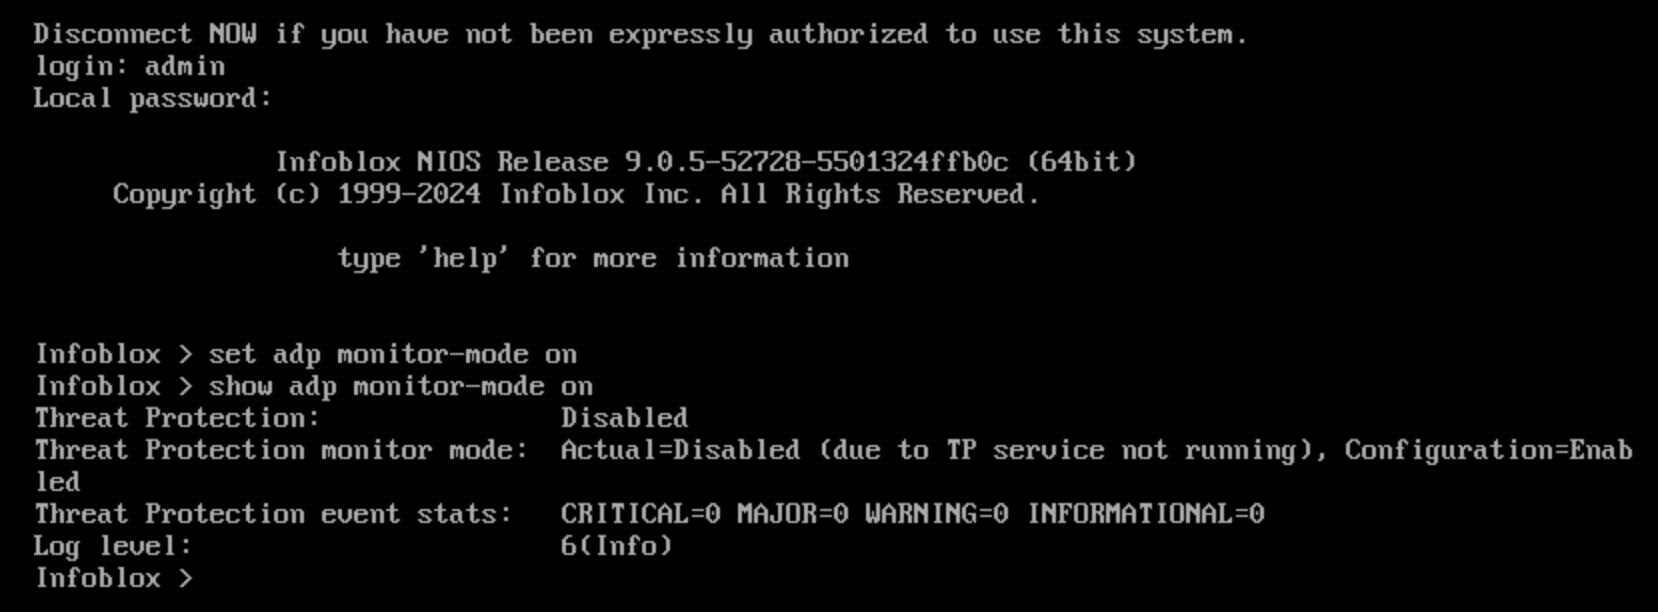
Switch to nios-4 VM to access its console.
-
Log in using the default username admin, default password infoblox.
-
Issue the
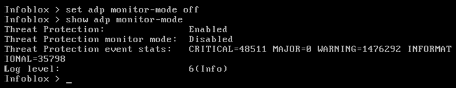
set adp monitor-mode oncommand.-
This command will switch the ADP service mode on extibns.techbue.net to monitor mode.
-
-
Issue the
show adp monitor-modecommand.-
You should see that monitor mode is enabled, but the Threat Protection service is disabled.
-
Task 11 Solution: Start the Threat Protection Service
It can take up to 5 minutes for the Threat Protection service to start
-
Switch back to jump-desktop.
-
Navigate to Data Management → Security → Members.
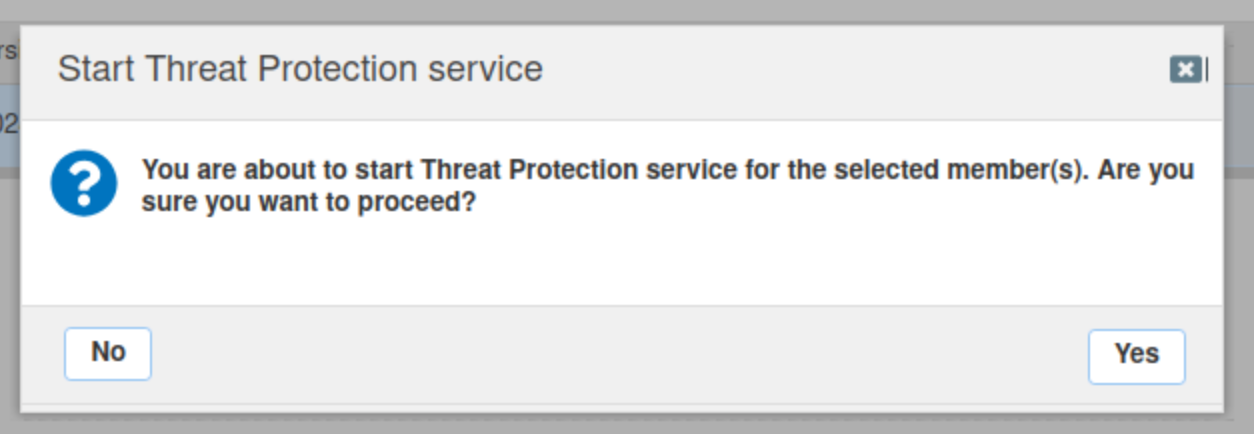
-
Select extibns.techblue.net and click Start in the Toolbar.
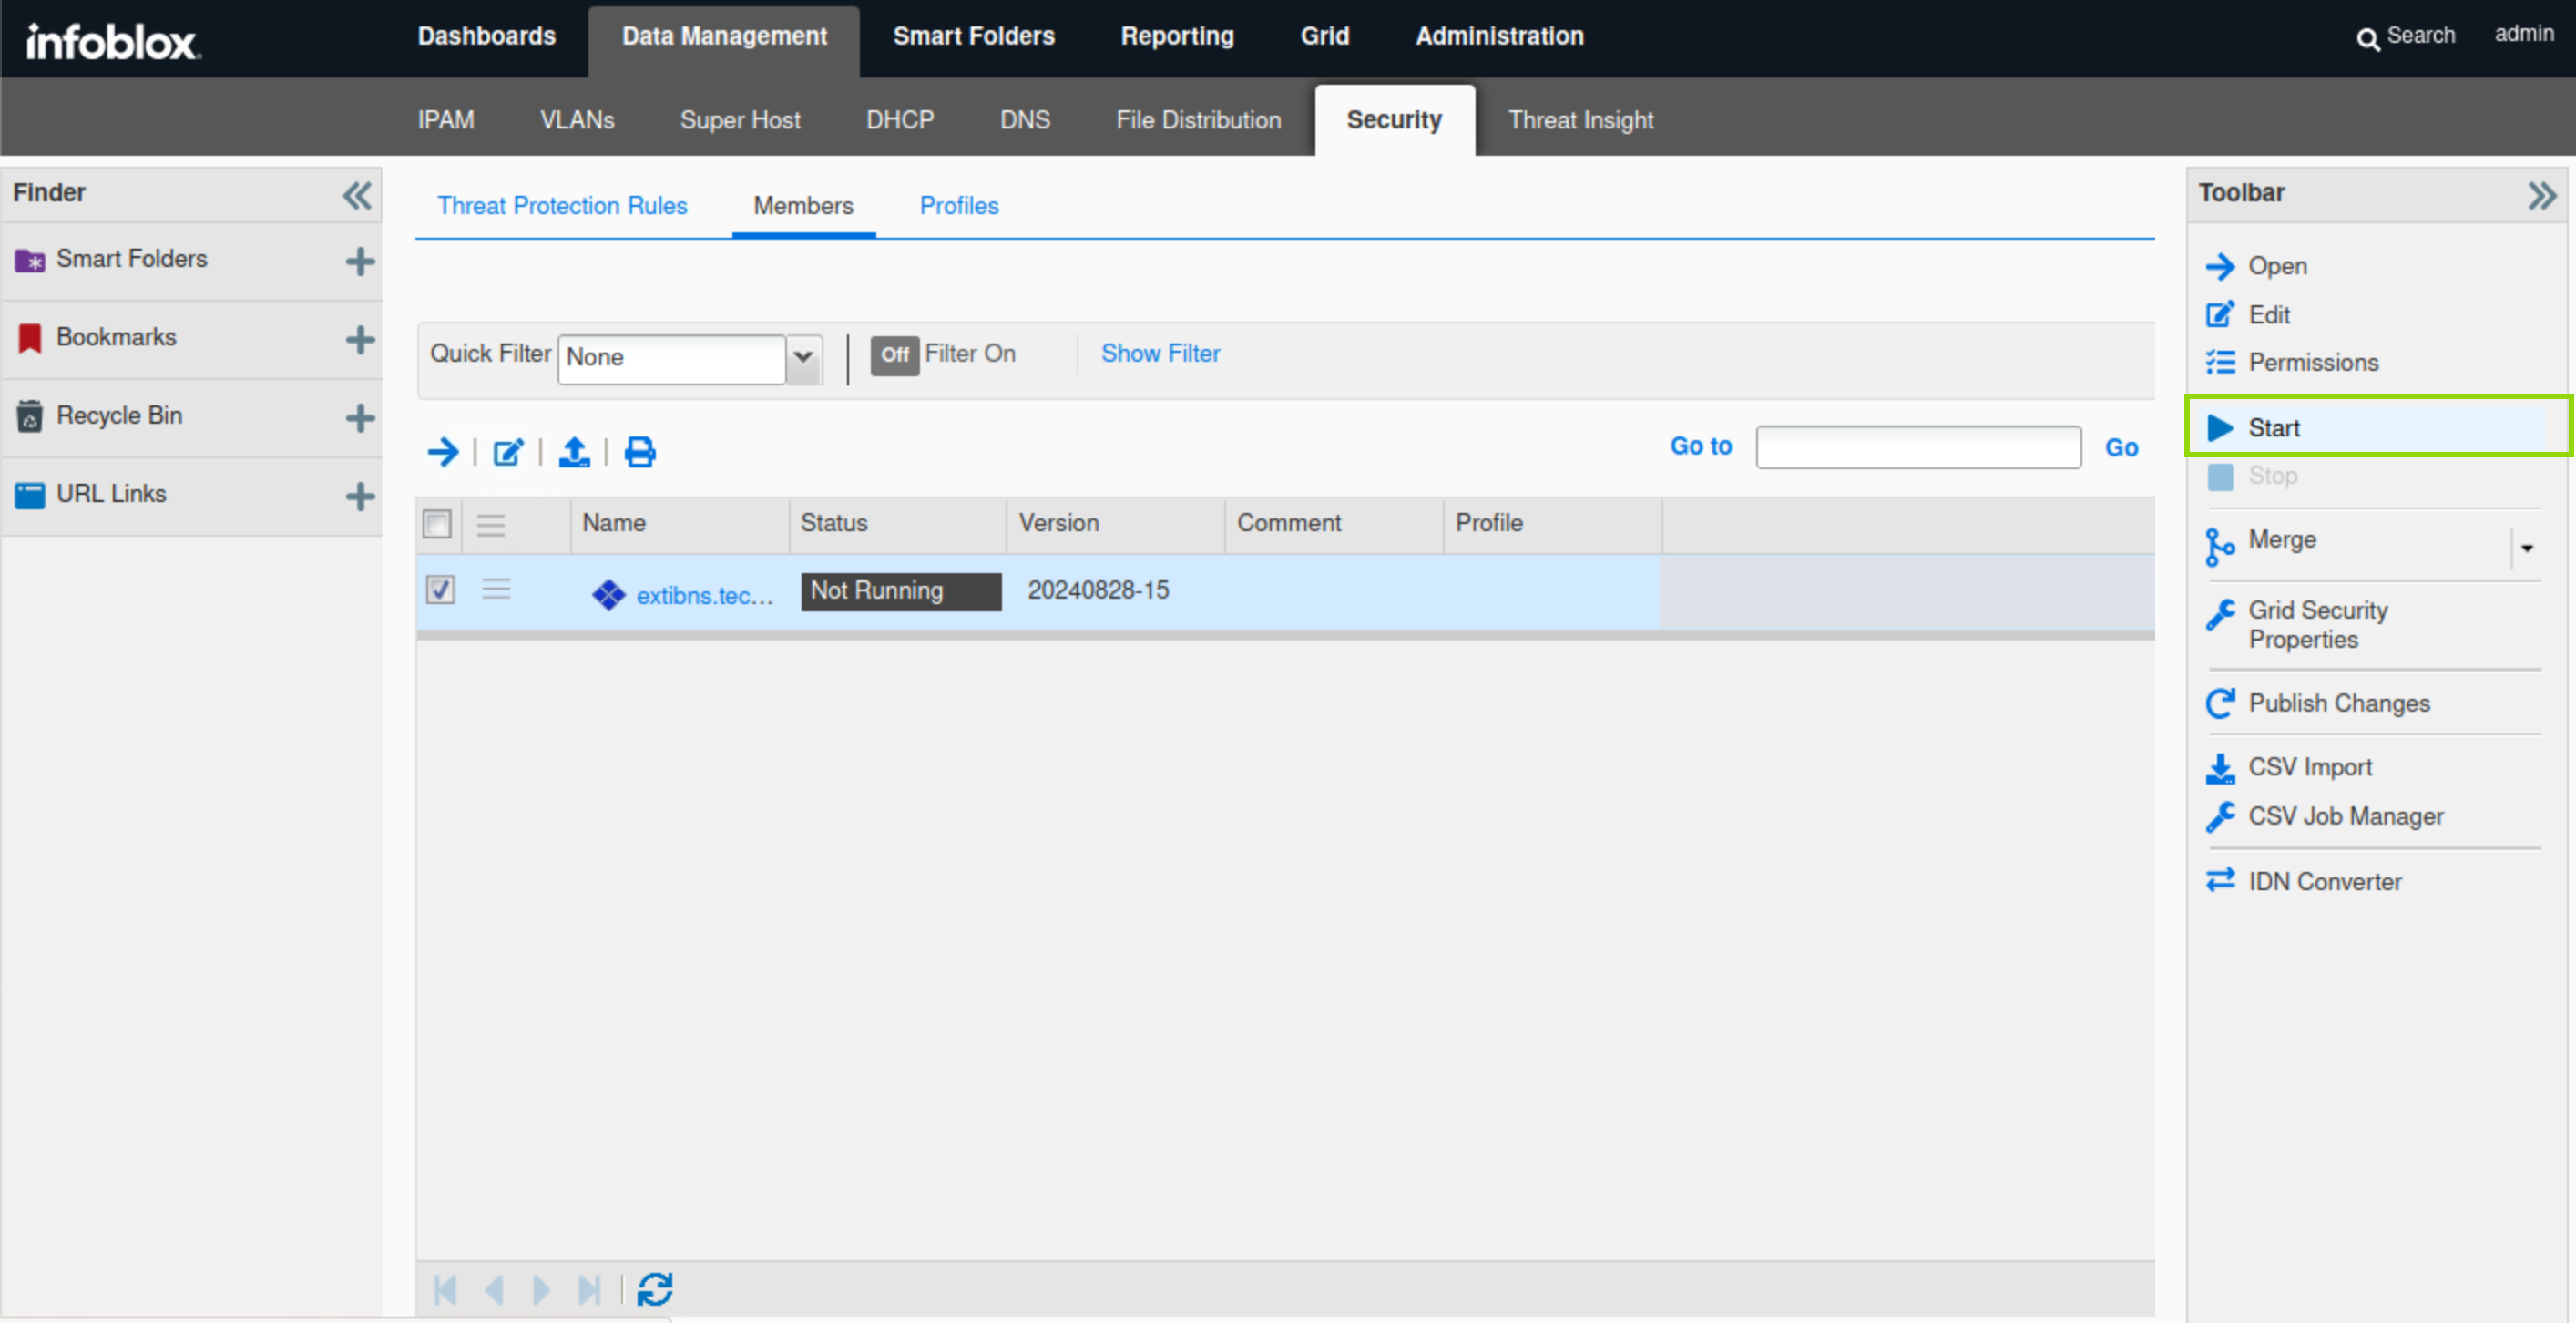
-
Click Yes to confirm starting the service.
-
Restart Services if prompted.
-
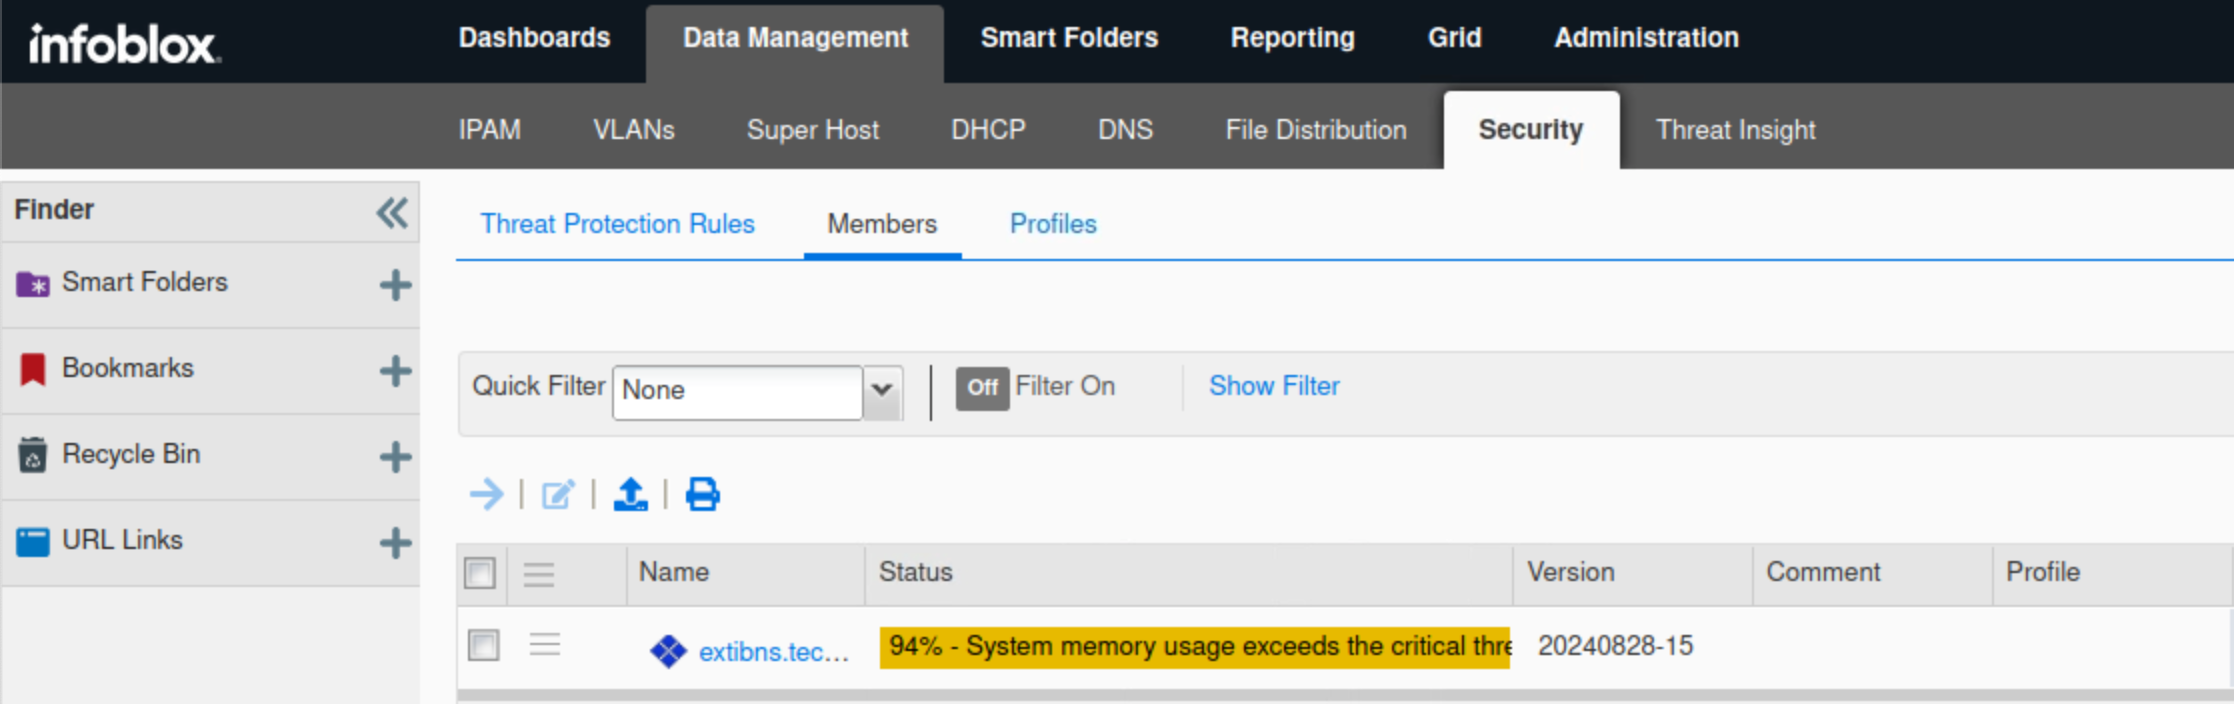
Refresh the page to view the latest status for extibns.techblue.net.
-
The status is in yellow, because extibns.techblue.net is in monitoring mode.
-
Task 12 Solution: Create a Threat Protection Profile
-
On the jump-desktop machine, open a browser window and surf https://10.100.0.100.
-
Navigate to Data Management → Security → Profiles.
-
Click the plus (+) symbol to add a new profile.
-
Create a new profile named External - Initial Configuration.
-
Click Override next to the Active Ruleset Version and select the oldest ruleset 20250702-15.
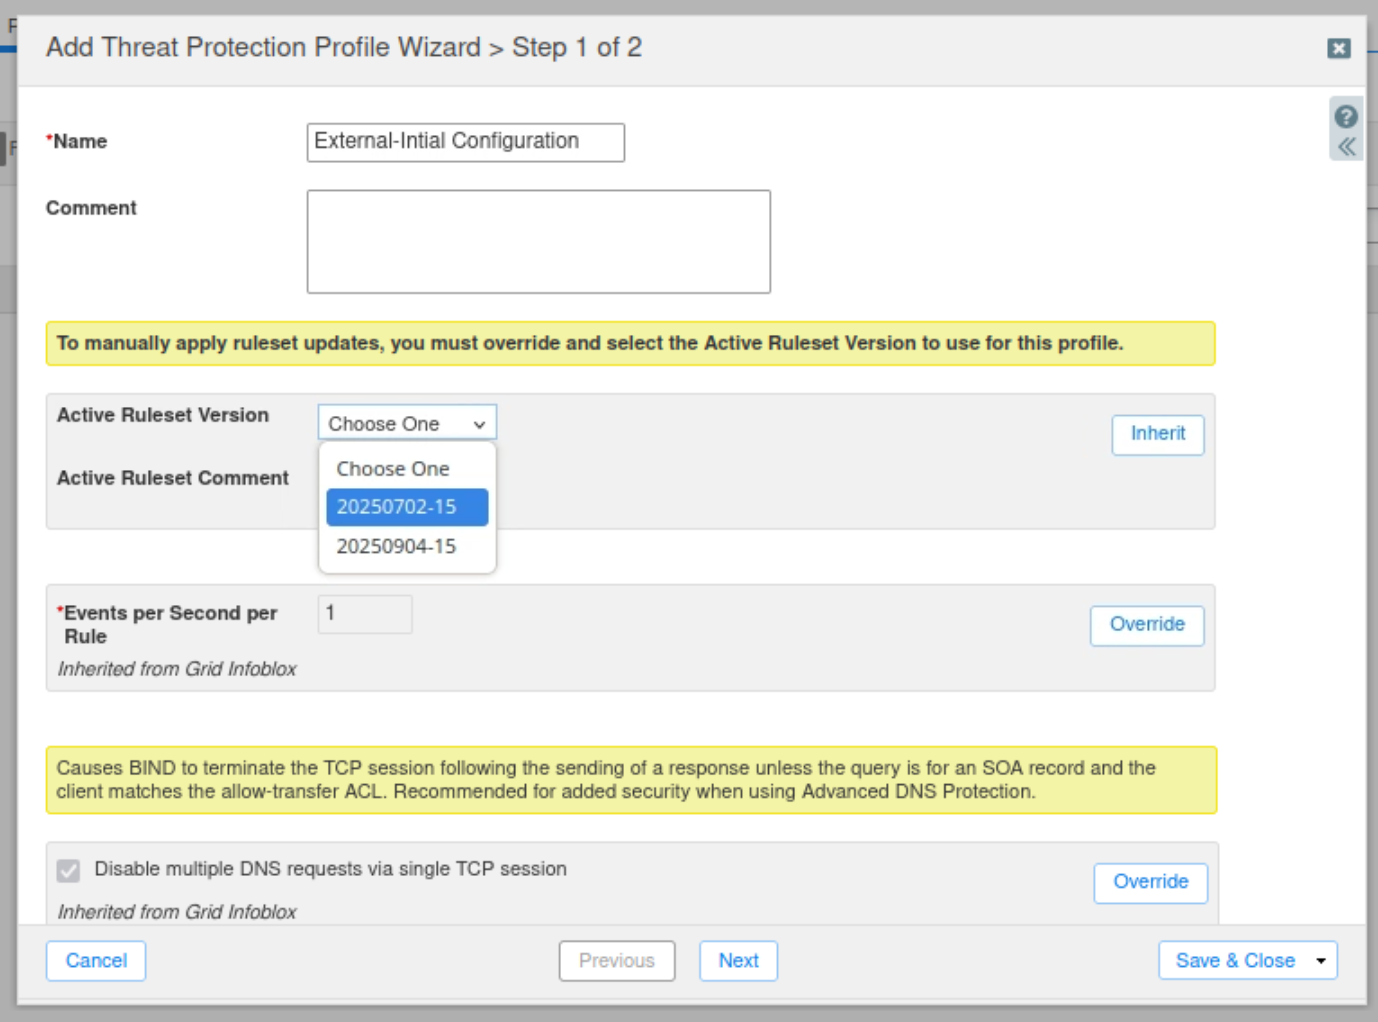
-
Click Save & Close.
Task 13 Solution: Assign Profile to Grid Member
-
Navigate to Data Management → Security → Members.
-
Select the extibns.techblue.net member and click Edit.
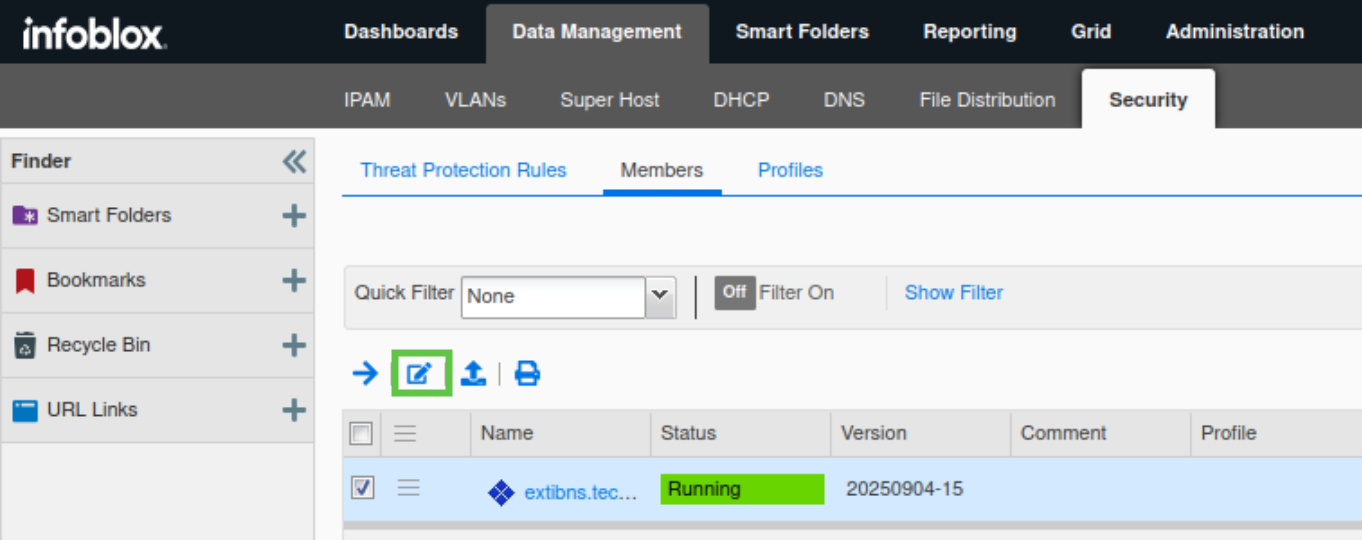
-
Under the Basic tab of the Threat Protection section.
-
Select the Use profile radio button.
-
Click "Select Profile" and select the "External - Initial Configuration" profile.
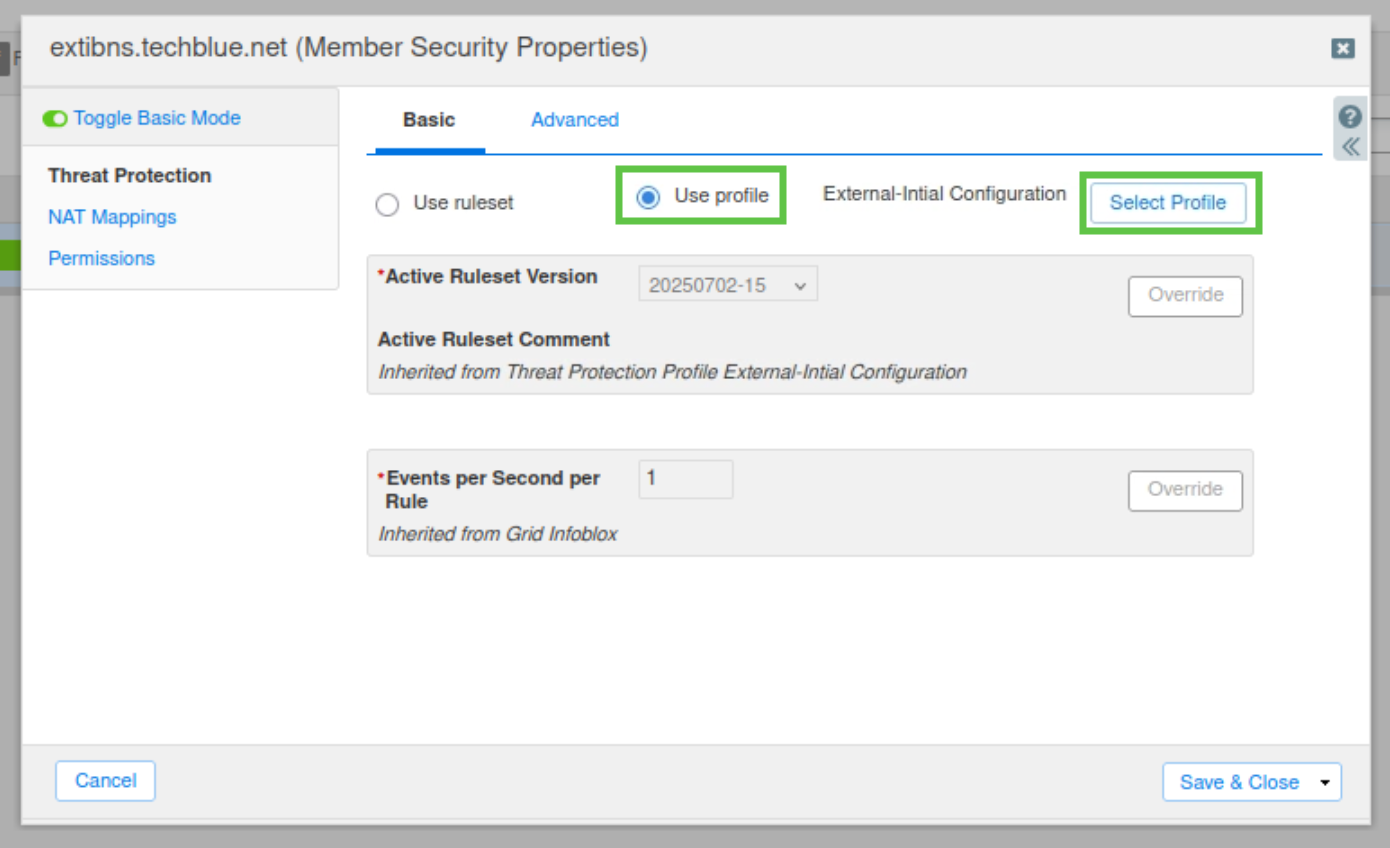
-
Click Save & Close to save the profile setting.
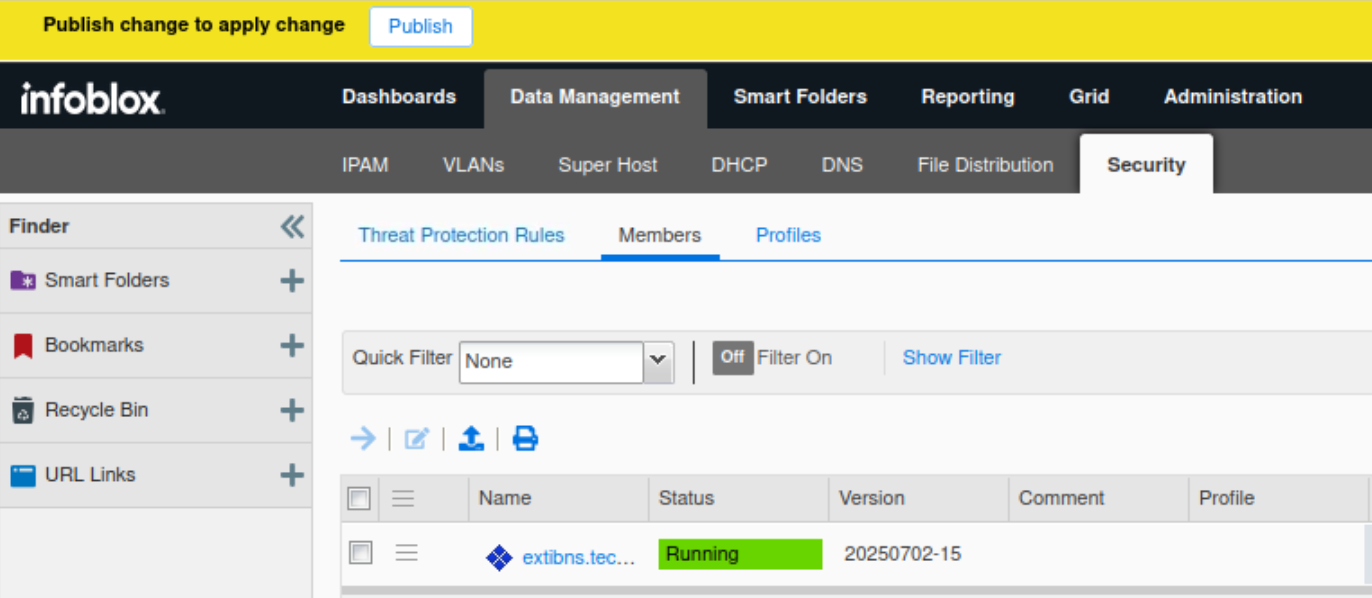
-
Publish changes when prompted.
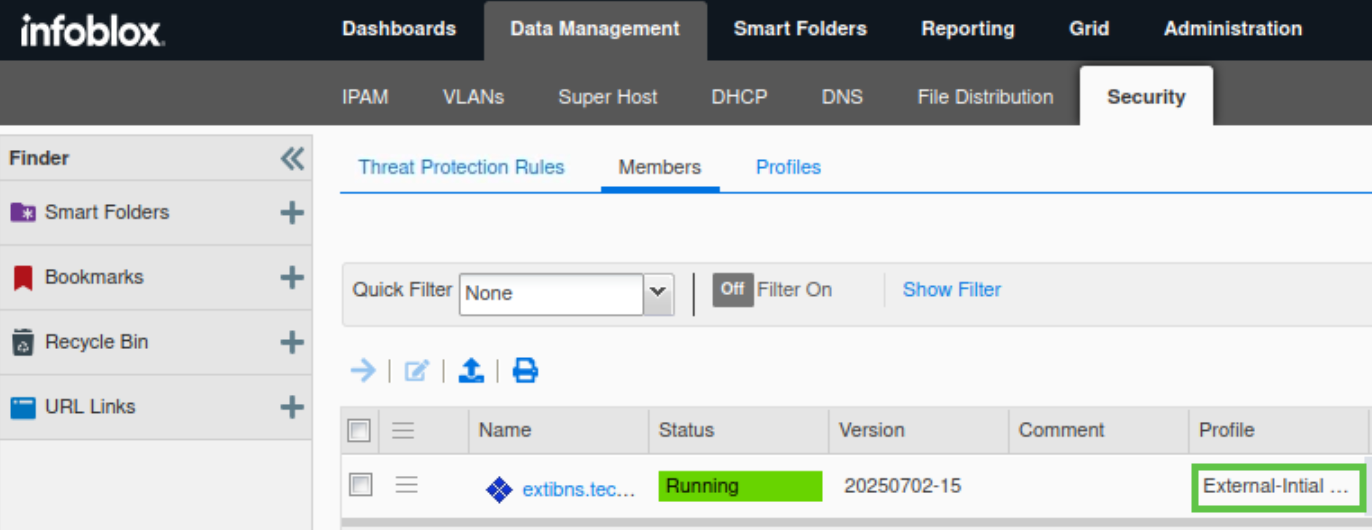
-
The External - Initial Configuration profile is listed for extibns.techblue.net
Task 14 Solution: Identify Outliers
The Grid will require 30 to 35 minutes to fully load and be ready for tuning.
Please note that your report data might not exactly match the screenshots and answers provided
In this task, use the Reporting Server dashboards to identify noisy clients. You will observe QPS (Query Rate Per Second) for the past 1-2 hours.
-
Navigate to Reporting → Dashboards.
-
Select the DNS Top Clients dashboard and observe that there are four clients with significantly higher numbers of queries than the majority of clients.
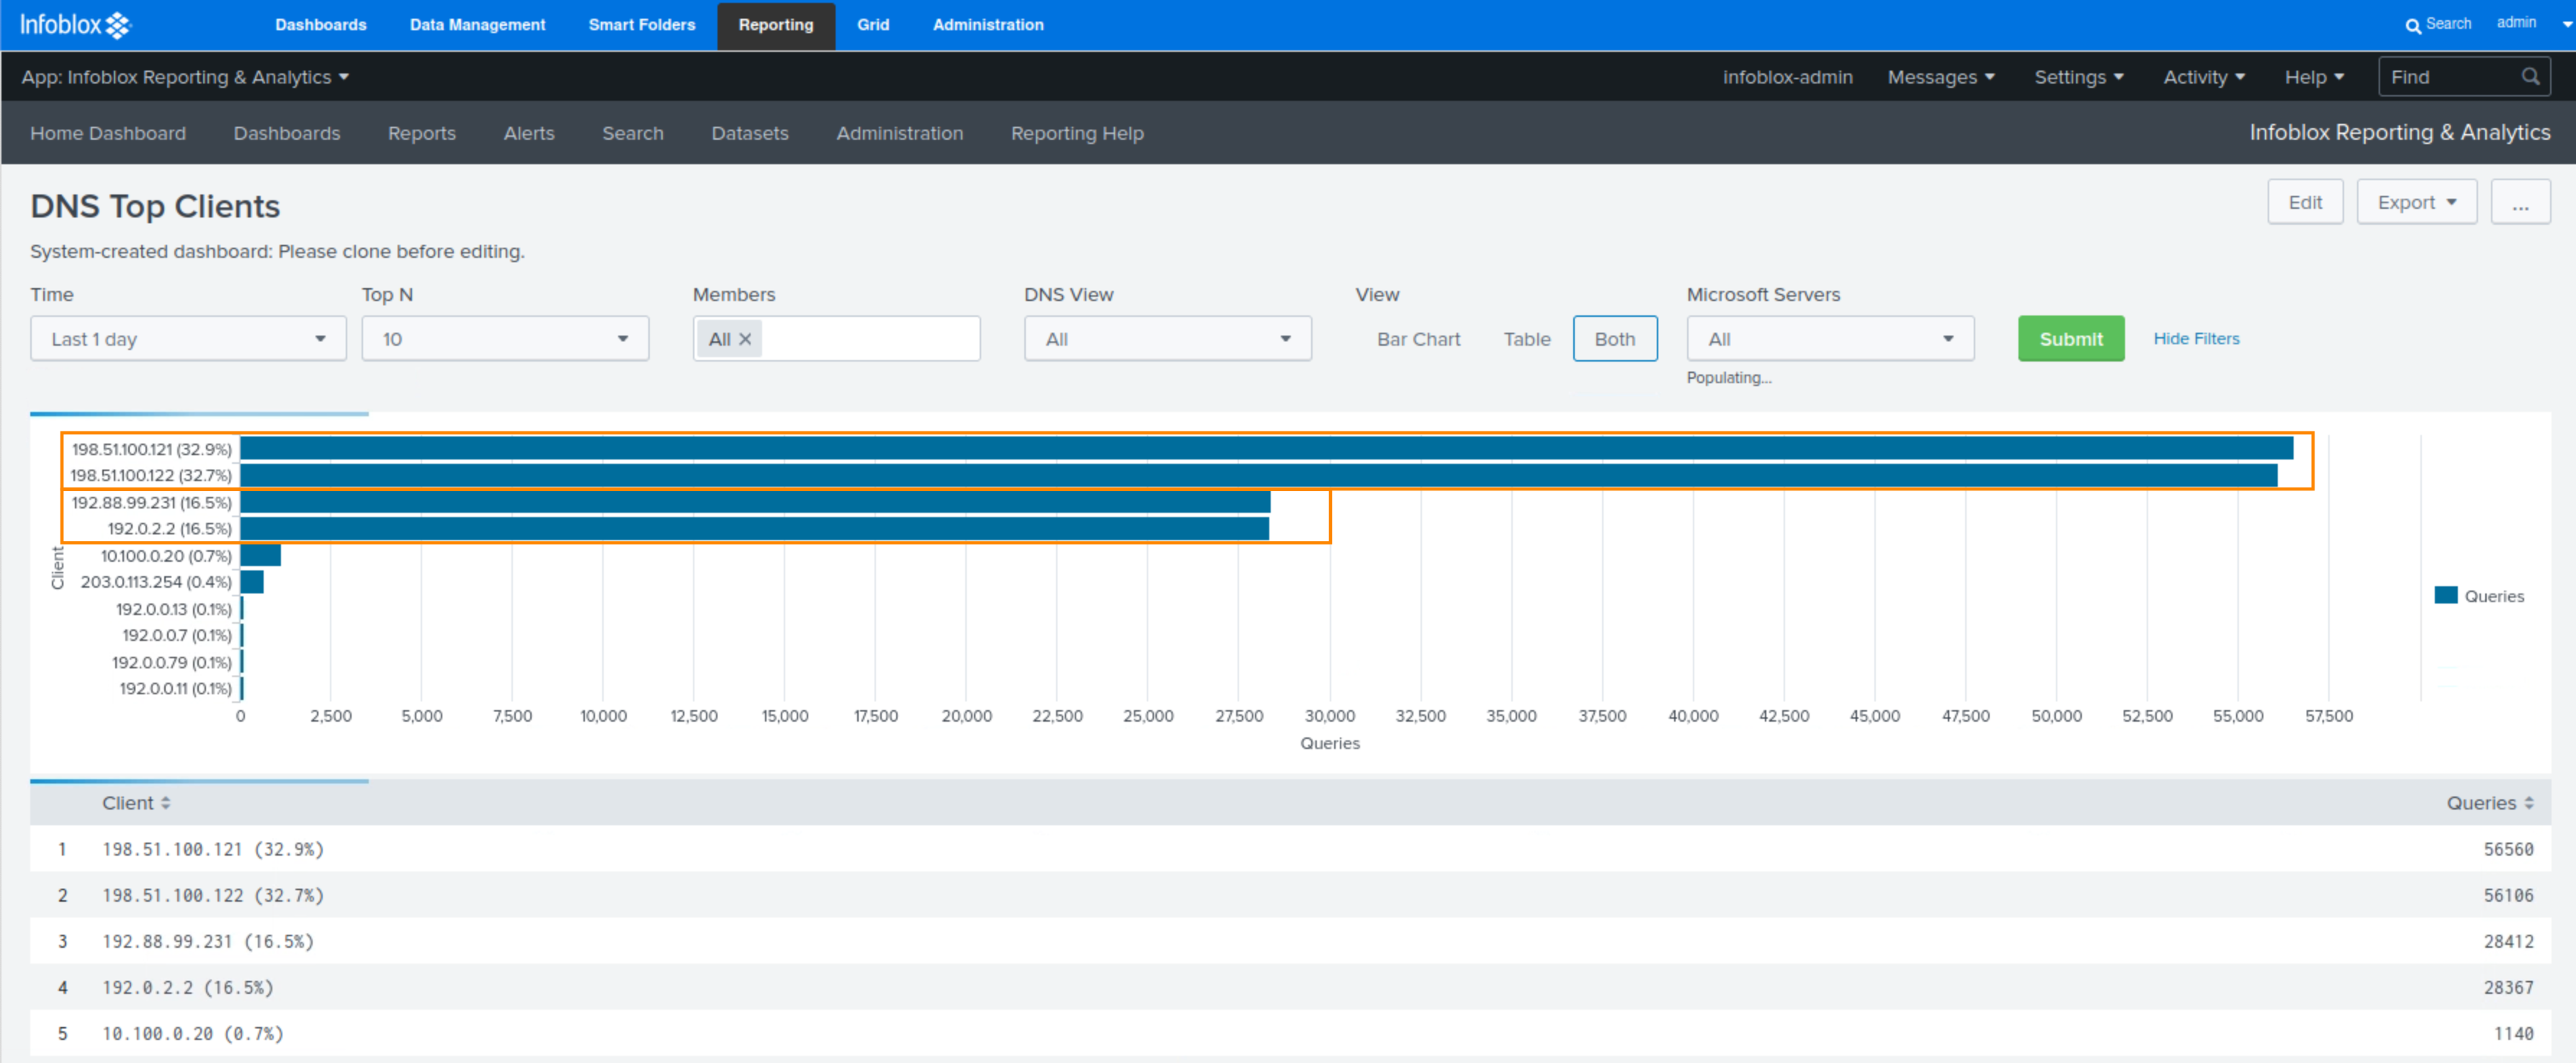
-
The Client IP addresses are 198.51.100.121, 198.51.100.122, 192.88.99.231, and 192.0.2.2. These hosts require further investigation.
-
The investigation establishes that:
-
Hosts 192.0.2.2 and 192.88.99.231 belong to local companies with which our organization does business. The hosts are using NAT, and a large number of clients are behind those two IP addresses, accessing our services. As a result, we expect these hosts to make a higher-than-average number of queries.
-
Hosts 198.51.100.121 and 198.51.100.122 are the local ISP’s caching servers. They provide services to both home and business broadband users. As a result, they are also expected to make a higher-than-average number of queries.
-
Task 15 Solution: Establish a Baseline
In this task, you establish a baseline. You need to establish the normal rate of DNS queries per second to tune ADP accordingly.
In a production environment, you would use the DNS Daily Peak Hour Query rate by Member dashboard to determine peak values when establishing a baseline. However, in a lab environment, you do not have sufficient simulated data to obtain this report.
As this is a lab environment, the value is very low. Infoblox DNS servers can easily handle thousands of queries per second.
For the purposes of this lab and testing, we will use higher values so you can see what happens when rules are triggered.
If you are unsure about how to tune your production ADP-protected DNS appliances, we recommend engaging Infoblox Professional Services.
-
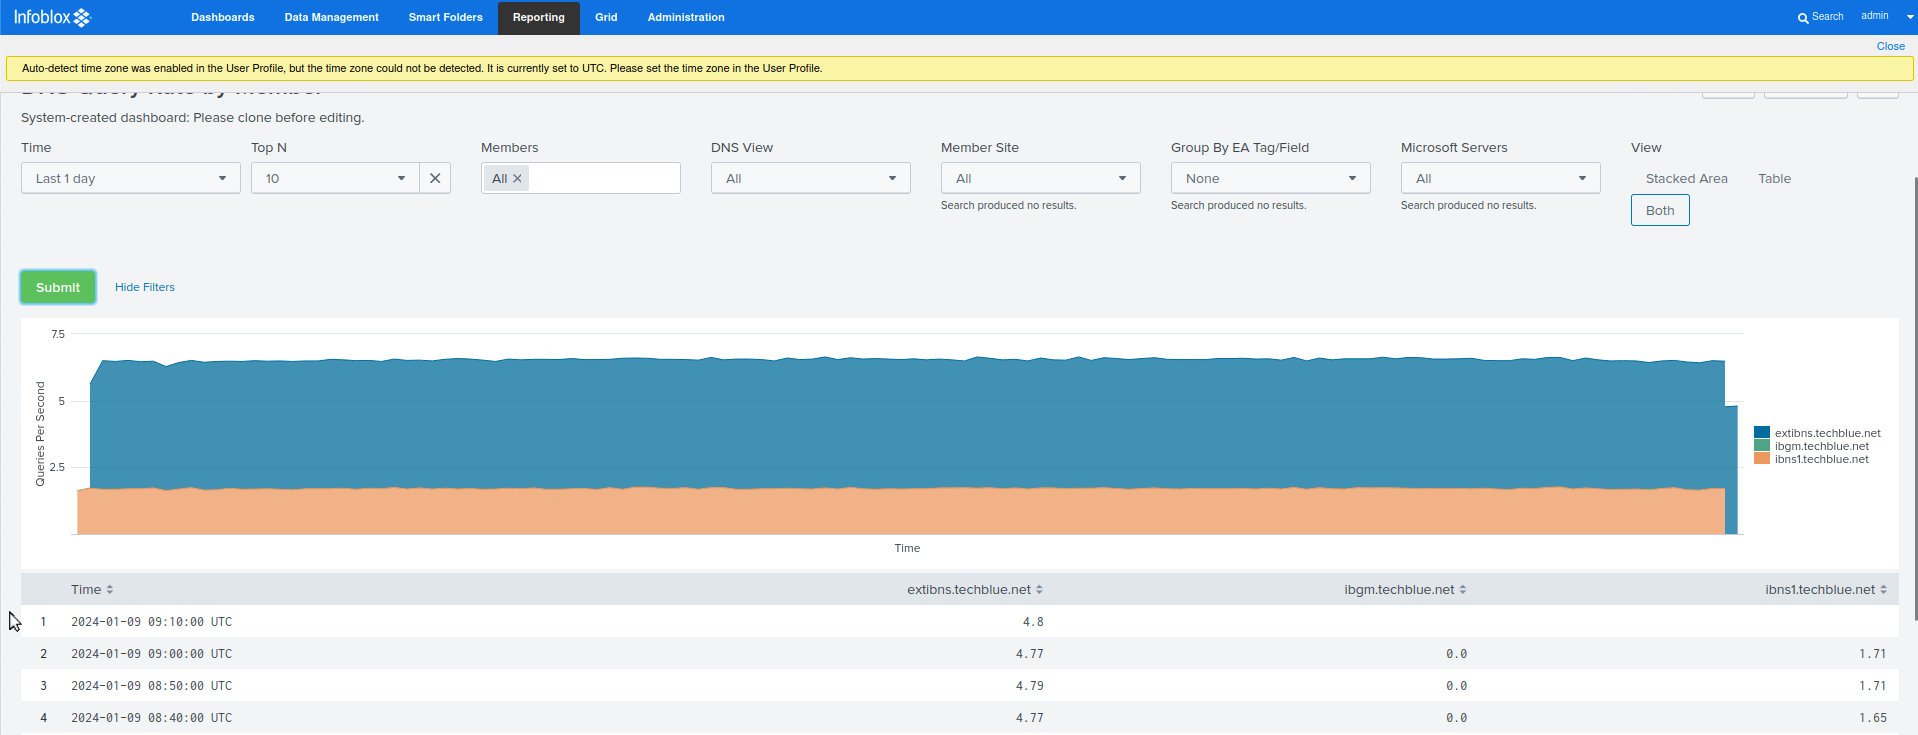
Navigate to Reporting → Home Dashboard
-
Click on the Hourly Grid-wide QPS widget. Alternatively, you can select the DNS Query Rate By Member dashboard using the search bar under the Dashboards tab.
-
The graph shows us the trend for our DNS Queries Per Second. We are now in a position to say that our normal QPS is approximately 6.5 queries per second.
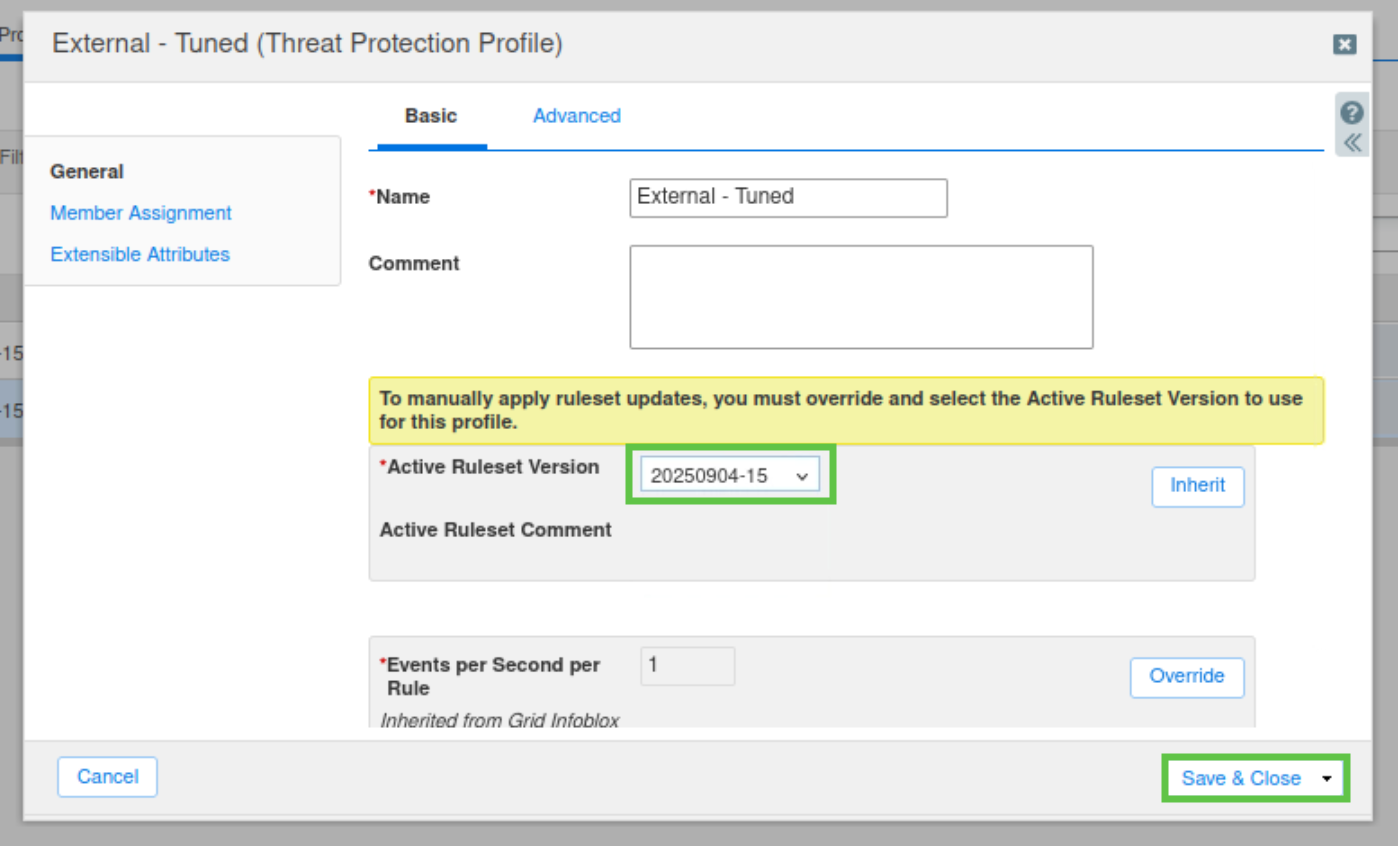
Task 16 Solution: Create a Profile for Tuned Rulesets
In this task, you create an additional ADP profile called External - Tuned and assign it to extibns.techblue.net.
-
Navigate to Data Management → Security → Profiles.
-
Click the Add button to create a new profile, and use 'External - Tuned' as the name.
-
Override the Active Ruleset and select the old 20250702-15 ruleset for the new profile we are creating. Then, Save and Close.
-
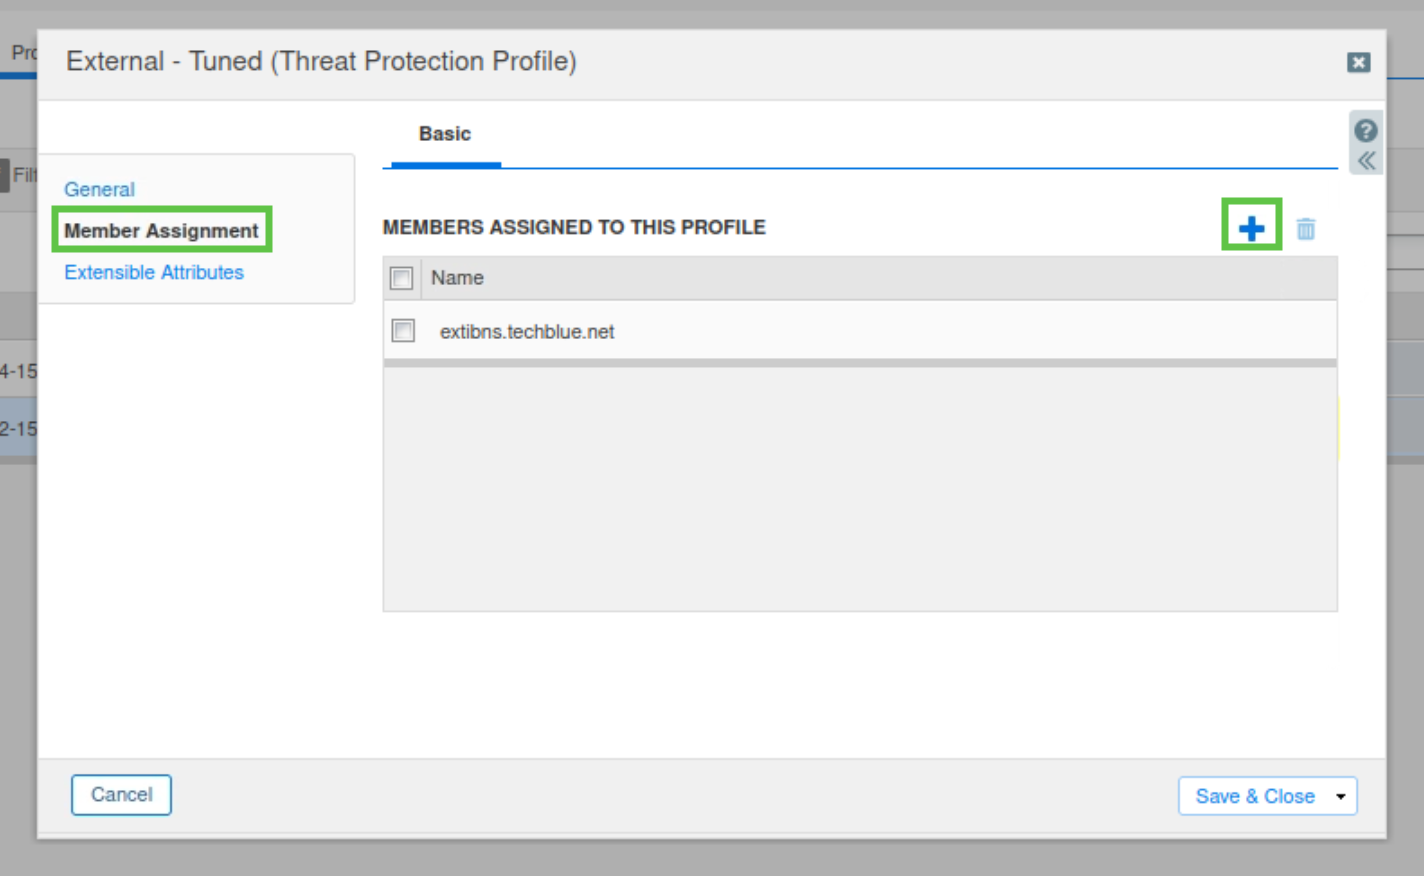
Select the checkbox for the new profile we created, ‘External - Tuned', and then click Edit.
-
Navigate to the Member Assignment tab.
-
Assign the profile to extibns.techblue.net by clicking the + sign on the right-hand side, and click Save & Close.
-
Do NOT click Publish yet. We will have additional changes to make before publishing this update.
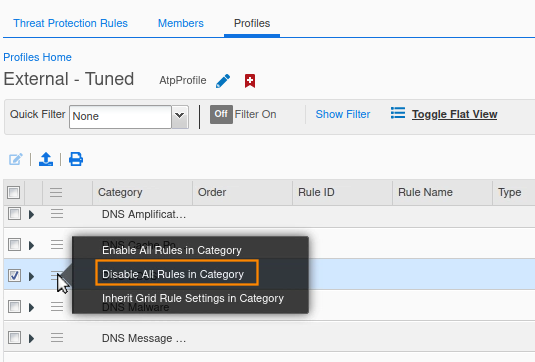
Task 17 Solution: Manage Rule Categories
The new External-Tuned profile is used to customize the Threat Protection services provided by extibns.techblue.net. Grid member extibns.techblue.net is an authoritative-only DNS server. Certain Rule Categories are not required because the server only responds to DNS queries. No DNS traffic is recursed/passed through the server. Disabling categories and rules prevents the ADP engine from having to interrogate against rules that aren’t applicable.
For this reason, we will be disabling the following rule categories:
-
DNS Malware
-
DNS DDoS
-
DNS Tunneling
In this task, we check the status of each category listed. If the category is enabled, then disable it.
-
Navigate to Data Management → Security → Profiles. Click on the link to the External - Tuned profile.
-
Scroll down to the DNS Malware Category. Click the arrow to view the rules in the category. You can see that the rules are enabled.
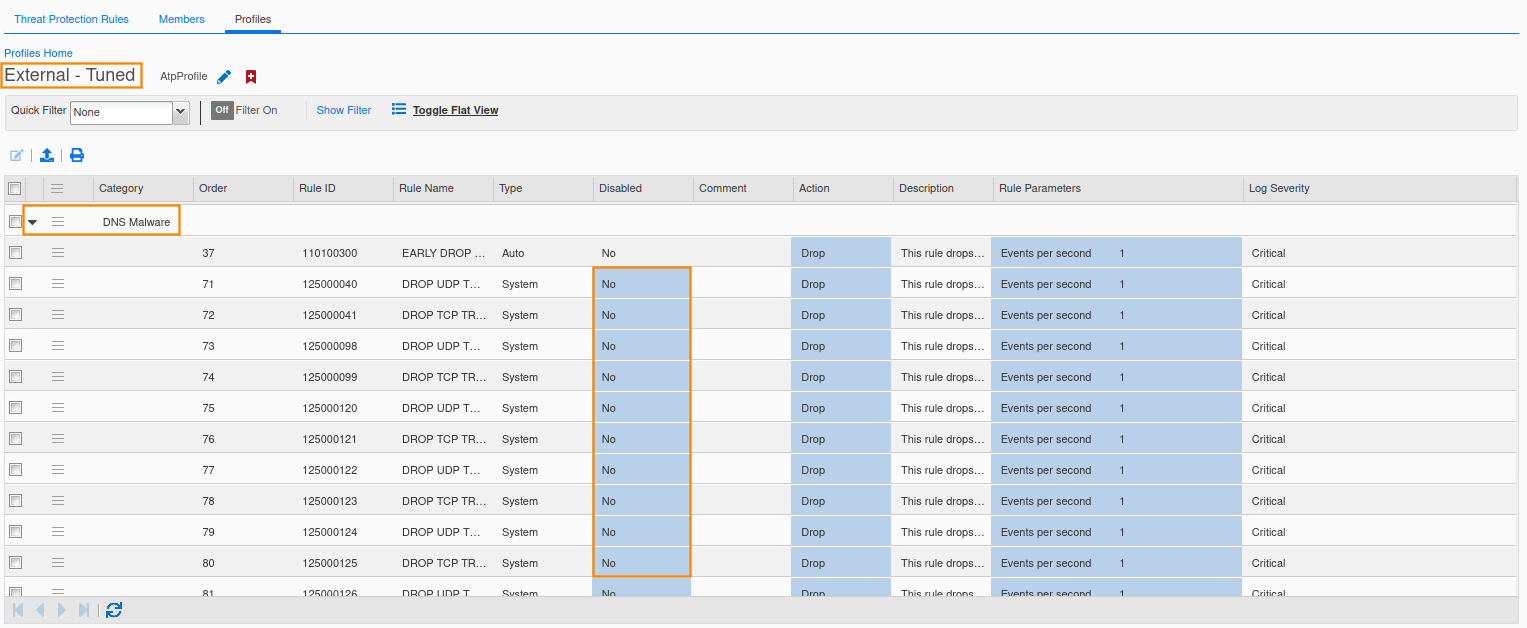
-
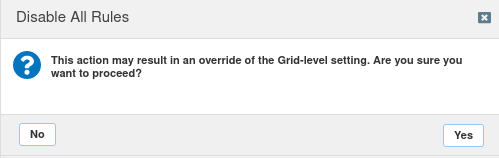
Click the hamburger icon for the DNS Malware category and select the Disable all Rules in Category option.
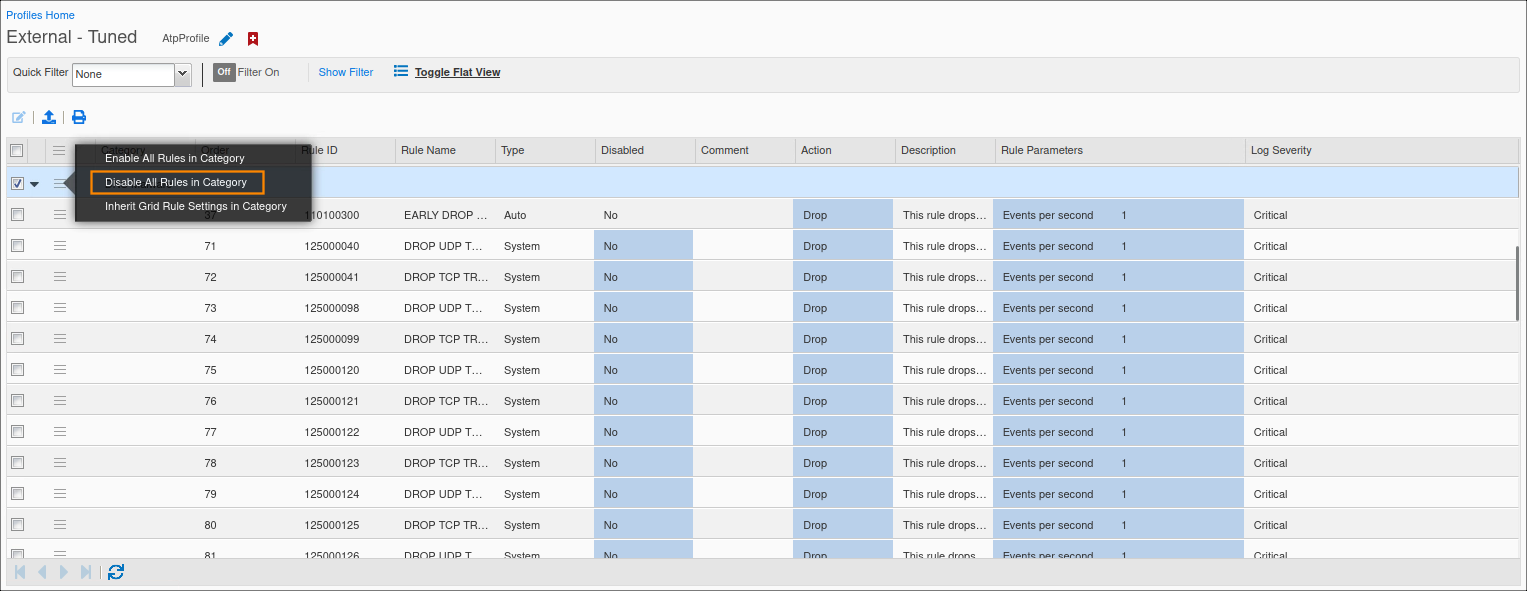
-
Click Yes to proceed.
-
Disable the DNS DDoS and DNS Tunneling categories in the profile by repeating the same steps for each of them. Publish the changes when finished.

Task 18 Solution: Tune Default Rules in the External - Tuned Profile
The values used in this task are specific to the lab and do not reflect the values you should use in a production environment
In this task, you will tune three rules (130000100, 130000200, 100000100) to suit your current lab environment. These rules are intended to protect against TCP and UDP flood attacks.
TCP and UDP flood attacks are volumetric attacks that involve a massive number of packets, consuming network bandwidth and resources. They exploit TCP and UDP.
-
Navigate to Data Management → Security → Profiles.
-
Click Show filter, choose Rule ID as the filter equals as the operator, and the rule ID 130000100 in the last field, and click Apply.
-
Check the Rule and click Edit.
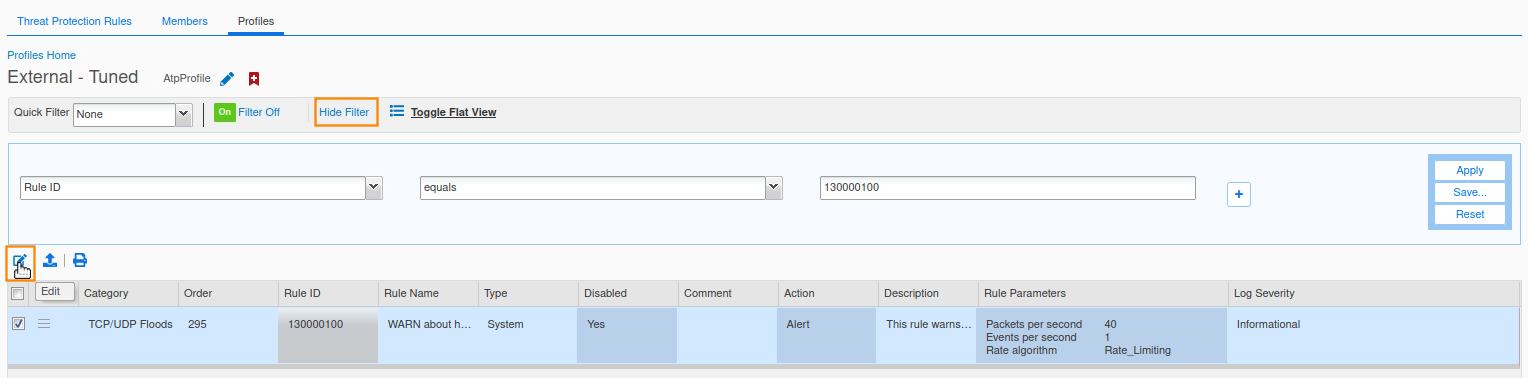
-
Select the Settings tab and click Override.
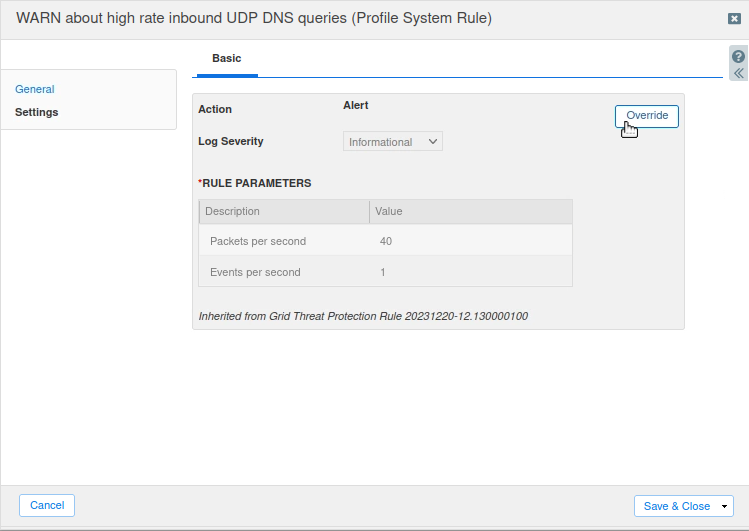
-
Change the Log Severity level to Warning.
-
Change the Packets per Second value to 250 and click Save & Close.
-
Click the hamburger icon next to the rule and select Disable, this will toggle the disable option on.

Now, repeat the steps above to modify Rule ID 130000200, but use the settings listed in Task 7 above. The setting steps follow:
-
Change the Log Severity to Critical.
-
Change the Packets per second value to 500.
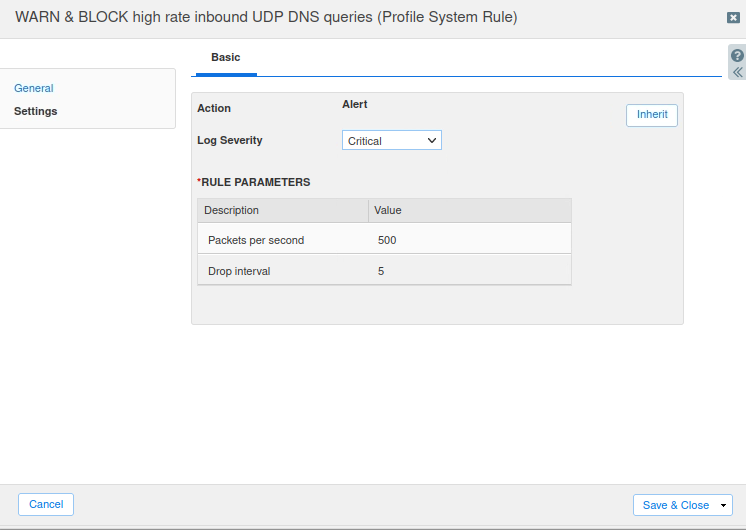
-
Click the hamburger icon next to the rule and select Disable to enable the rule.

Again, repeat the steps above to modify Rule ID 100000100, using the settings listed in Task 7 above. The setting steps follow:
-
Change the Log Severity to Critical.
-
Change the Packets per second value to 15000.
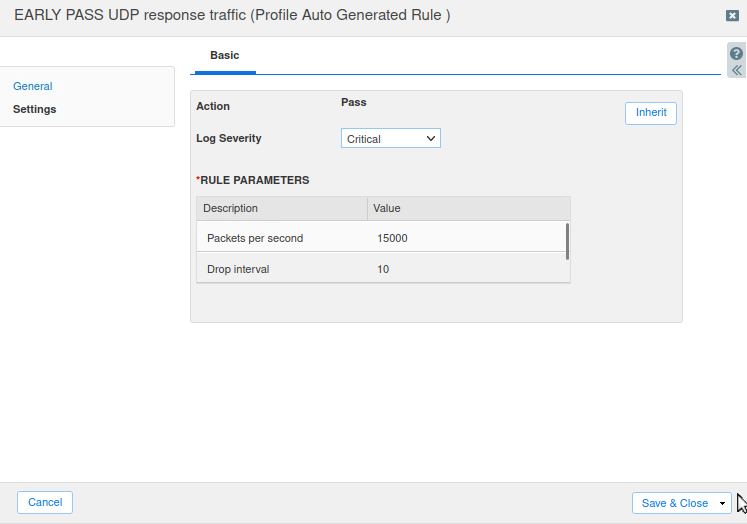
-
This rule should already be enabled.
-
Publish the changes when you’re done.
Task 19 Solution: Test the new Configuration
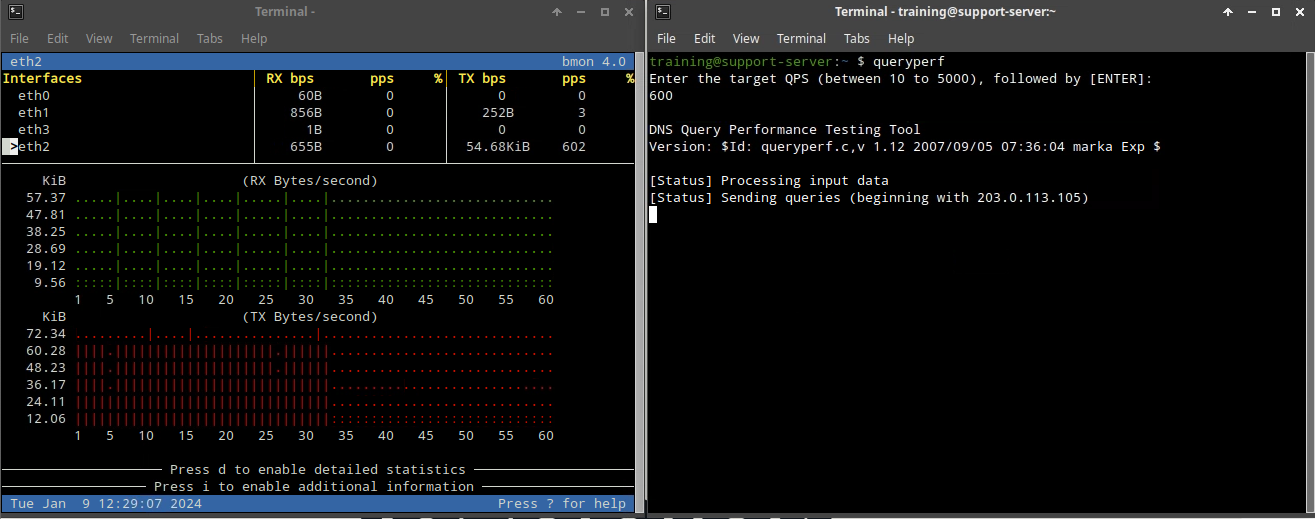
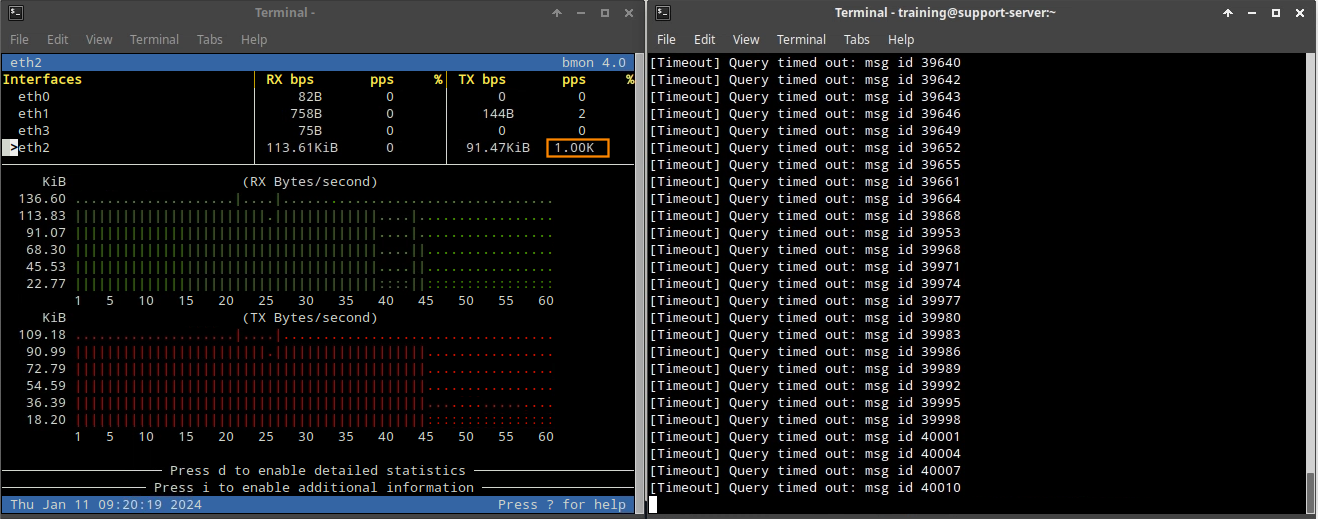
In this task, you test the External Tune Profile, which contains the modified rules. A monitoring tool called bmon is installed on the support-server. The bmon tool is used to monitor traffic on the 203.0.113.0 network as extibns.techblue.net receives DNS queries on this network. Another tool, queryperf, is used to send DNS queries to extibns.techblue.net at the rate you specify.
-
To start testing, log in to the support-server VM (training/infoblox)
-
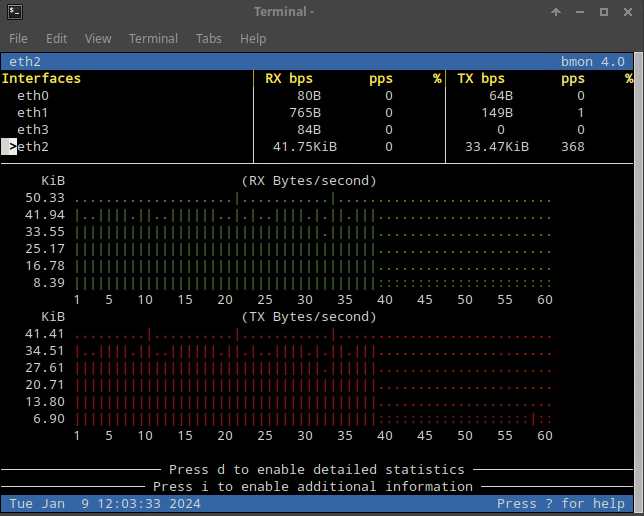
Open a terminal and run the bmon tool. Expand the terminal window to see the colored chart below.
-
Press the down arrow key on your keyboard to select the eth2 interface.
-
This indicates you are monitoring traffic on the eth2 interface. This interface is connected to the 203.0.113.0 network.
-
Open another terminal window.
-
Type the command queryperf.
-
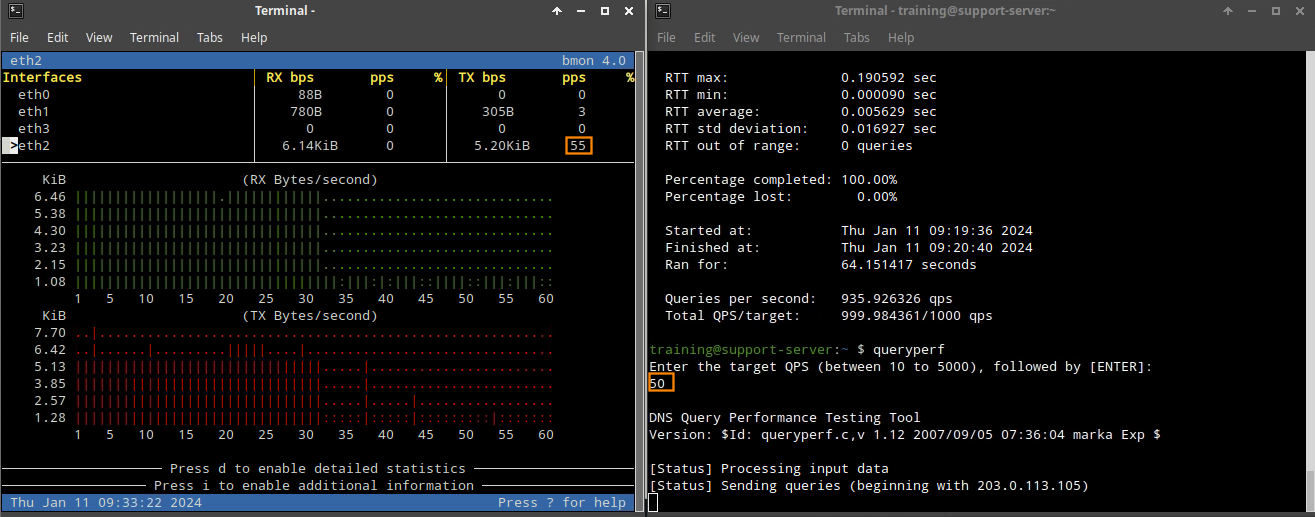
Enter a QPS value of 350.
-
The value should be between the QPS setting for Rule ID 130000100 (250) and the QPS setting for Rule ID 130000200 (500).
-
The Bmon window should show the spike of RX (Received) traffic.
-
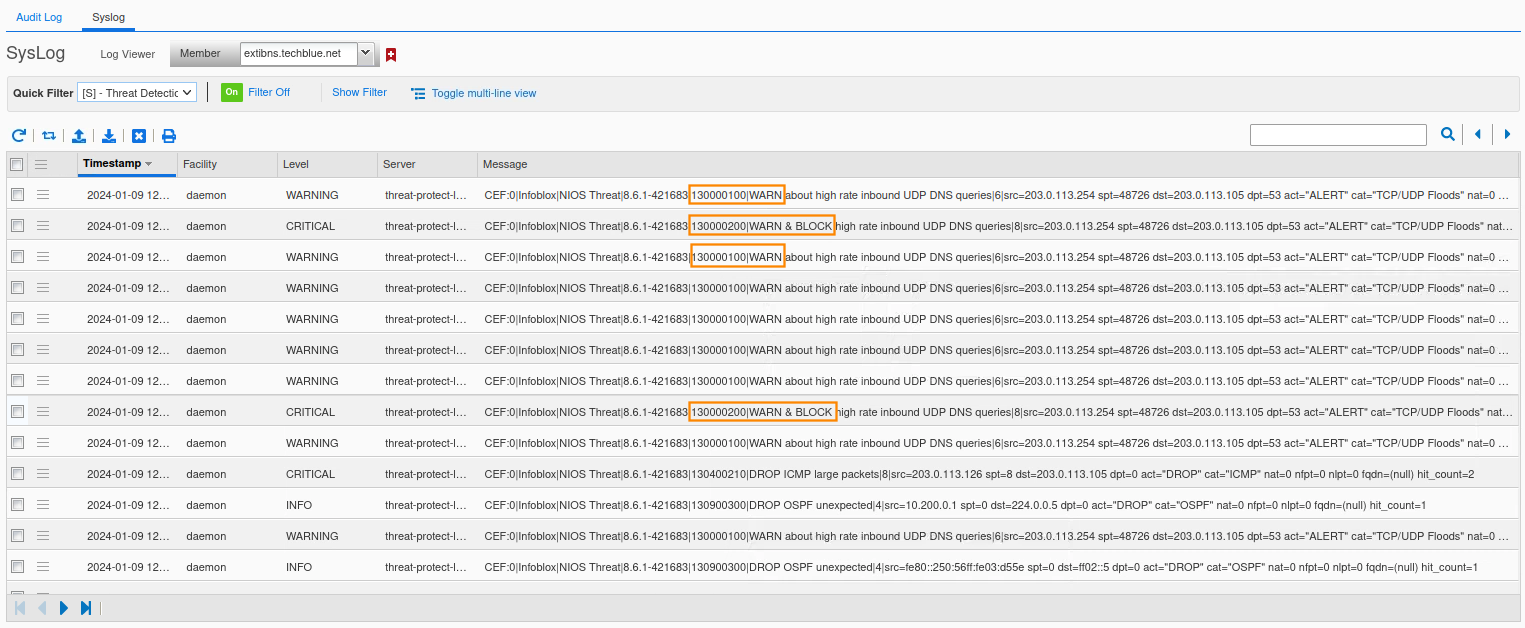
On the Infoblox NIOS UI, you should also be able to see syslog WARN alerts, indicating that 203.0.113.254 is sending too many UDP packets. It could be a volumetric attack. Rule 130000100 is triggered.
-
Run the queryperf command again.
-
Enter the value of 600 QPS. The value should be larger than the QPS setting for Rule ID 130000200 (500).
-
This time, you should see syslog DROP alerts indicating that 203.0.113.254 is sending too many UDP packets. Rule 130000200 is triggered. As we are still in monitor-mode, the packets won’t actually be dropped. You will see both rules (130000100 and 130000200) triggered in syslog.
We will now disable monitor-mode.
-
Log in to NIOS-4 VM (admin/infoblox)
-
Issue the set adp monitor-mode off command.
-
Issue the show adp monitor-mode command. You should see that monitor mode is enabled, but the Threat Protection service is disabled.
-
We will repeat the same test using qureyperf.
-
Set the query rate to 350. We will still see Threat Protection warnings.
-
Set the rate to 600, which is higher than the threshold for the 130000200 rule. Packets will start to drop. The bmon window will start to show RX (receive) traffic spikes, then drop for 5 seconds, spike again until the queryperf tool completes.
-
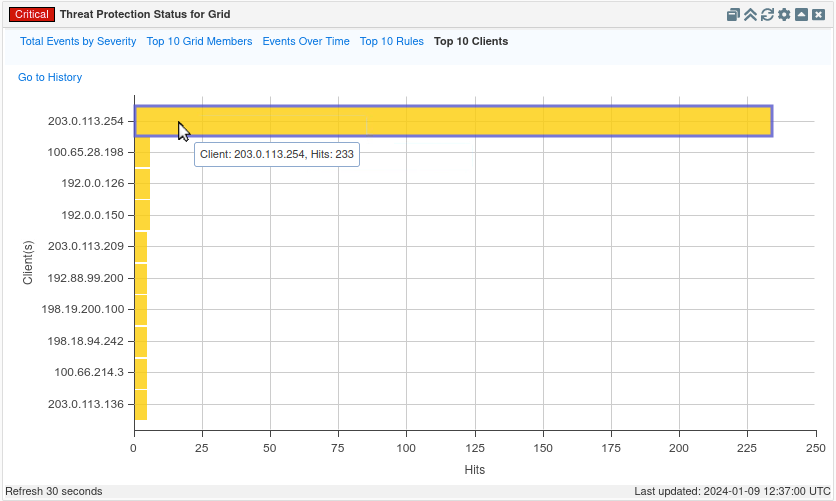
We can also see that 203.0.113.254 is one of the Top 10 clients, under the Threat Protection Status for Grid widget.
Task 20 Solution: Create a Custom Allowlist (Whitelist) Rule
In this task, you create a custom Allowlist rule to allow traffic from the IP Address 203.0.113.254. This is the IP Address of an important customer. The organization has a legal obligation to provide a 24/7 service, and the traffic from this customer cannot be blocked or rate-limited. You need to create an ALLOWLIST PASS UDP IP rule to allow UDP traffic from IP Address 203.0.113.254.
-
Navigate to Data Management → Security → Threat Protection Rules.
-
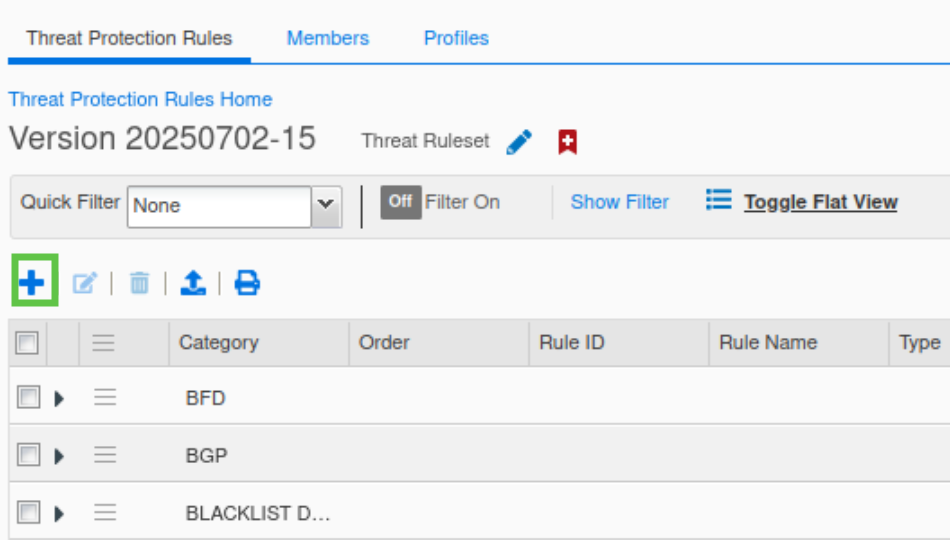
Click on the link for the 20250702-15 ruleset.
-
Click the plus (+) symbol to add a custom rule.
-
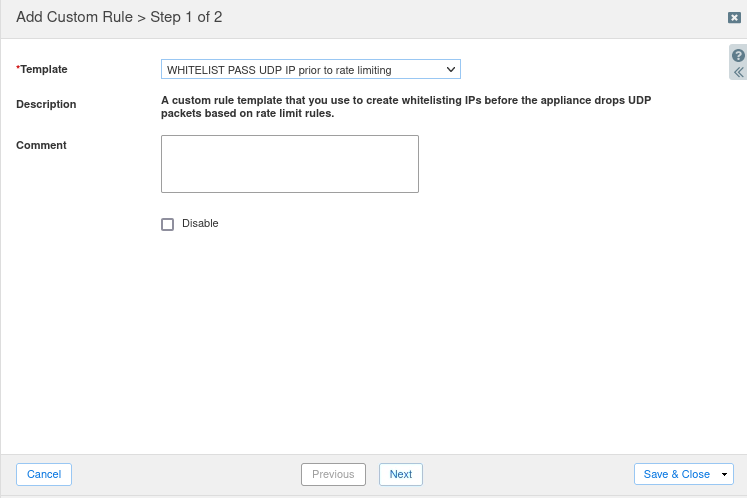
Choose the Allowlist WHITELIST PASS UDP IP prior to rate limiting from the drop-down template list.
-
Click Next to configure the rule parameters.
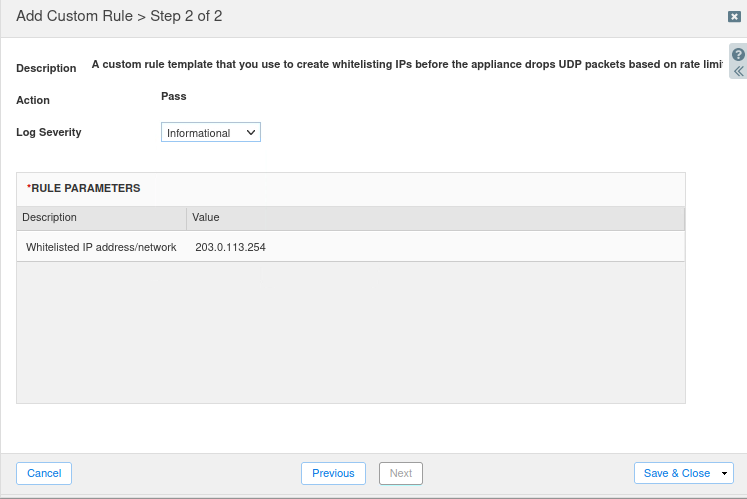
-
Enter the IP Address 203.0.113.254, then Save and Close.
-
Publish the rule when prompted.
It may take up to 1 minute for the ruleset to be reloaded. You can see the reload status in the NIOS syslog.
Now, let’s test the rule:
-
Log onto the support-server virtual machine (training/infoblox)
-
Open a terminal and type the command bmon. Expand the terminal window to see the colored chart below.
-
Press the down arrow key on your keyboard to select the eth2 interface.
-
Open another terminal window, and type the command queryperf.
-
Enter 1000 for the QPS to use. This value is double the threshold set in the tuned default rules and would be blocked without the Allowlist rule.
-
The bmon tool should show a static line of RX (receive) traffic, receiving around 1000 pps, which verifies our configuration is working.
Now, for our lab exercise, we need to disable the Allowlist Custom Rule on the NIOS UI:
-
Navigate to Data Management → Security → Threat Protection Rules.
-
Click on the link for the 20250702-15 ruleset.
-
Use the Quick Filter to show All Custom Rules.
-
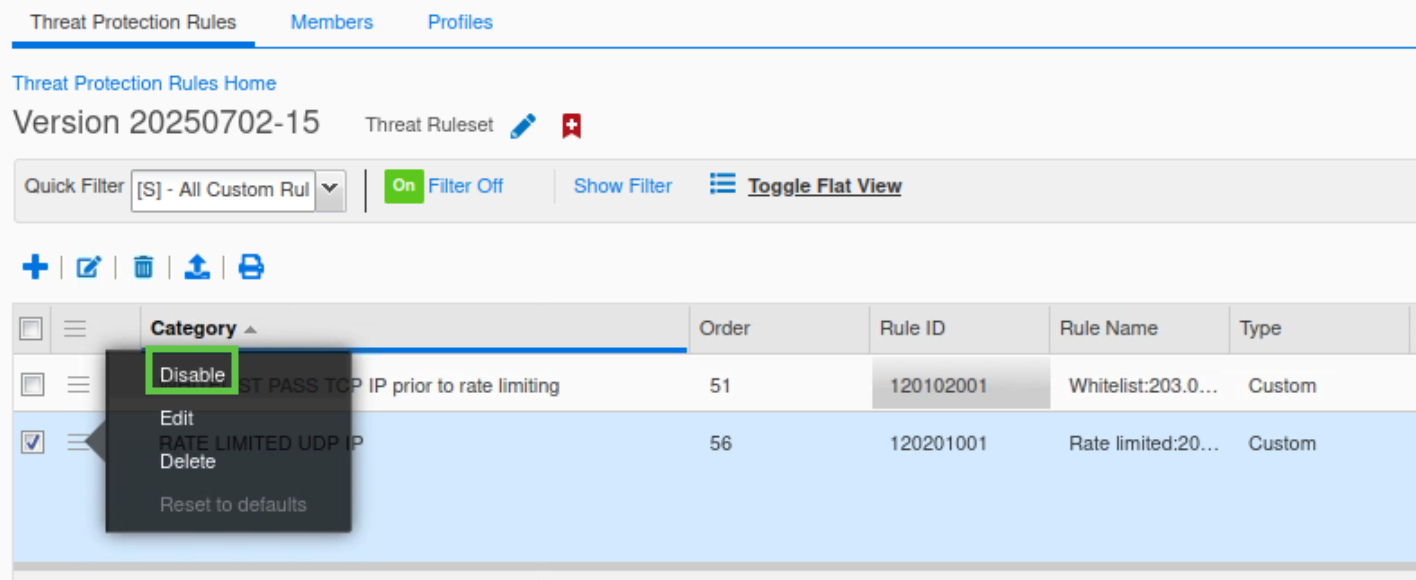
Click the hamburger icon next to the custom rule with category ALLOWLIST PASS UDP IP prior to rate limiting for 203.0.113.254.
-
Click Disable.
-
The rule should now show it is disabled.
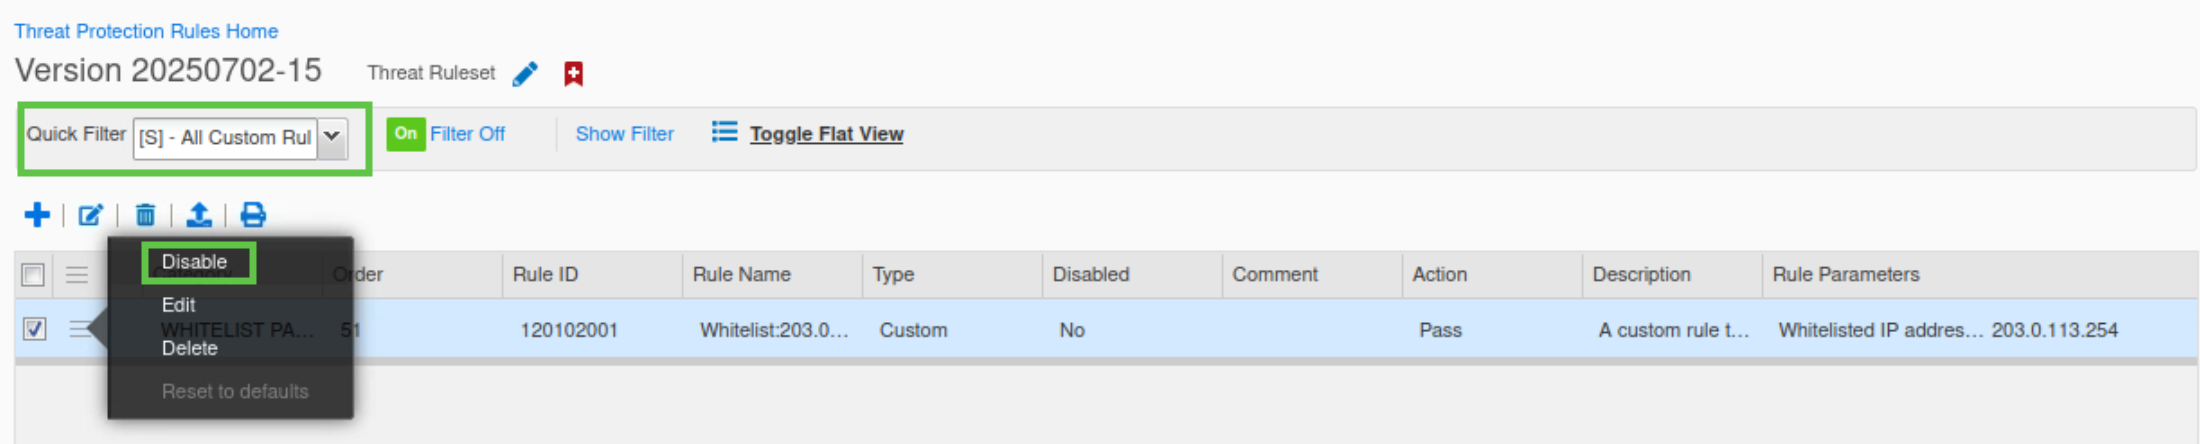
-
Publish the changes when prompted.
Please ensure the rule is disabled before continuing
Task 21 Solution: Create a Custom Rate Limiting Rule
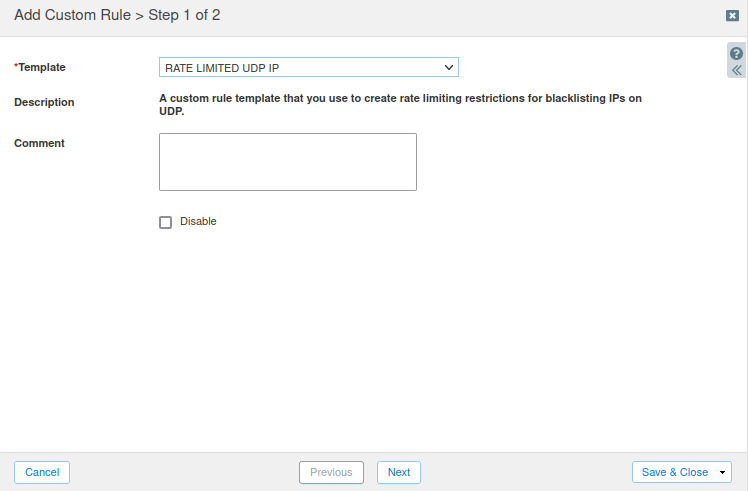
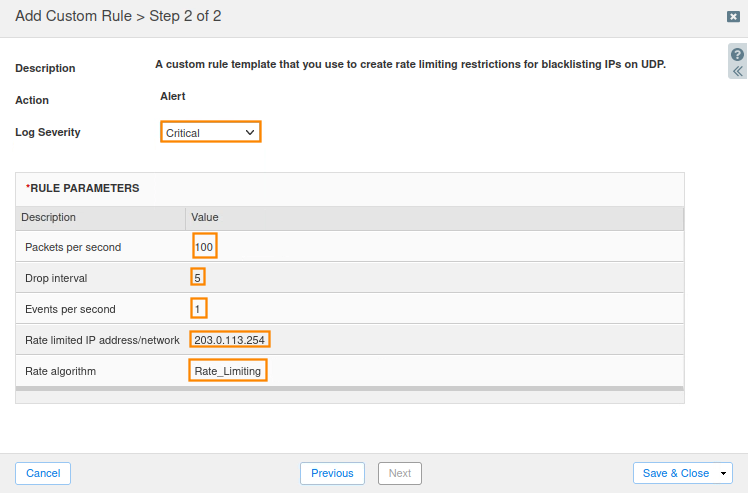
In this scenario, 203.0.113.254 is generating a significant amount of traffic, and we want to limit the QPS it can send to 100 before it is rate-limited. In this task, you create a custom Rate Limited rule to control traffic from the IP Address 203.0.113.254. Create a RATE LIMITED UDP IP rule to limit the UDP traffic.
-
Navigate to Data Management → Security → Threat Protection Rules.
-
Click on the link for the 20250702-15 ruleset.
-
Click the plus (+) symbol to add a custom rule.

-
Choose RATE LIMITED UDP IP from the drop-down template list.
-
Click Next to configure the rule parameters.
-
Use the following parameters for the rule:
-
For Log Severity, select Critical.
-
For Packets per second, specify a value of 100.
-
For the Drop interval, specify a value of 5.
-
For Events per second, specify a value of 1.
-
For Rate limited IP address/network, specify a value of 203.0.113.254.
-
For Rate algorithm, select Rate_Limiting
-
Save & Close.
-
-
Publish the rule when prompted.

It may take up to 1 minute for the ruleset to be reloaded. You can see the reload status in syslog.
Like before, we should test the rule:
-
Log in to Support-Server (training/infoblox)
-
Open the bmon tool on a terminal and expand the window to see the graph below.
-
Press the down arrow key on your keyboard to select the eth2 interface.
-
Open a terminal window, and type the command queryperf.
-
Use 50 QPS; This value is half our rate-limiting threshold, so it shouldn’t trigger the rule. The bmon tool should show RX traffic around 50 pps.
-
Now, let’s send 200 QPS. This is higher than the allowed custom rule value but lower than the global alert value configured in rule 130000100.
-
This time, the bmon tool shows continuous spikes of queries, then drops for 5-second intervals
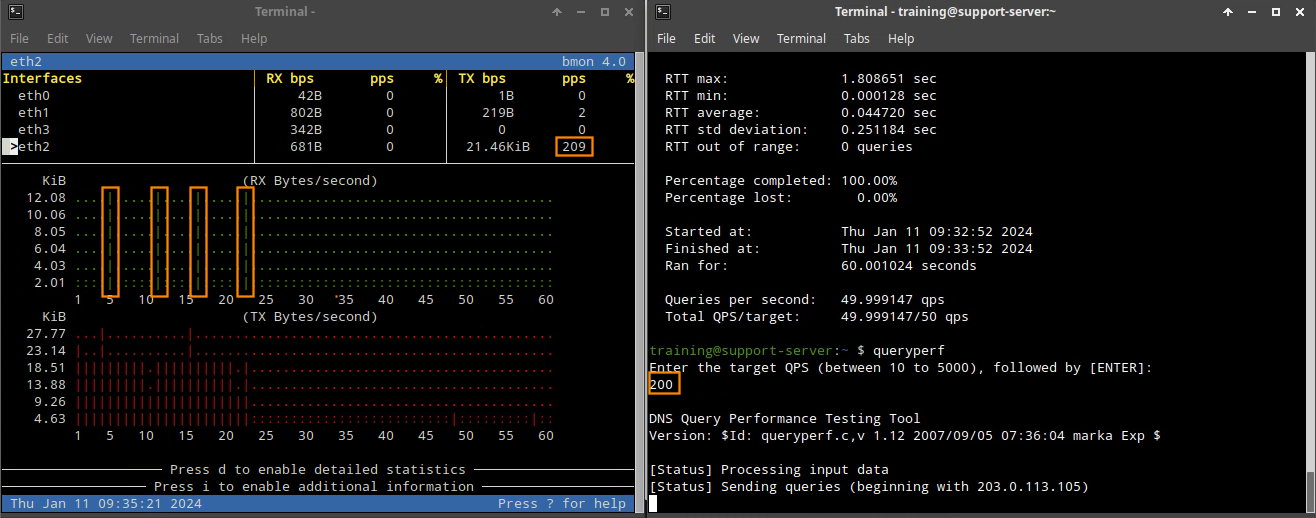
-
Check the NIOS Grid syslog to view the rate-limiting rule being applied.
Again, we must disable the Rate Limiting Custom Rule for our lab exercise.
-
Navigate to Data Management → Security → Threat Protection Rules.
-
Click on the link for the 20250702-15 ruleset.
-
Use the Quick Filter to show All Custom Rules.
-
Click the hamburger icon next to the custom RATE LIMITED UDP IP rule for 203.0.113.254.
-
Click Disable. The rule should now show it is disabled.
-
Publish the changes when prompted.
Please ensure the rule is disabled before continuing
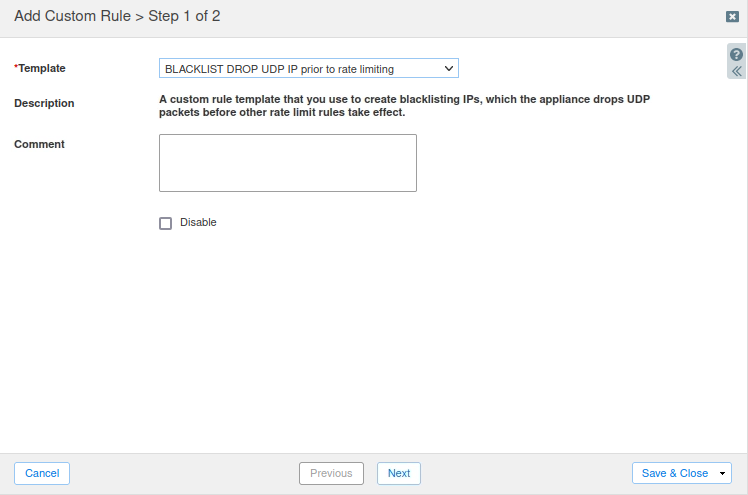
Task 22 Solution: Create a Custom Denylist (Blacklist) Rule
The IP address 203.0.113.254 has been identified as attempting to attack us. In this task, you create a custom Denylist rule to block traffic from the IP Address 203.0.113.254.
-
You create a DENYLIST DROP UDP IP prior to rate limiting rule to ensure UDP traffic from the IP Address 203.0.113.254 is blocked.
-
Navigate to Data Management → Security → Threat Protection Rules.
-
Click on the link for the 20250702-15 ruleset.
-
Click the plus (+) symbol to add a custom rule.
-
Choose the Denylist BLACKLIST DROP UDP IP prior to rate limiting from the drop-down template list.
-
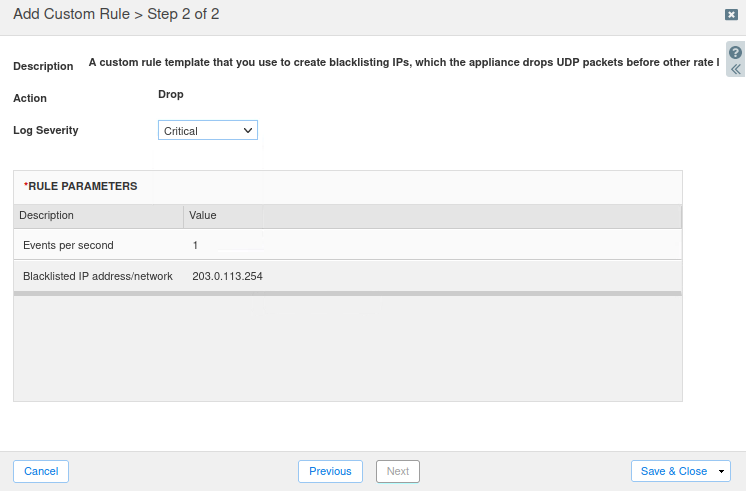
Click Next to configure the rule parameters.
-
Set the Severity Level to Critical.
-
Enter the IP Address 203.0.113.254, then Save and Close.
-
Publish the rule when prompted.
It may take up to 1 minute for the ruleset to be reloaded. You can see the reload status in the NIOS syslog.
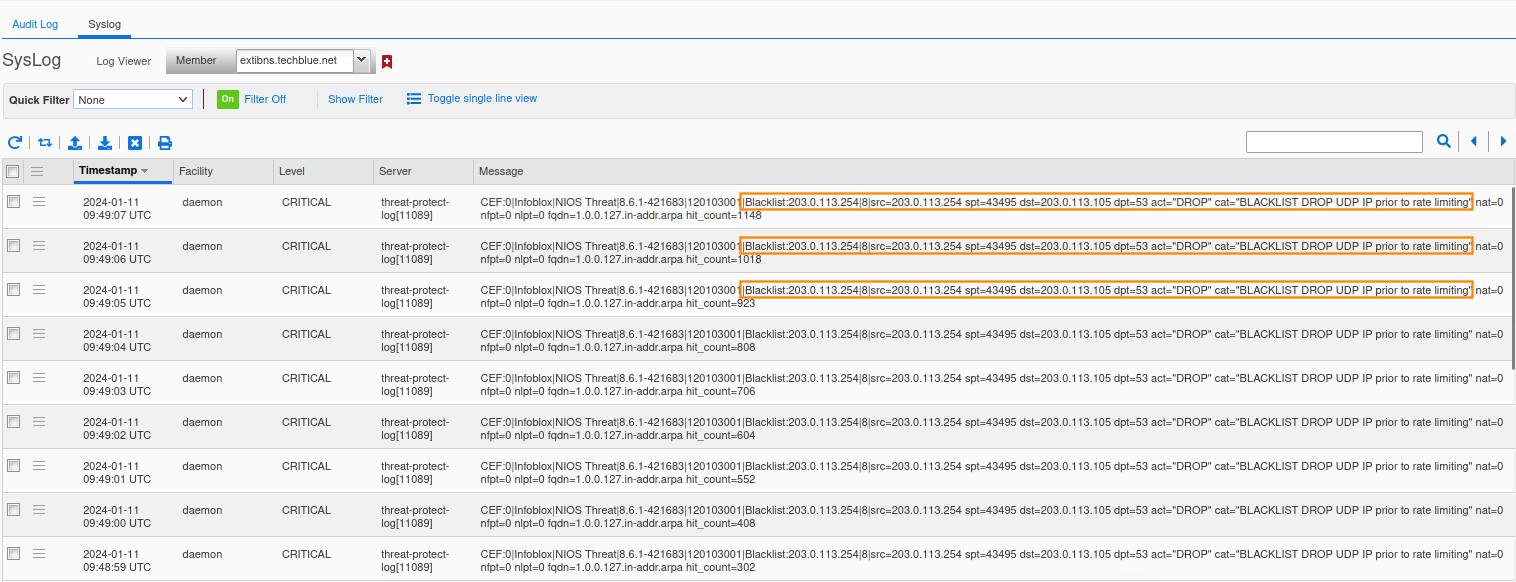
Now, we can test this Denylist rule on a simulated attack:
-
Log in to support-server (training/infoblox)
-
Open the bmon tool in a terminal and expand the window to see the graph below.
-
Press the down arrow key on your keyboard to select the eth2 interface.
-
Open a terminal window, and type the command queryperf.
-
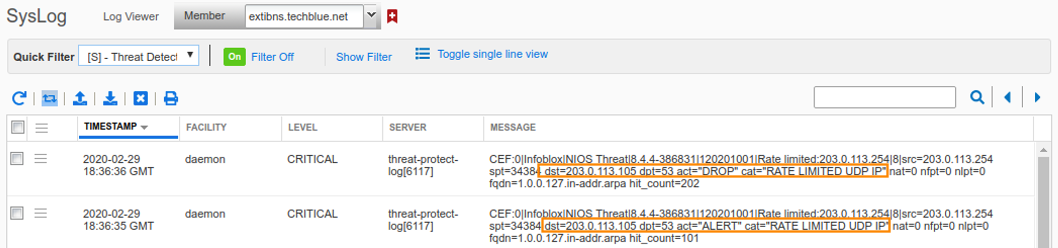
Use 100 QPS. This value is arbitrary, but we set it to 100 to have time to check NIOS syslogs while the attack is happening.
-
View syslog to see the effect of the denylist rule. All UDP requests to port 53 are dropped.
Again, we must disable the DENYLIST DROP UDP IP prior to the rate limiting Rule for our lab exercise. -
Navigate to Data Management → Security → Threat Protection Rules.
-
Click on the link for the 20250702-15 ruleset.
-
Use the Quick Filter to show All Custom Rules.
-
Click the hamburger icon next to the custom DENYLIST DROP UDP IP prior to rate limiting rule for 203.0.113.254.
-
Click Disable. The rule should now show it is disabled.
-
Publish the changes when prompted
Please ensure the rule is disabled before continuing
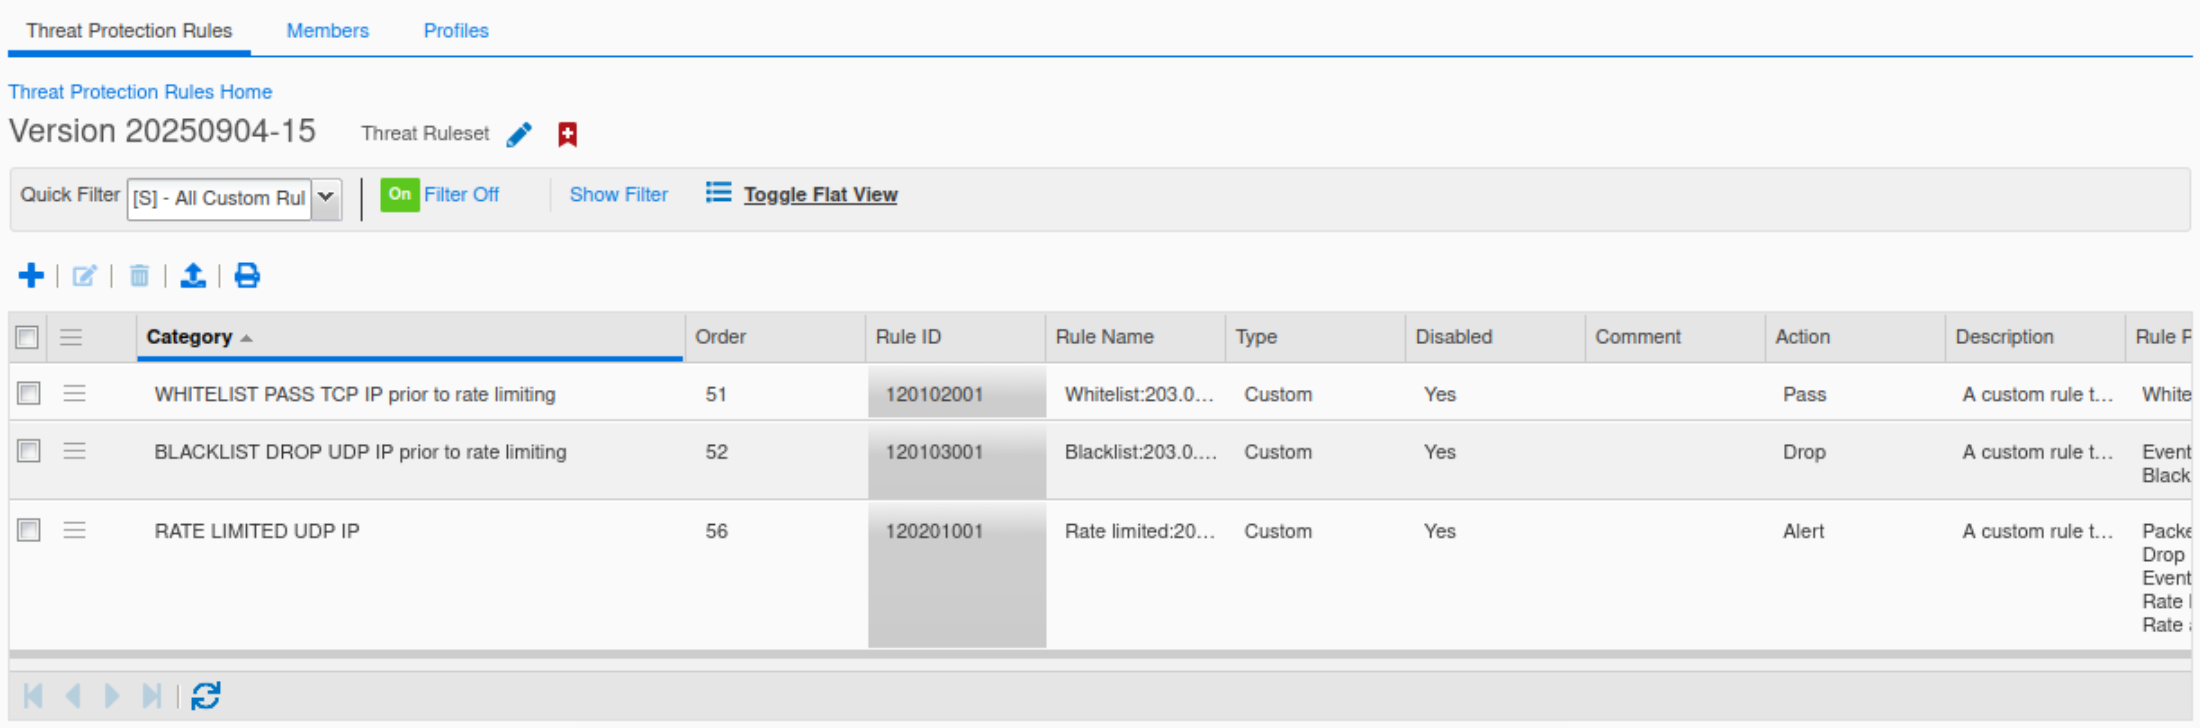
Task 23 Solution: Merge the current Ruleset with the newly downloaded Ruleset
Merge the older Ruleset 20250702-15 with the newer Ruleset 20250904-15. Ensure that you merge the custom rules created for your organization into the new Ruleset. The two rule sets must be merged before activating the new one.
-
Navigate to Data Management → Security → Threat Protection Rules.
-
Select Merge → Ruleset from the Toolbar.
-
Choose the older ruleset (20250702-15) on the left-hand side – Merge changes from…. This is the ruleset from which we want to copy the custom rules.
-
On the right-hand side, choose the ruleset you want to copy To. In this example, the ruleset 20250904-15 is used.
-
Click Get Differences.
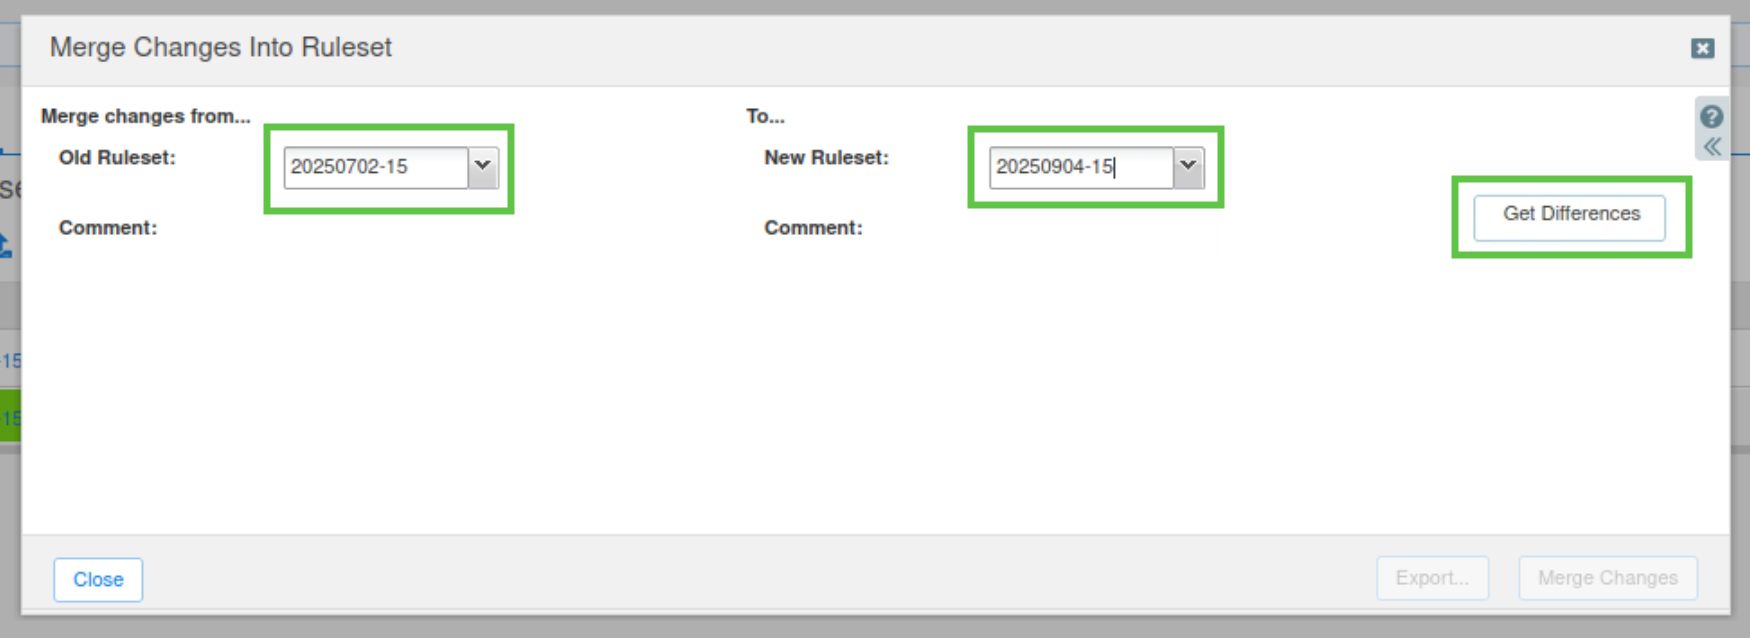
-
The top panel displays system rules that have been updated in the new ruleset. You can review them from here. The lower panel shows the customization in the first ruleset that are not in the new ruleset.
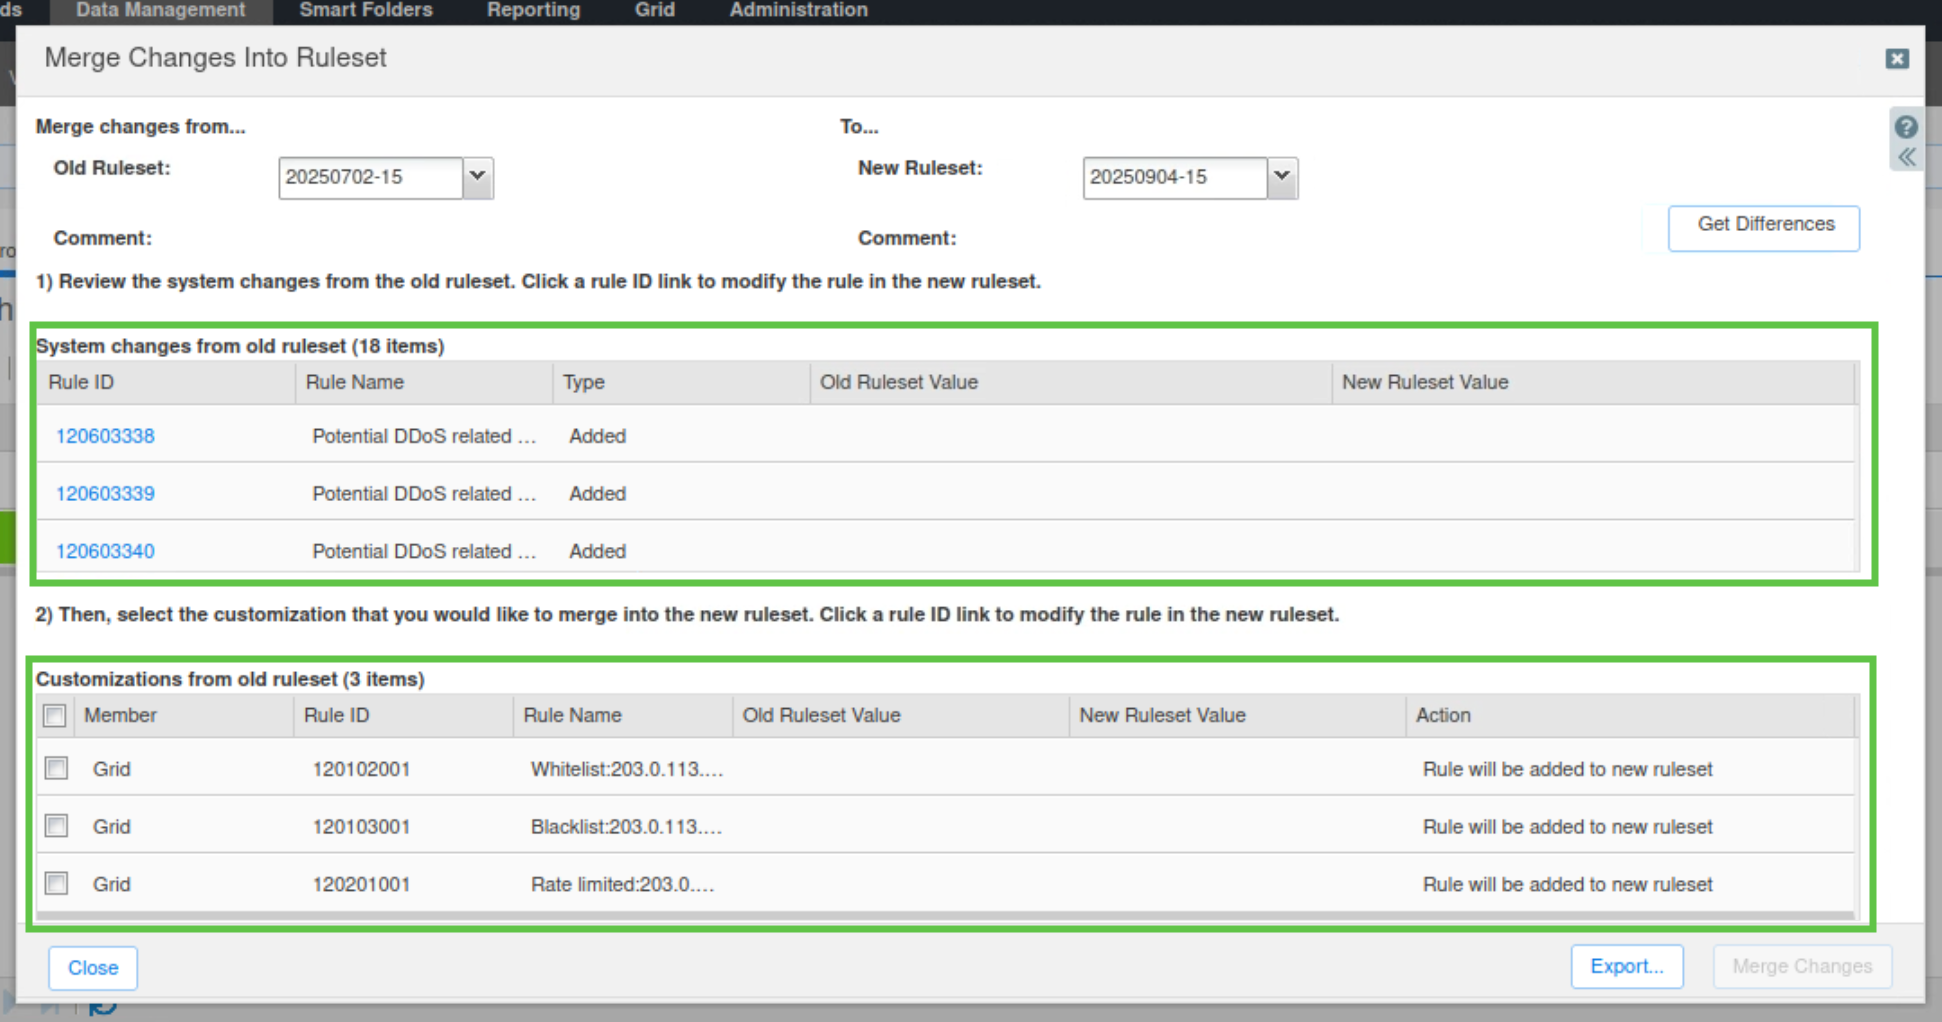
-
Select the custom rules created by your organization and click Merge Changes.
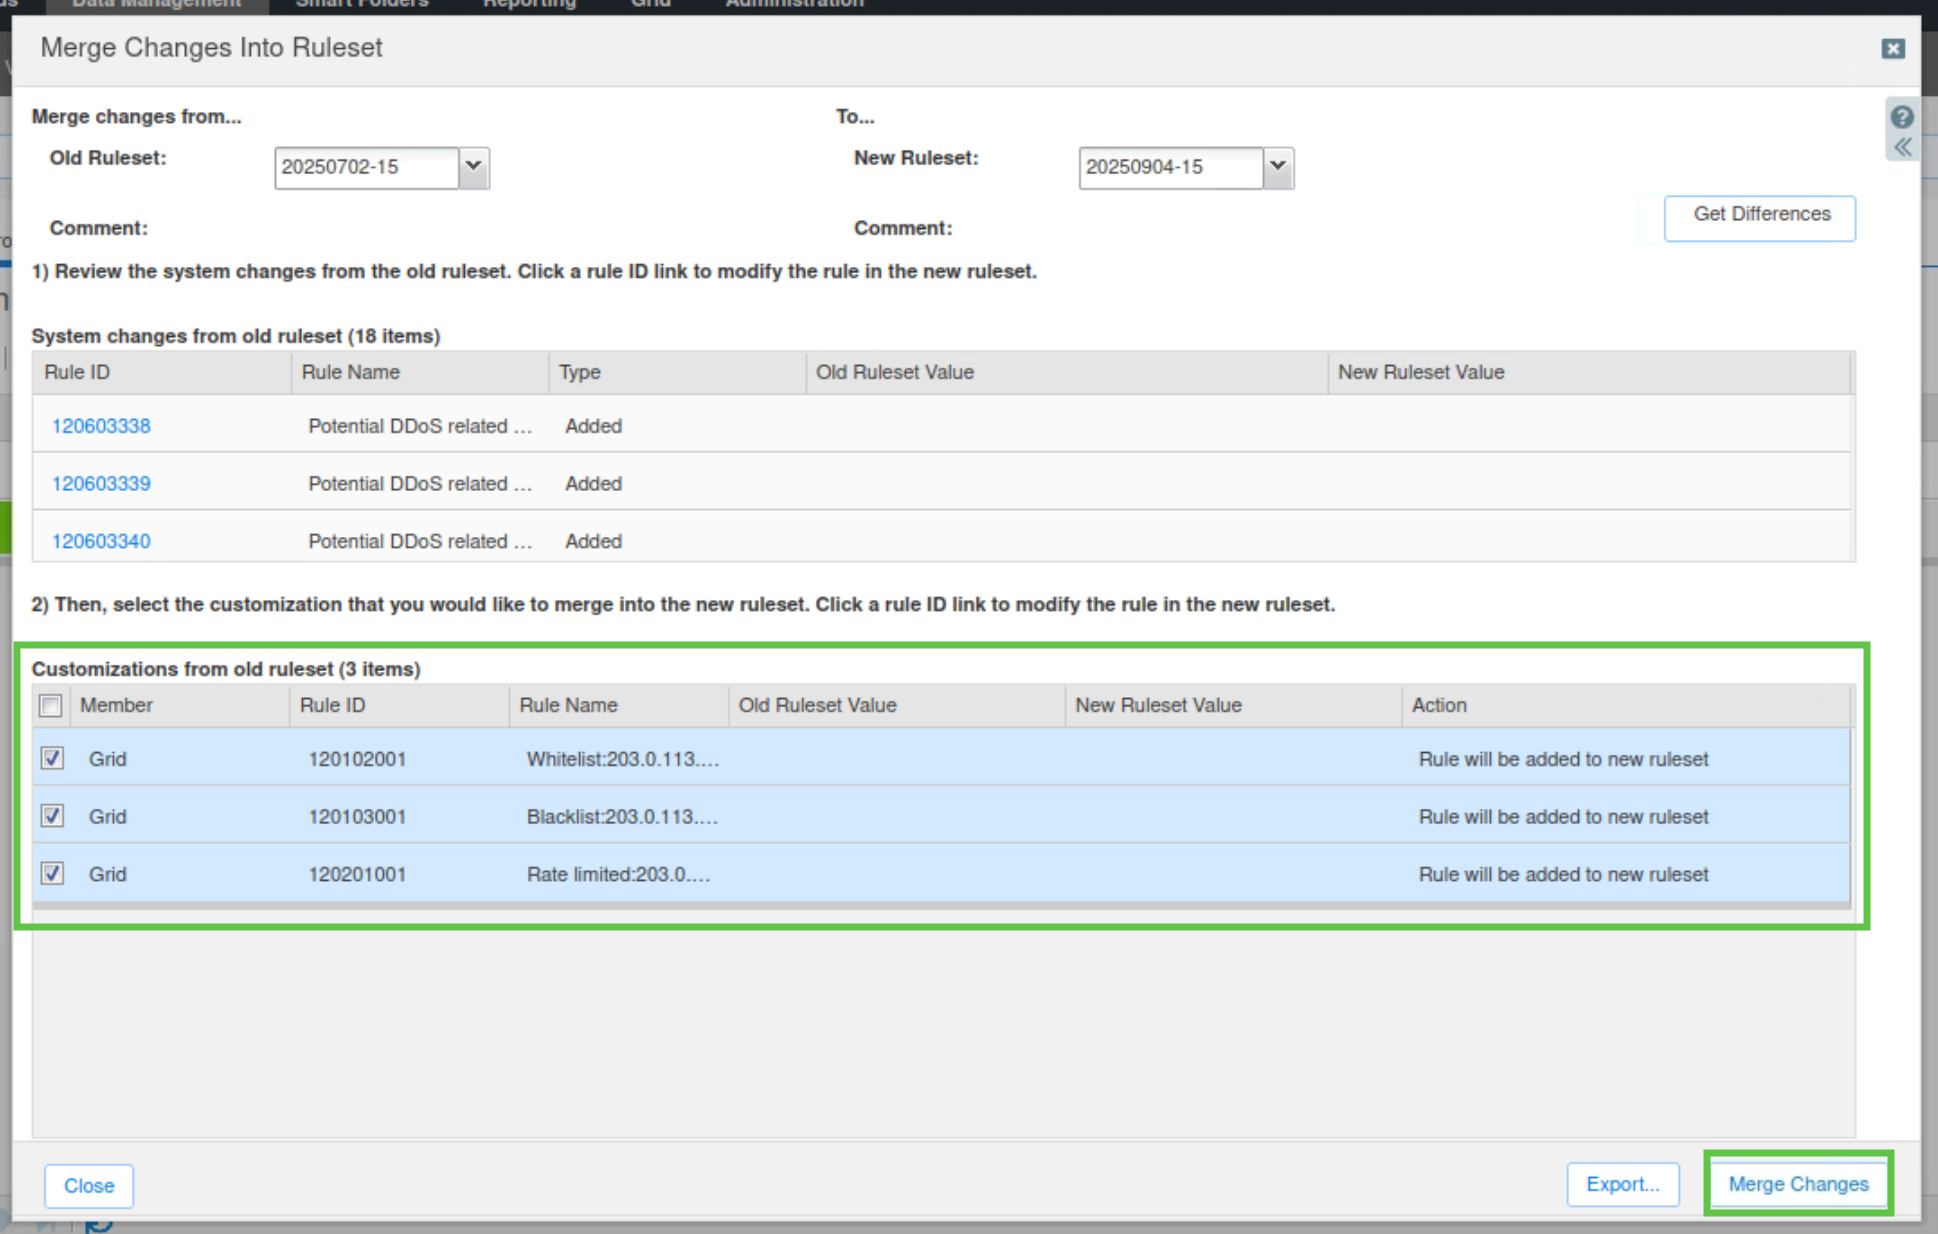
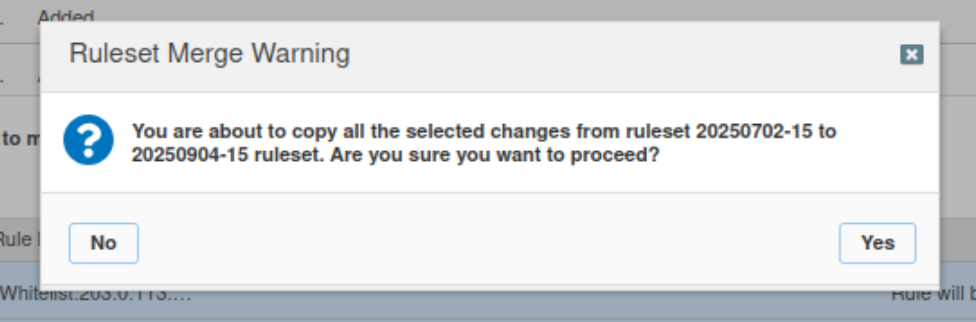
-
Select Yes to confirm that the changes should be applied to the new ruleset.
-
Close the Merge Changes into Ruleset window.
Task 24 Solution: Modify the External - Tuned profile to use the new ruleset
In this task, you modify the External - Tuned profile to use the new updated ruleset, then we will disable (DNS Malware, DNS DDoS, and DNS Tunneling) Categories, and finally verify that our custom rules have been merged correctly.
-
Navigate to Data Management → Security → Profiles.
-
Select the "External - Tuned" profile and click Edit.
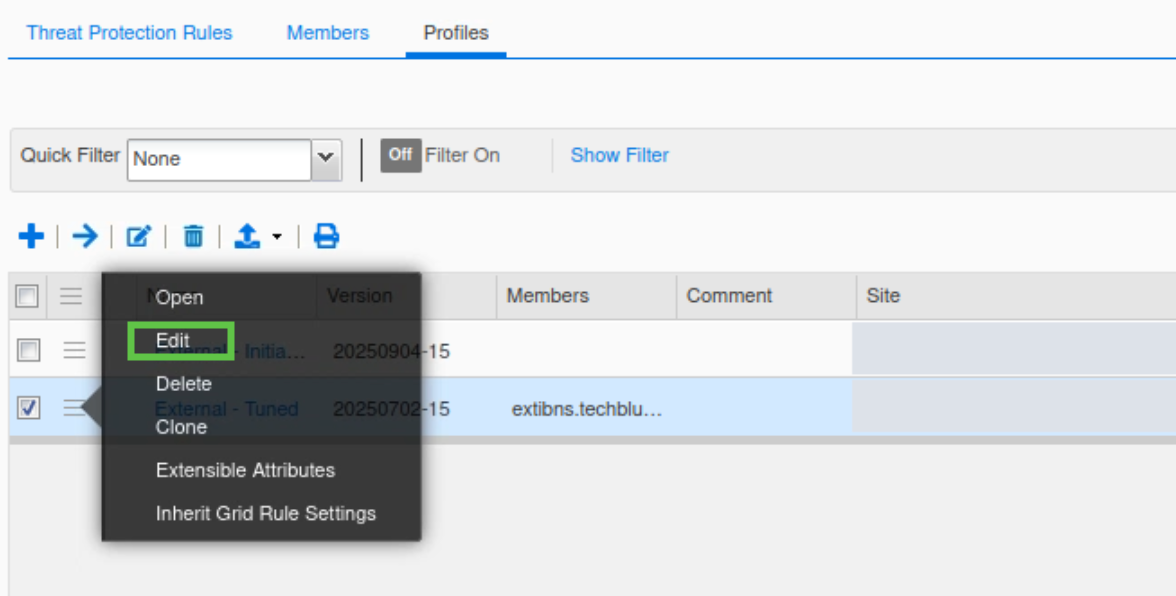
-
Select the latest that you have just merged the rules into; in this example, it is 20250904-15.
-
Click Save & Close.
-
Click on the External - Tuned profile
-
Scroll down to the DNS Malware category. New rules added to the ruleset will not be automatically disabled. Confirm that all the rules in the category are disabled.
-
Click the hamburger icon and select Disable all rules in Category.
-
Repeat the steps to confirm that DNS DDoS and DNS Tunneling rules are also disabled.
-
Navigate to Data Management → Security → Threat Protection Rules.
-
Click the latest Ruleset that you have just merged the rules into; in this example, it is 20250904-15.
-
Select All Custom Rules from the Quick filter drop-down menu. All three custom rules should be present and disabled.
-
Publish the changes when prompted.

Task 25 Solution: Verify Threat Protection events in Syslog
In this task, you will start your investigation on the ongoing DNS traffic spike triggering Threat Protection(ADP) to take action. We will start by investigating the Grid syslogs.
-
Navigate to Administration → Log → Syslog.
-
Select the Member extibns.techblue.net from the drop-down list.
-
Choose Threat Detection from the Quick Filter drop-down list.
-
Click Toggle multi-line view to view the Syslog records.
-
In this example, multiple records indicate that two Threat Protection rules were triggered: the EARLY DROP TCP and DROP OSPF rules.
-
The rule EARLY DROP TCP is in the DNS Protocol Anomalies category, originating from the source IP address 192.0.2.238.
-
The rule DROP OSPF is in the OSPF category from the source 10.200.0.1
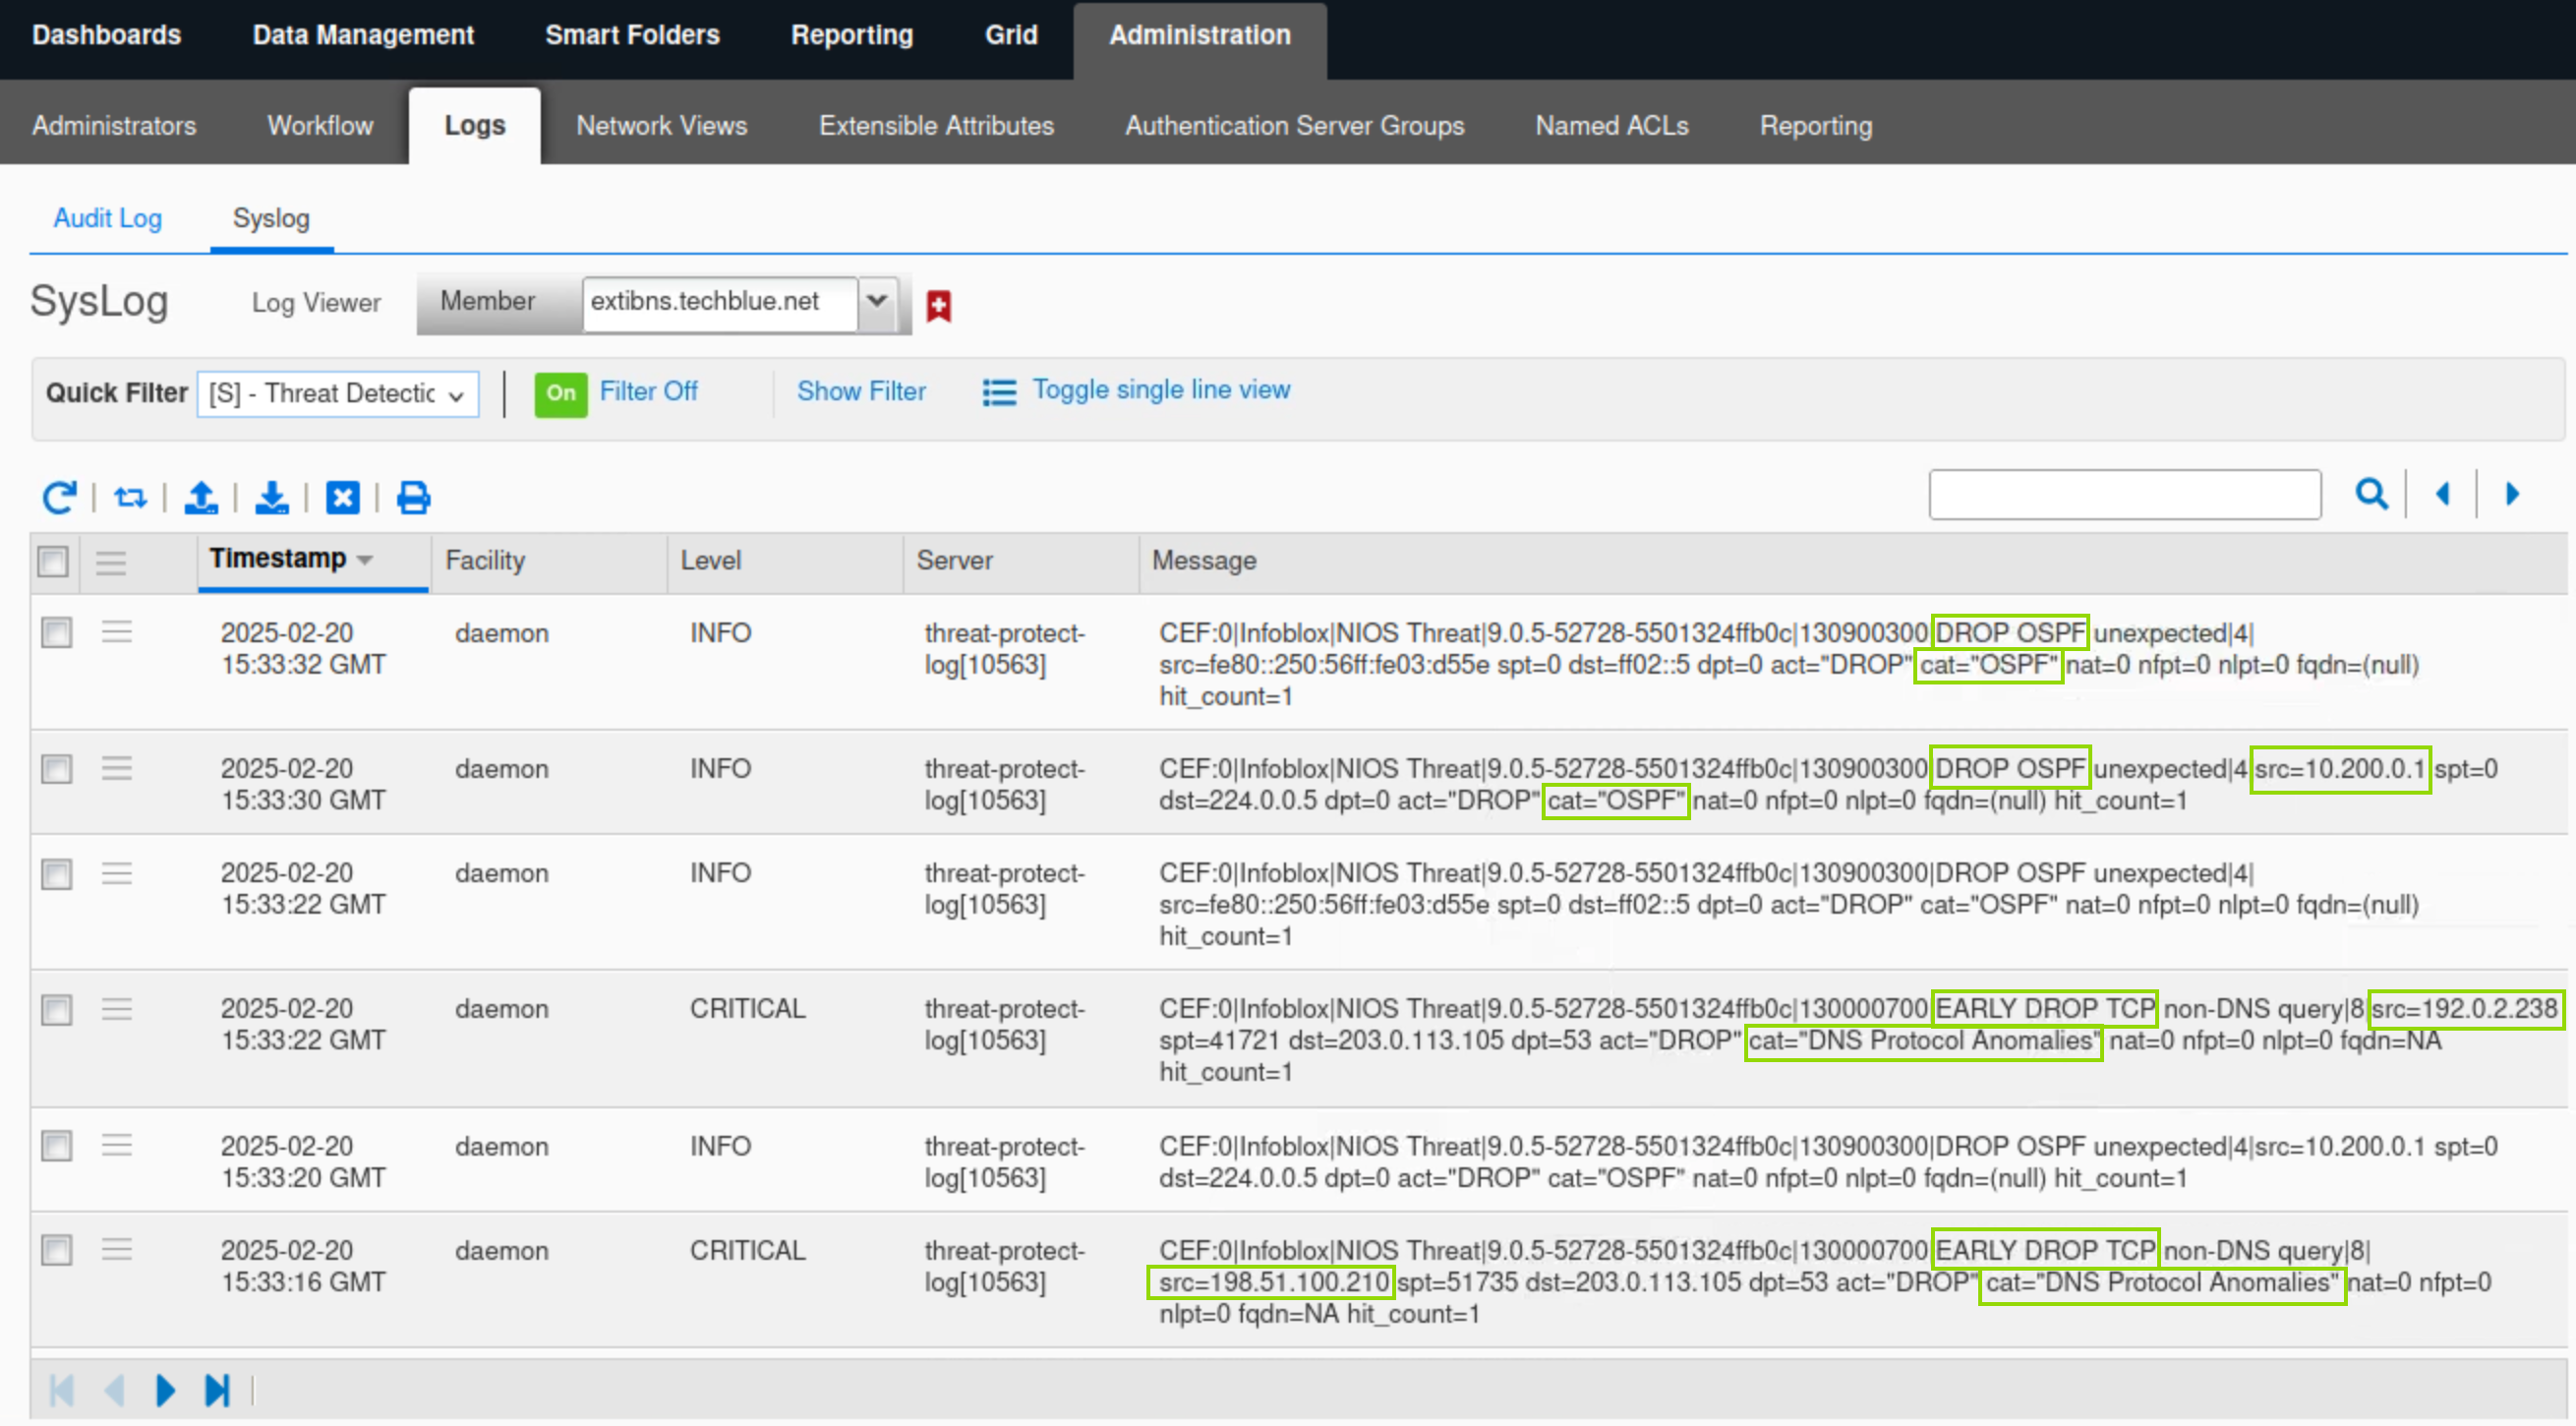
-
Task 26 Solution: Analyze the Grid Status and Health using Security Dashboard Widgets
In this task, we will utilize the NIOS Security Dashboard to view near-real-time data regarding the recent DNS spikes observed in our organization. Since we have just started our investigation and need to gather as much information and context about the attacks as possible, we will begin by analyzing the general security health of the grid and then drill down to each member separately to better understand which members were affected by the attacks. Then, we will investigate the affected members in more detail to gather information on the IPs and domains used during the attacks and verify that Threat Protection (ADP) identified and stopped the attempts.
-
Navigate to Dashboards → Status → Security.
-
Turn on auto-refresh for the security Dashboard.
-
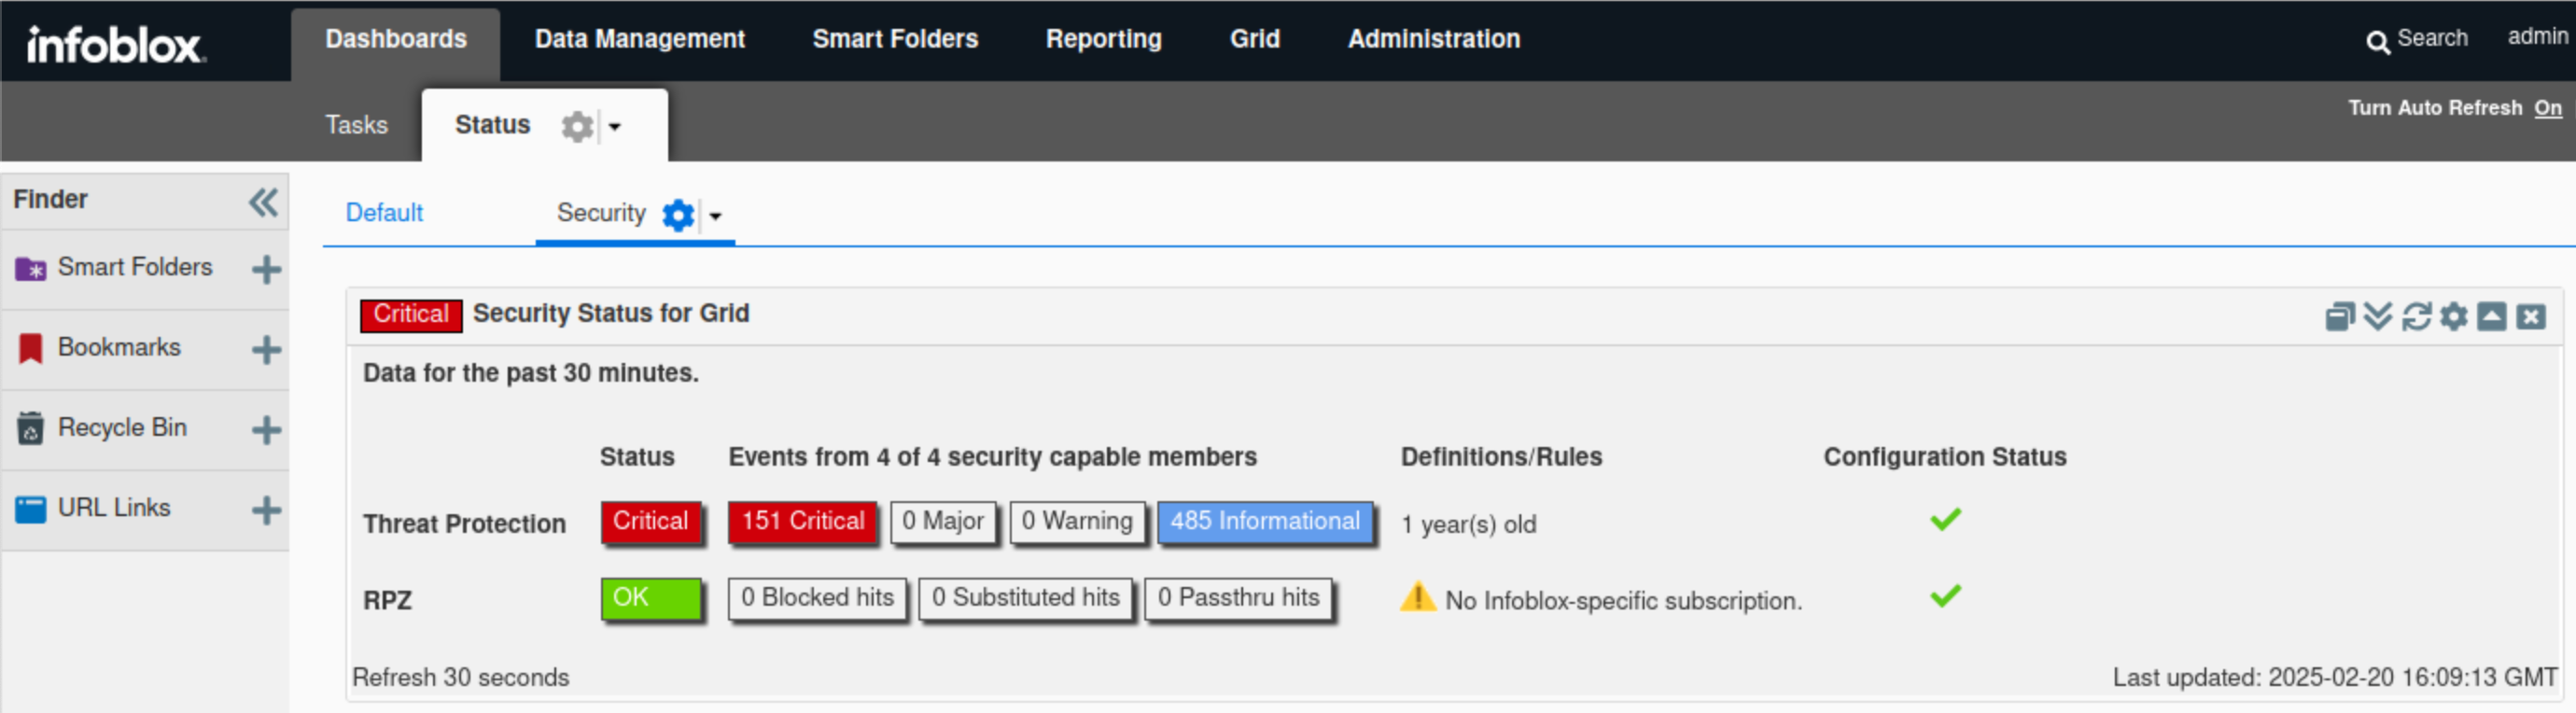
Find the Security Status for Grid widget.
-
The widget displays high-level information about the Grid security status.
-
In this example, the Threat Protection status is critical, which validates what we discovered earlier using syslog. We can see Threat Protection rules have been triggered a total of 636 times, broken into 151 critical events and 485 informational events. The exact values may vary in the lab environment.
-
Hovering over the status icon reveals a breakdown of the Threat Protection status. The same information also surfaced in the Threat Protection status for the Grid widget.
-
-
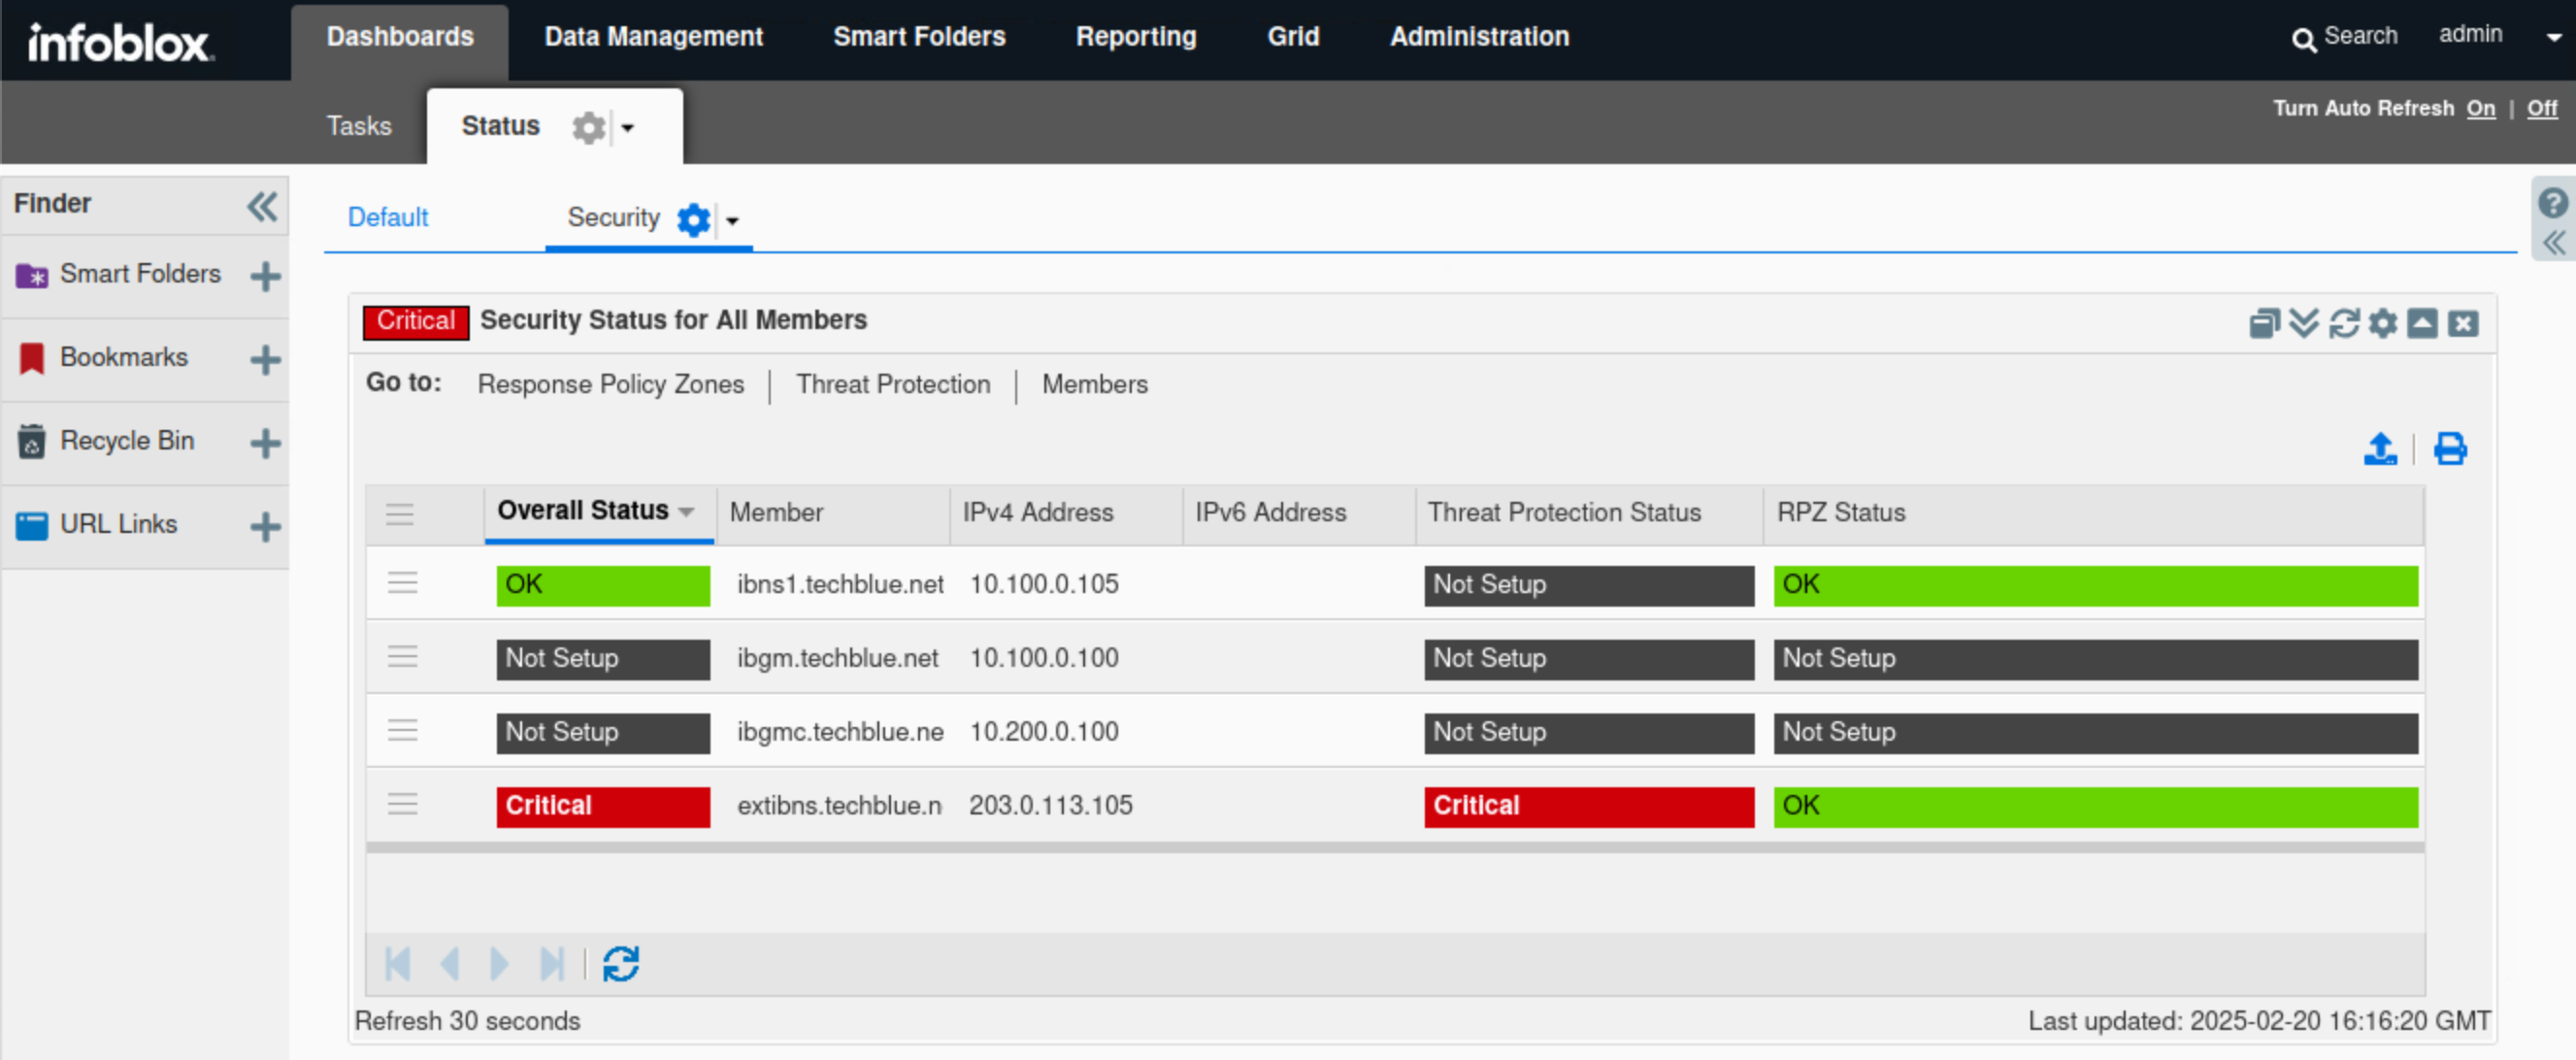
Find the Security Status for all Members widget.
-
Verify the status of the listed members ibns1.techlblue.net and extibns.techblue.net.
-
This widget provides a separate, more detailed breakdown of status for each Grid member.
-
In this example, ibns1.techlblue.net is not running Threat Protection and should not be affected by the recent events, while extibns.techblue.net is in a critical state.
-
By hovering over each member's name in the widget, we can view that member’s status. Similarly, by hovering over the Threat Protection status bar, we can view a breakdown of that member's Threat Protection status.
-
-
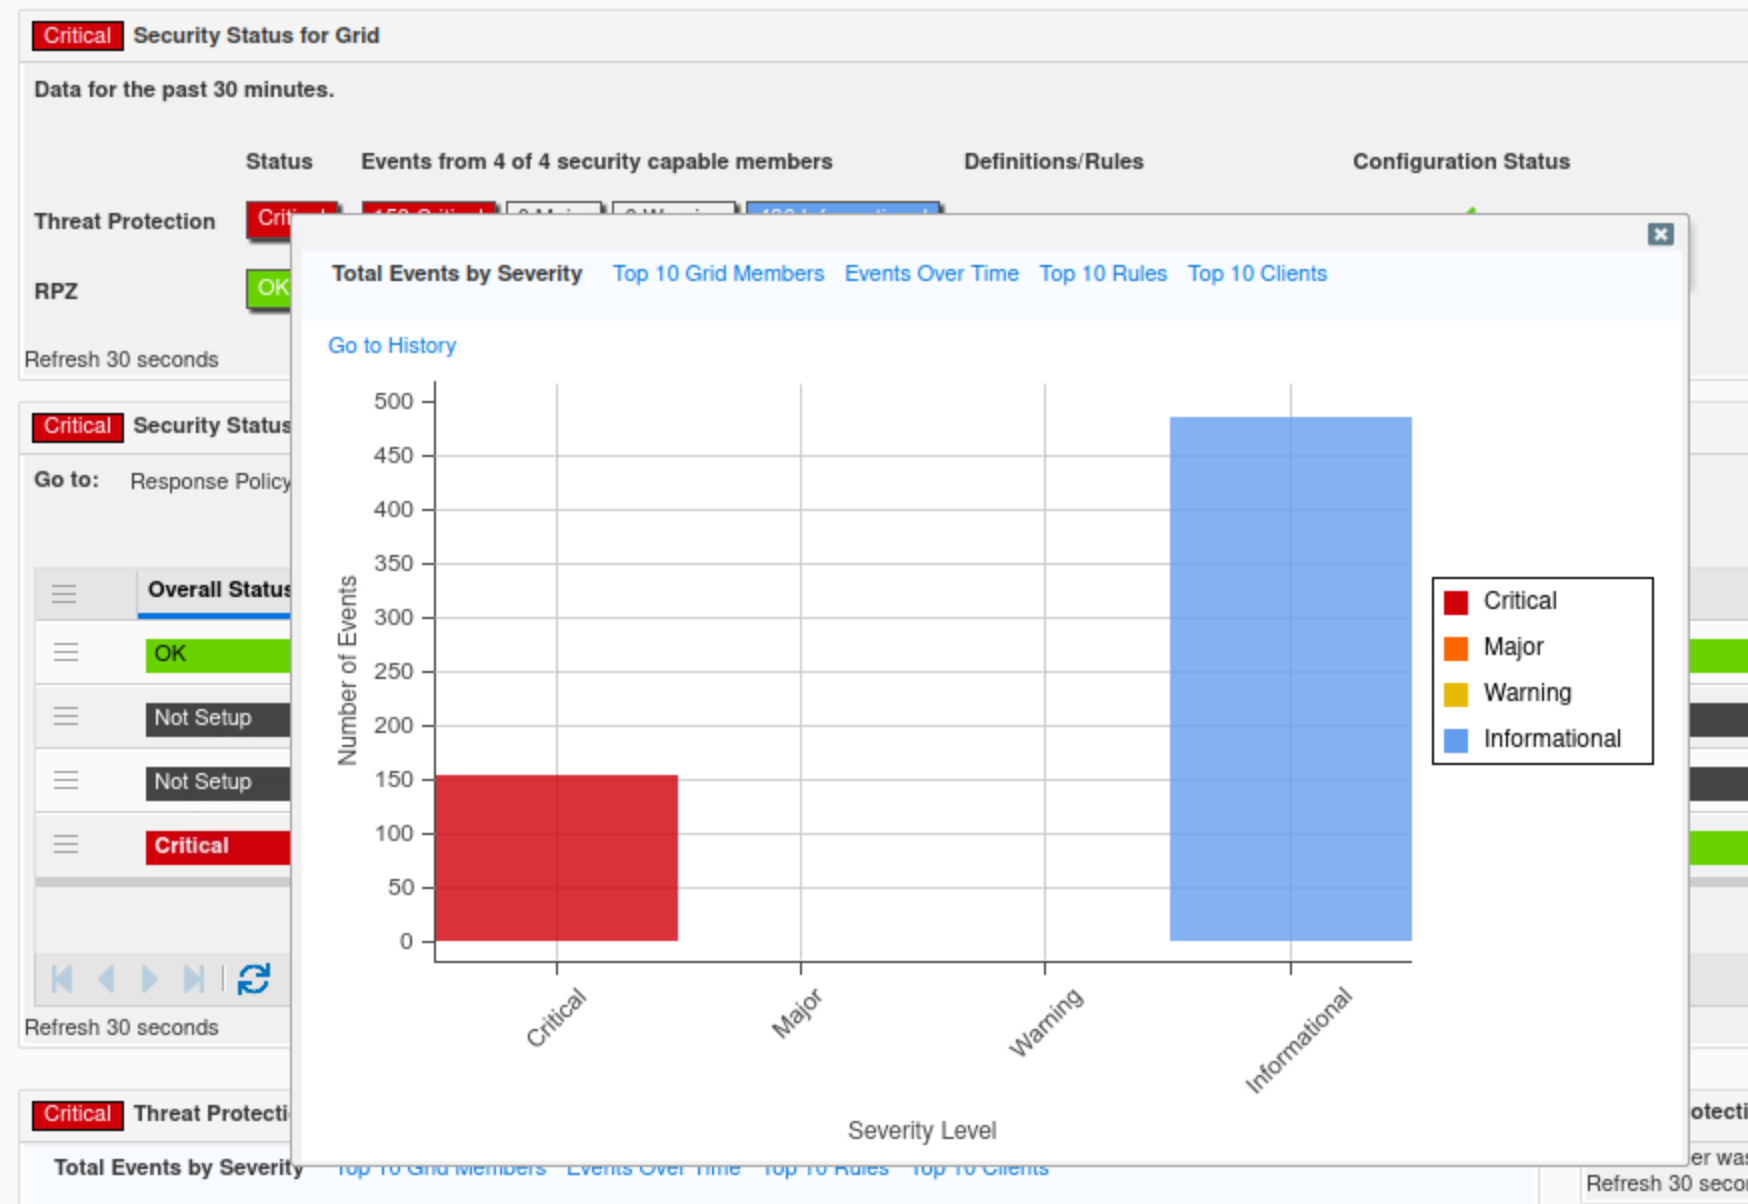
Find the Threat Protection Status for Grid widget.
-
Click Total Events by Severity.
-
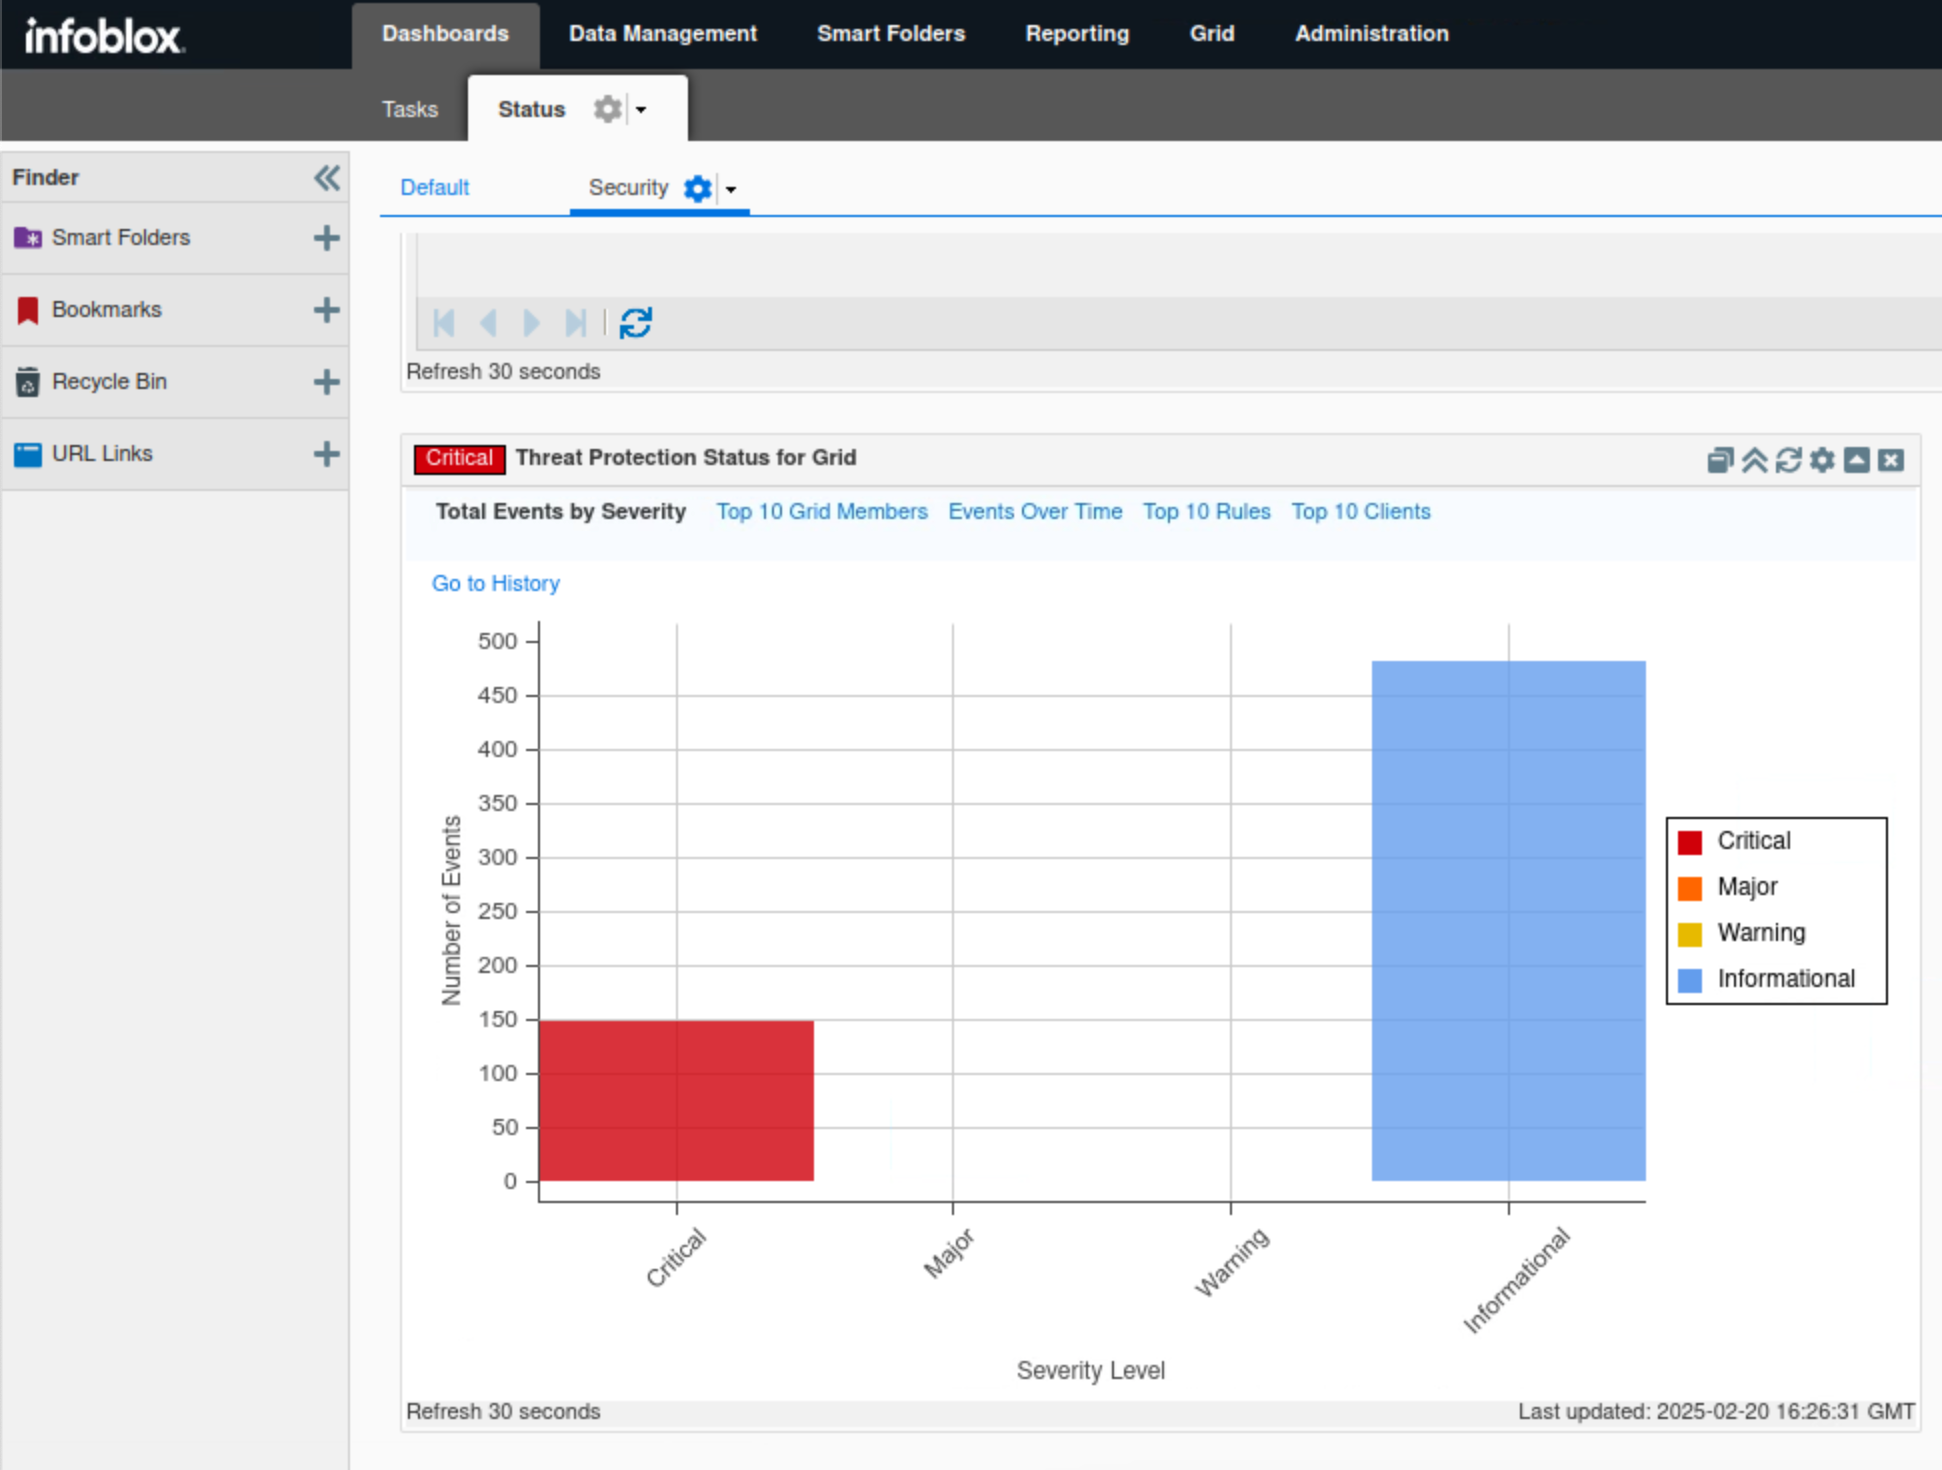
This tab, presented in bar chart format, categorizes Threat Protection events into four categories: Critical, Major, Minor, and Informational.
-
In this example, we can see only two categories being triggered: Critical and Informational.
-
-
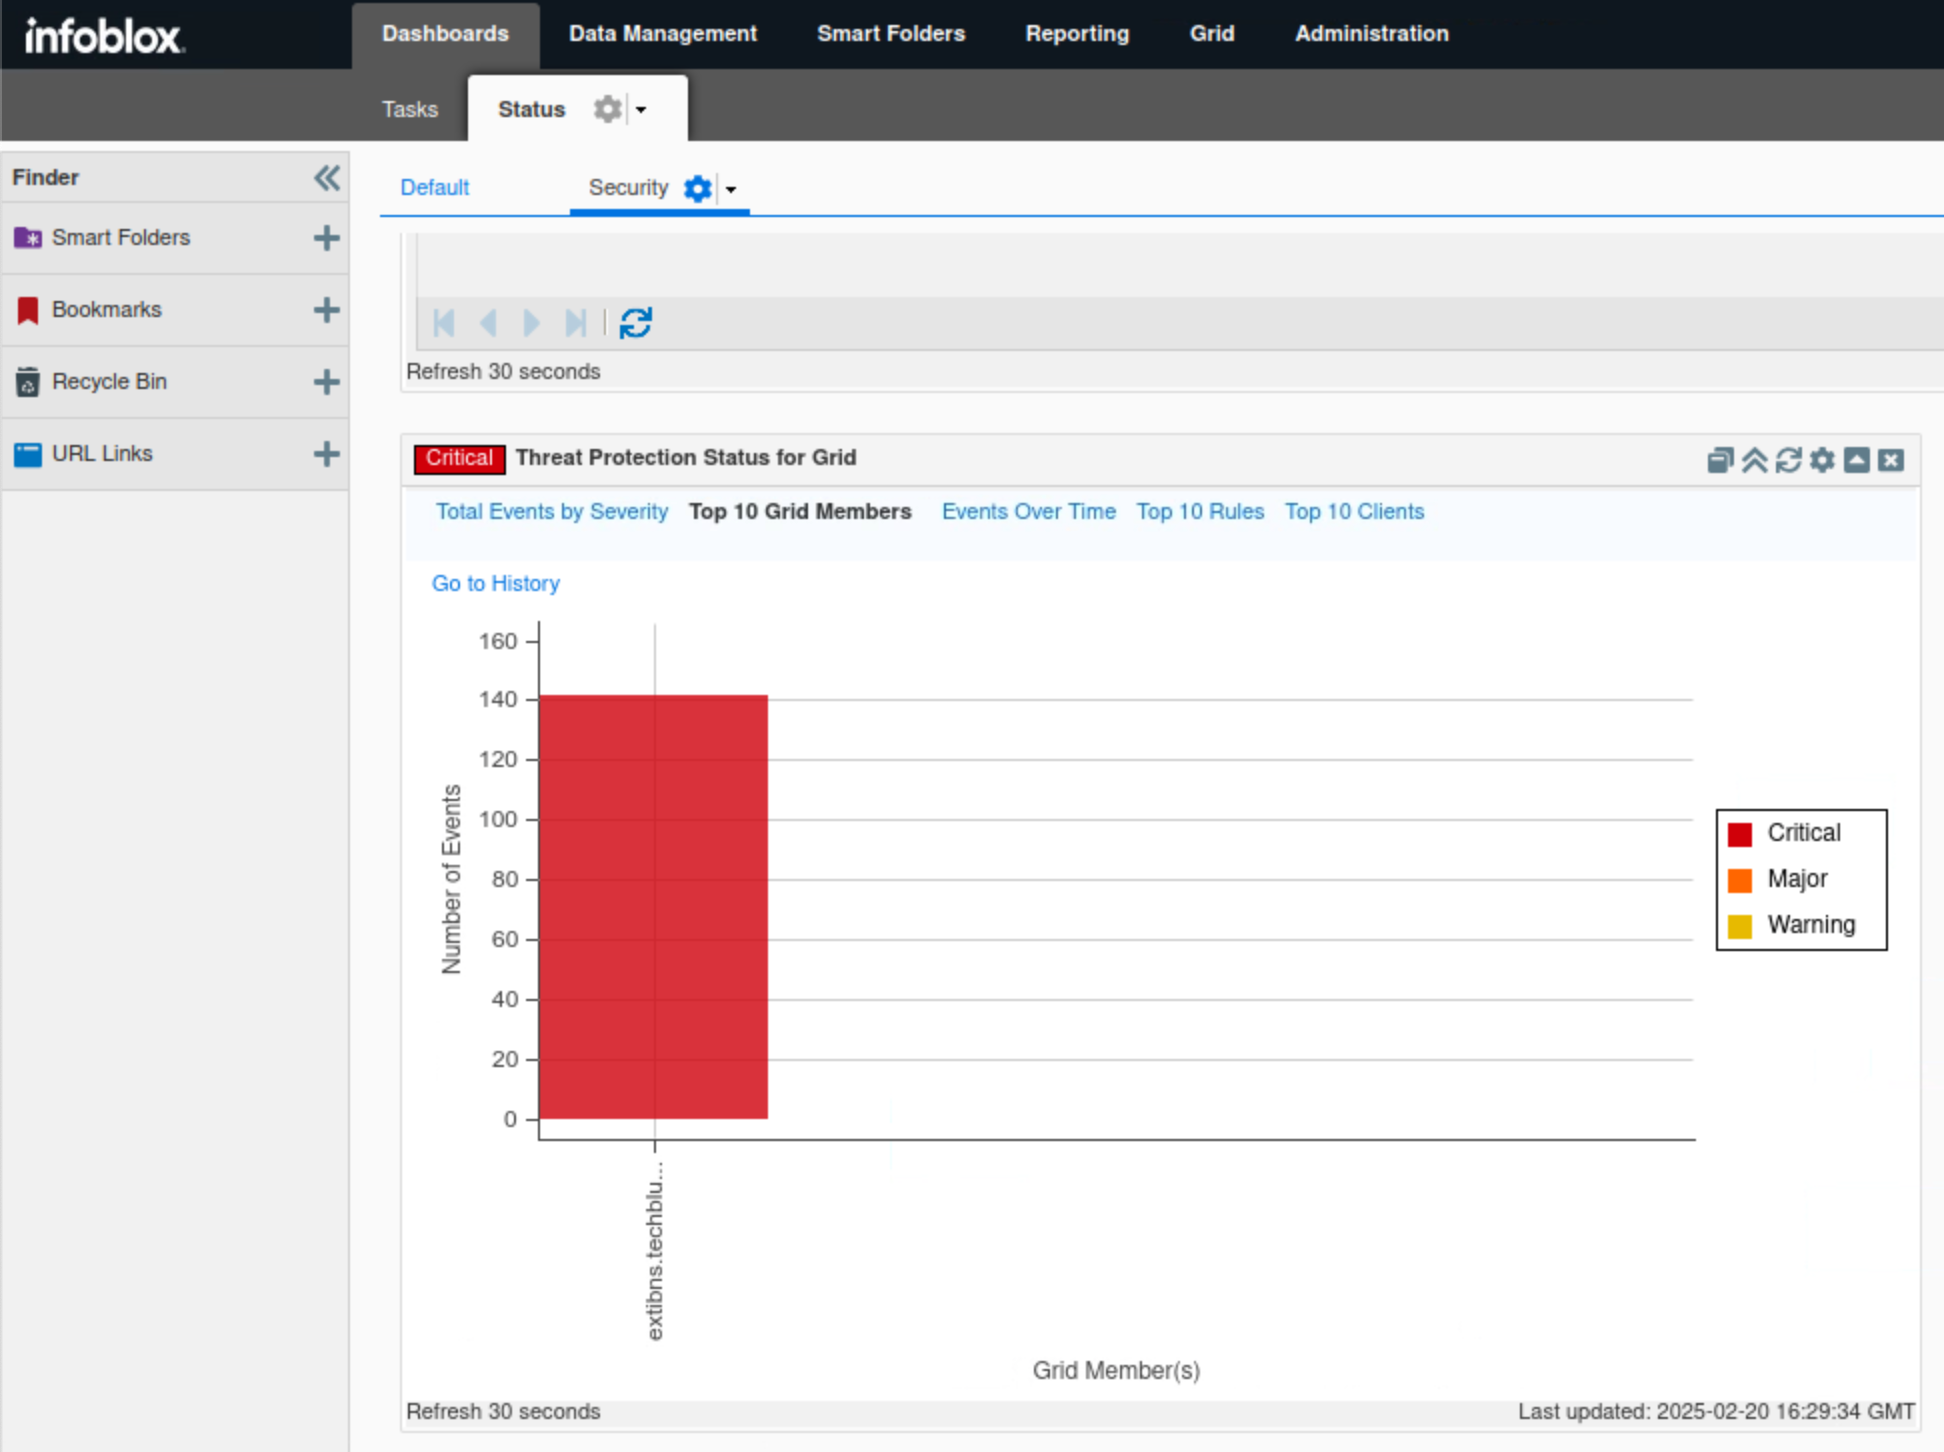
Click Top 10 Grid Members.
-
This tab, in bar chart format, breaks down the number of events triggered by each Threat Protection-enabled member.
-
In this example, only extibns.techblue.net is shown since it is the only Threat Protection-enabled member.
-
-
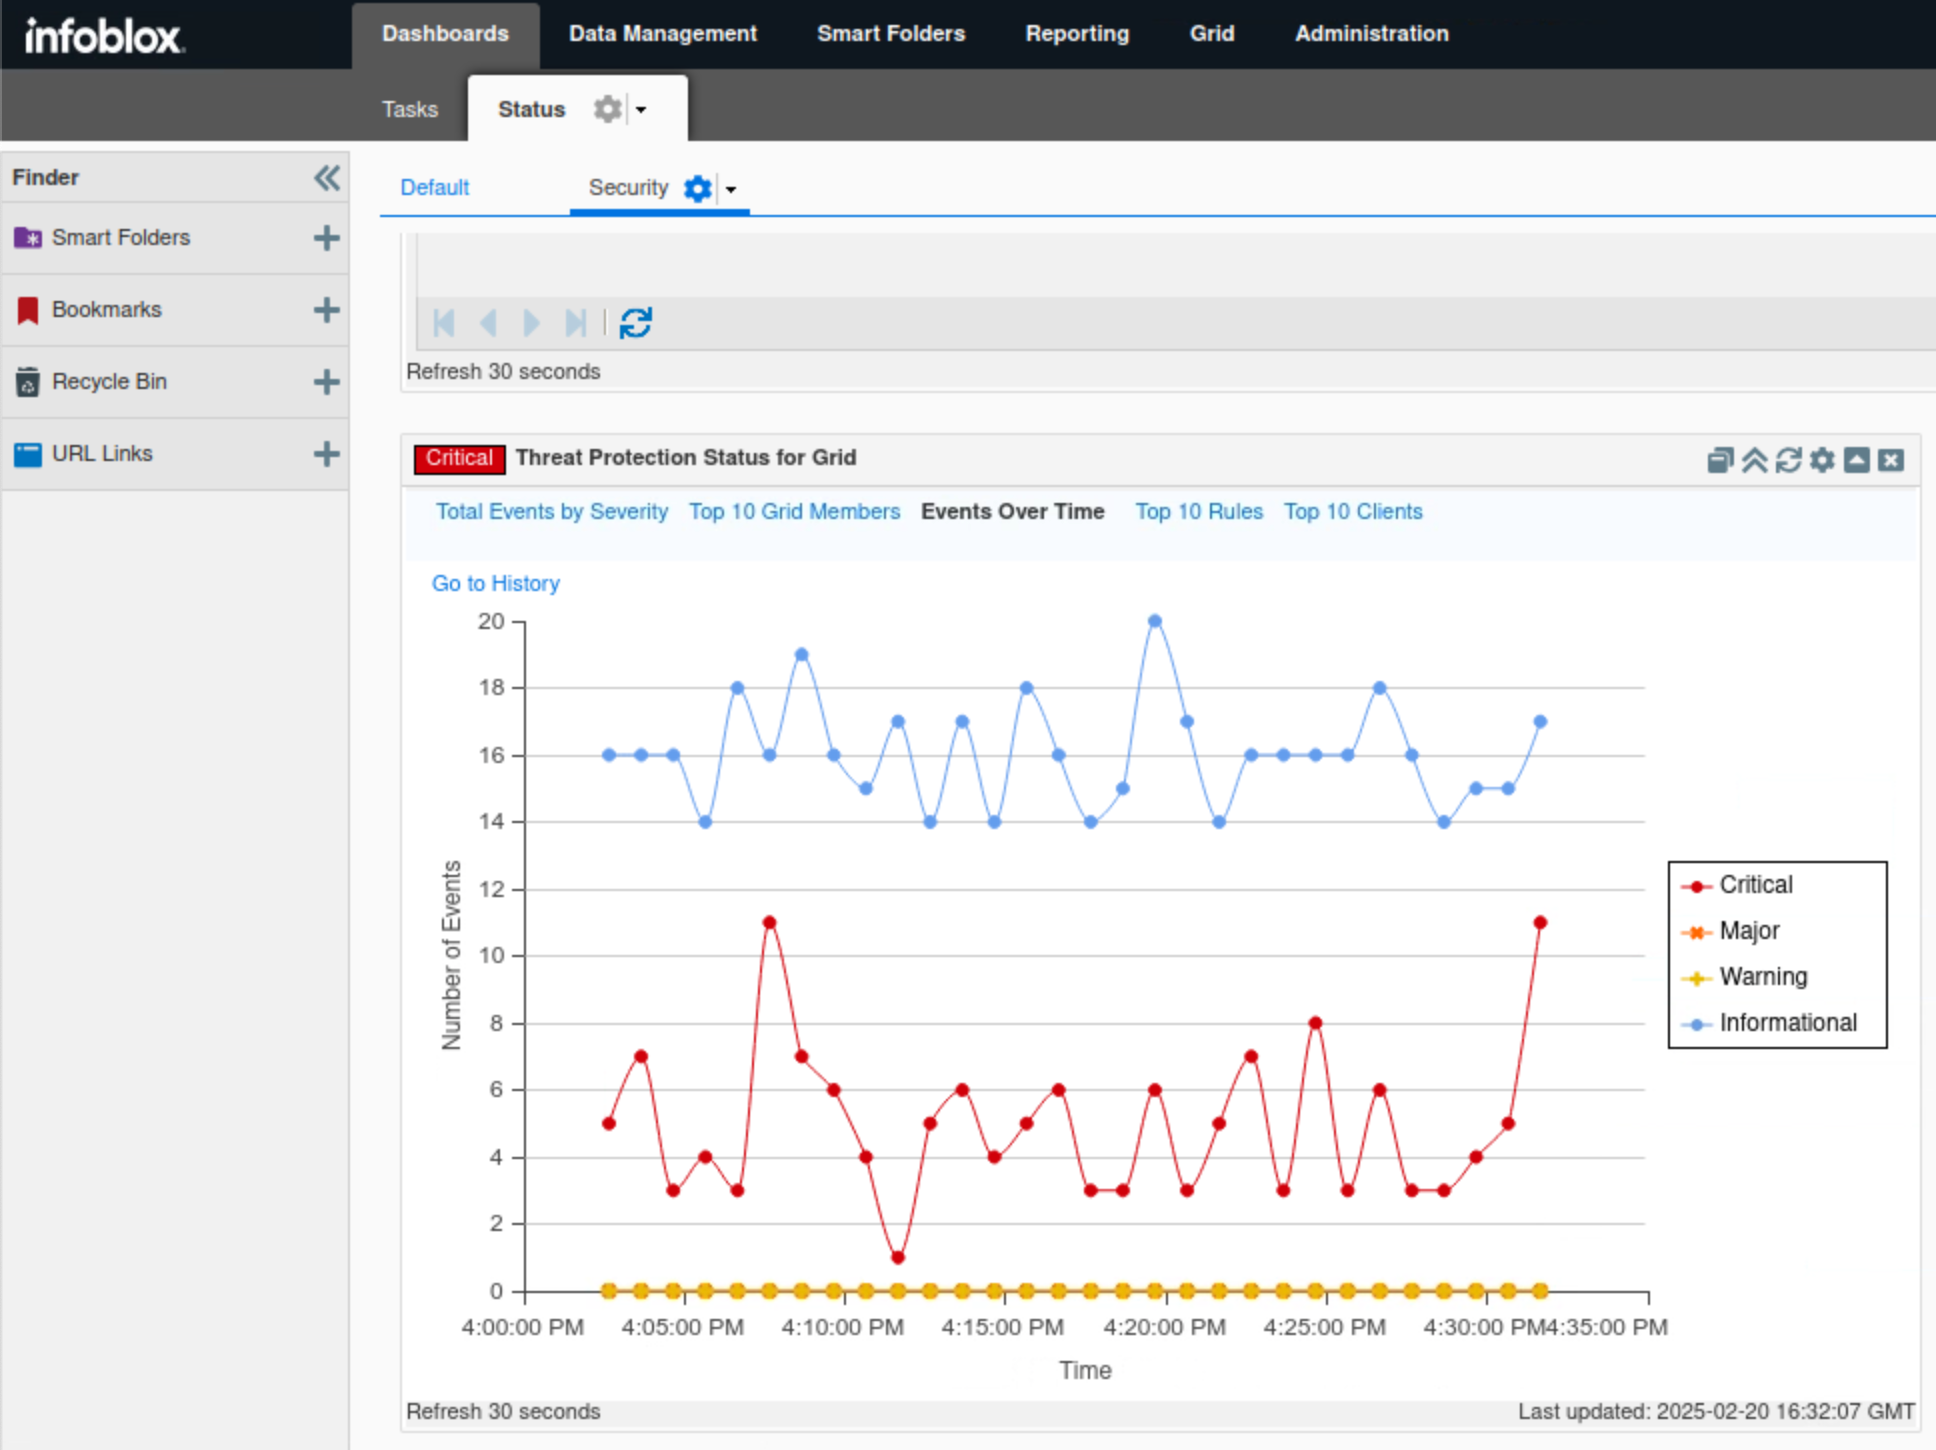
Click Events Over Time.
-
This tab displays a timeline for each event category, helping to visualize the DNS load on the Grid.
-
In this example, we can visualize both available event categories, Critical and Informational, based on the number of events triggered at certain times.
-
-
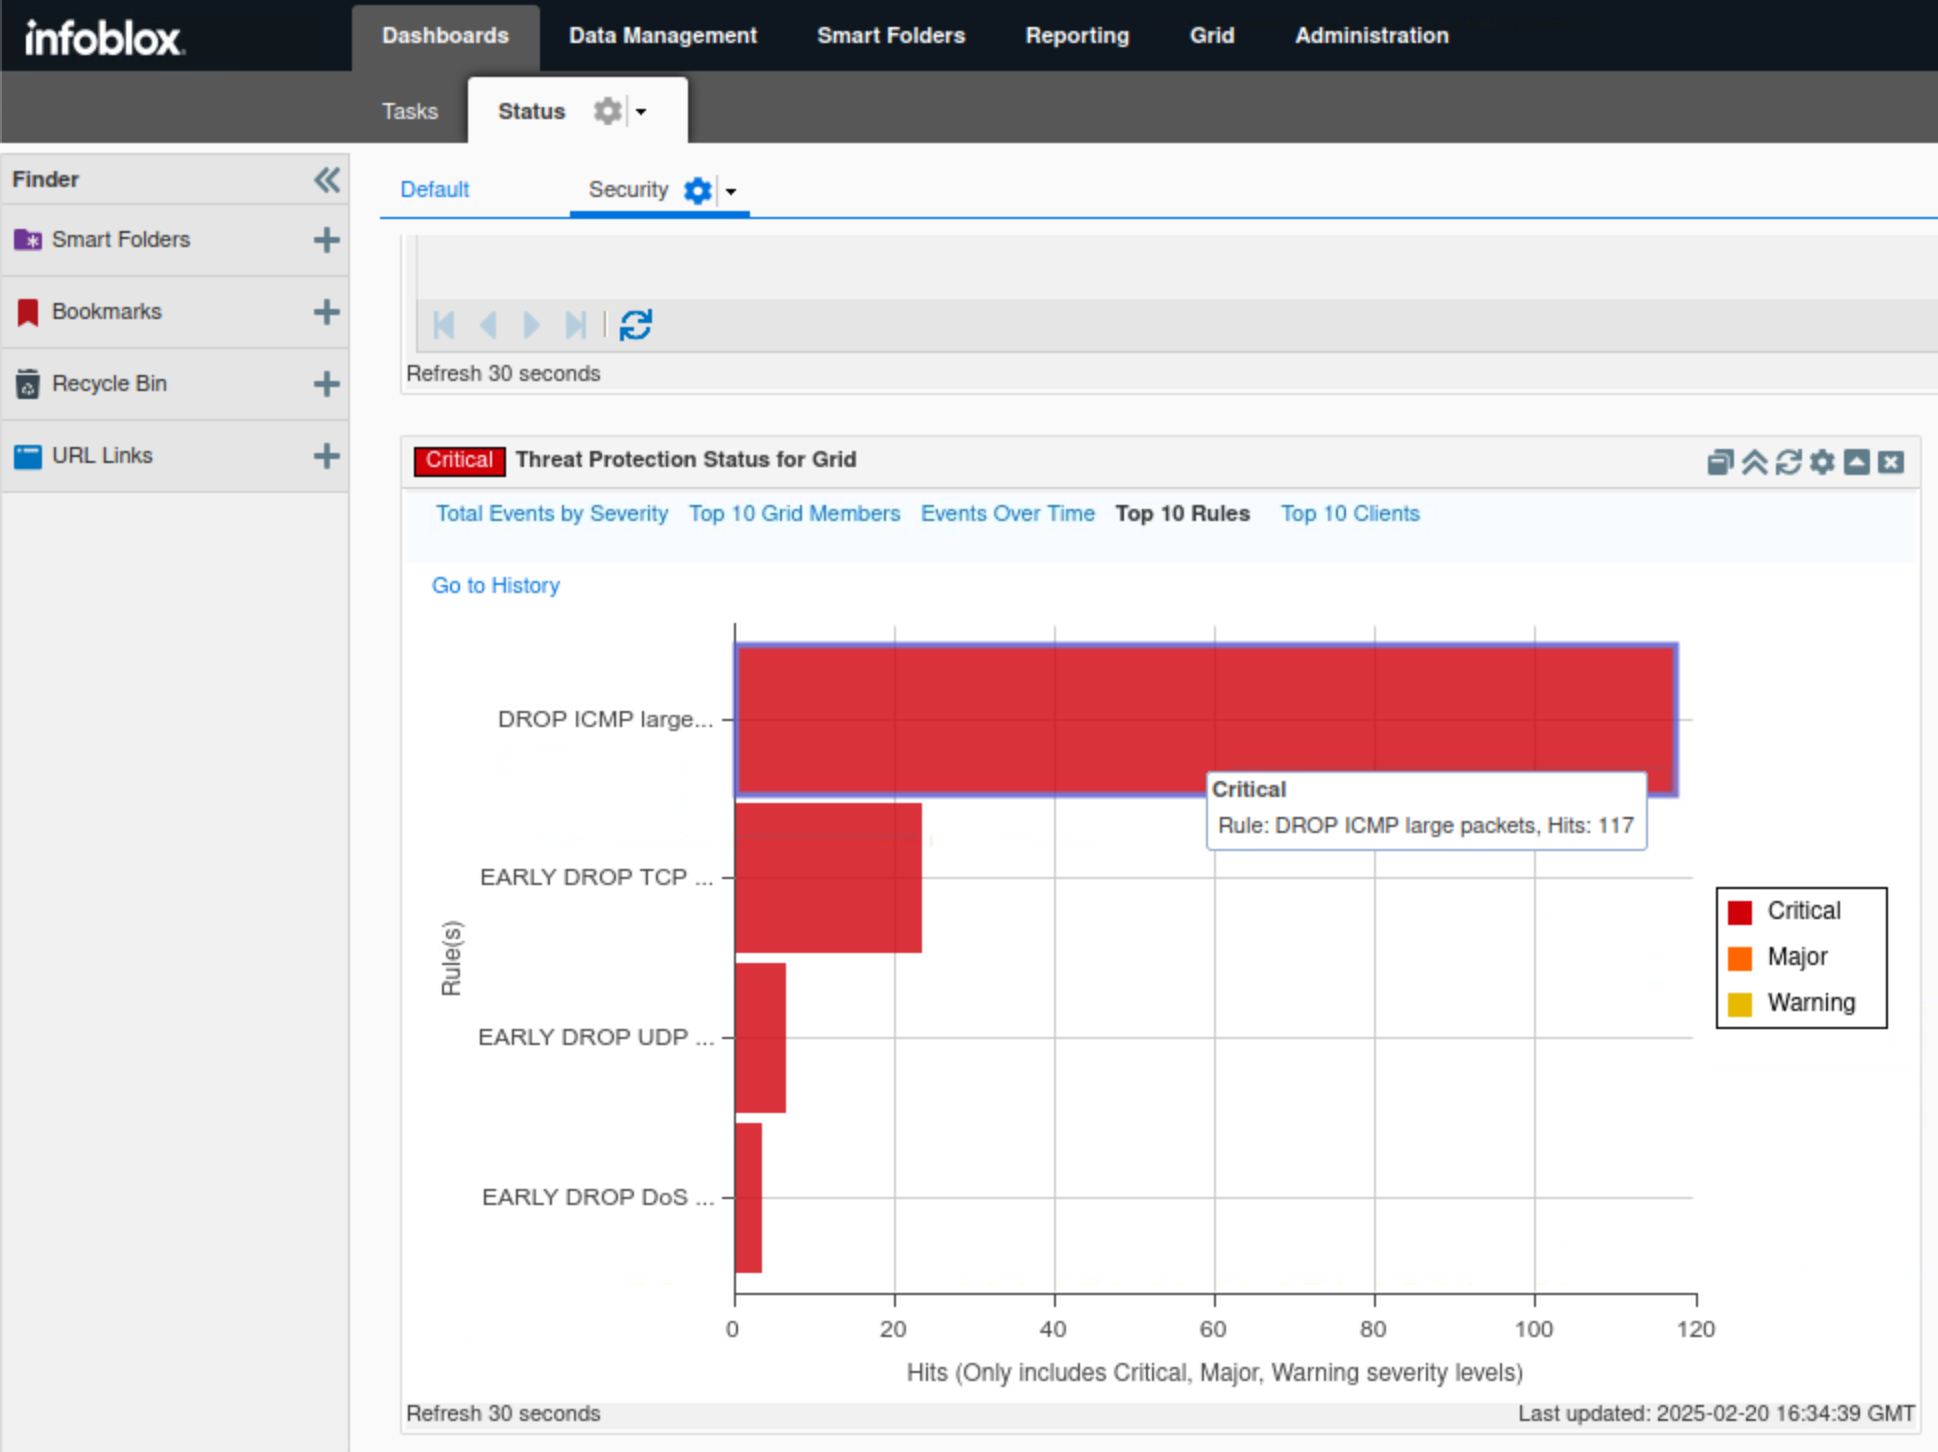
Click Top 10 Rules.
-
This tab, in bar chart format, breaks down the number of events triggered by each Threat Protection rule category.
-
In this example, we can see that the DROP ICMP LARGE PACKETS category is topping the charts with 117 critical hits.
-
-
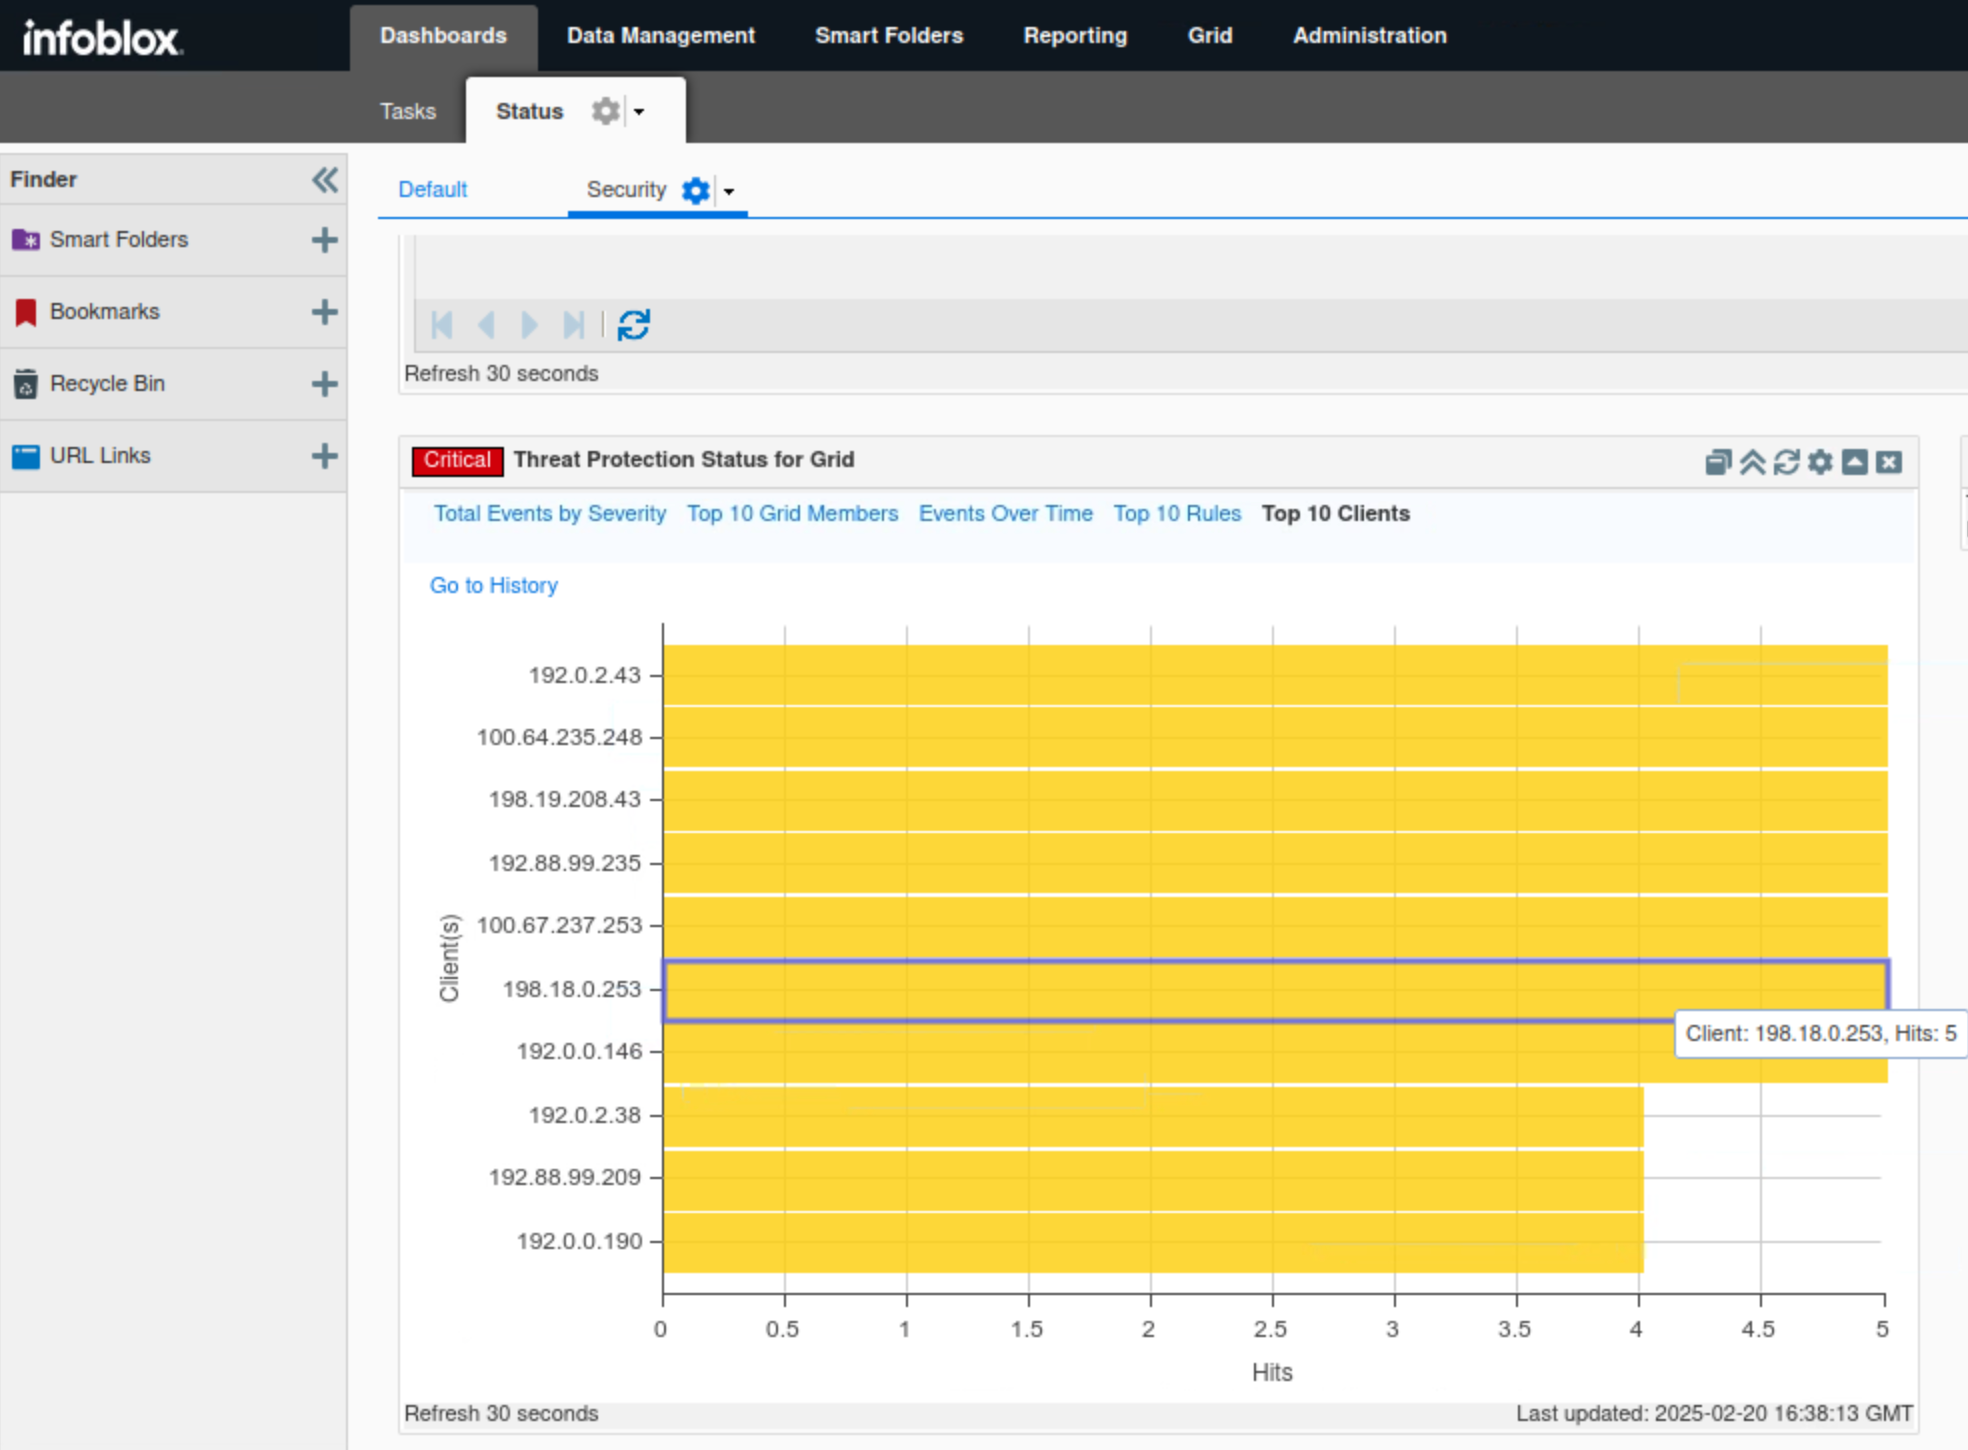
Click Top 10 Clients.
-
This tab, in bar chart format, breaks down the number of events triggered by each source.
-
In this example, all seven IP addresses 192.0.2.43, 100.64.235.248, 198.19.208.43, 192.88.99.235, 100.67.237.253, 198.16.0.253 and 192.0.0.146 are tied with 5 hits each.
-
-
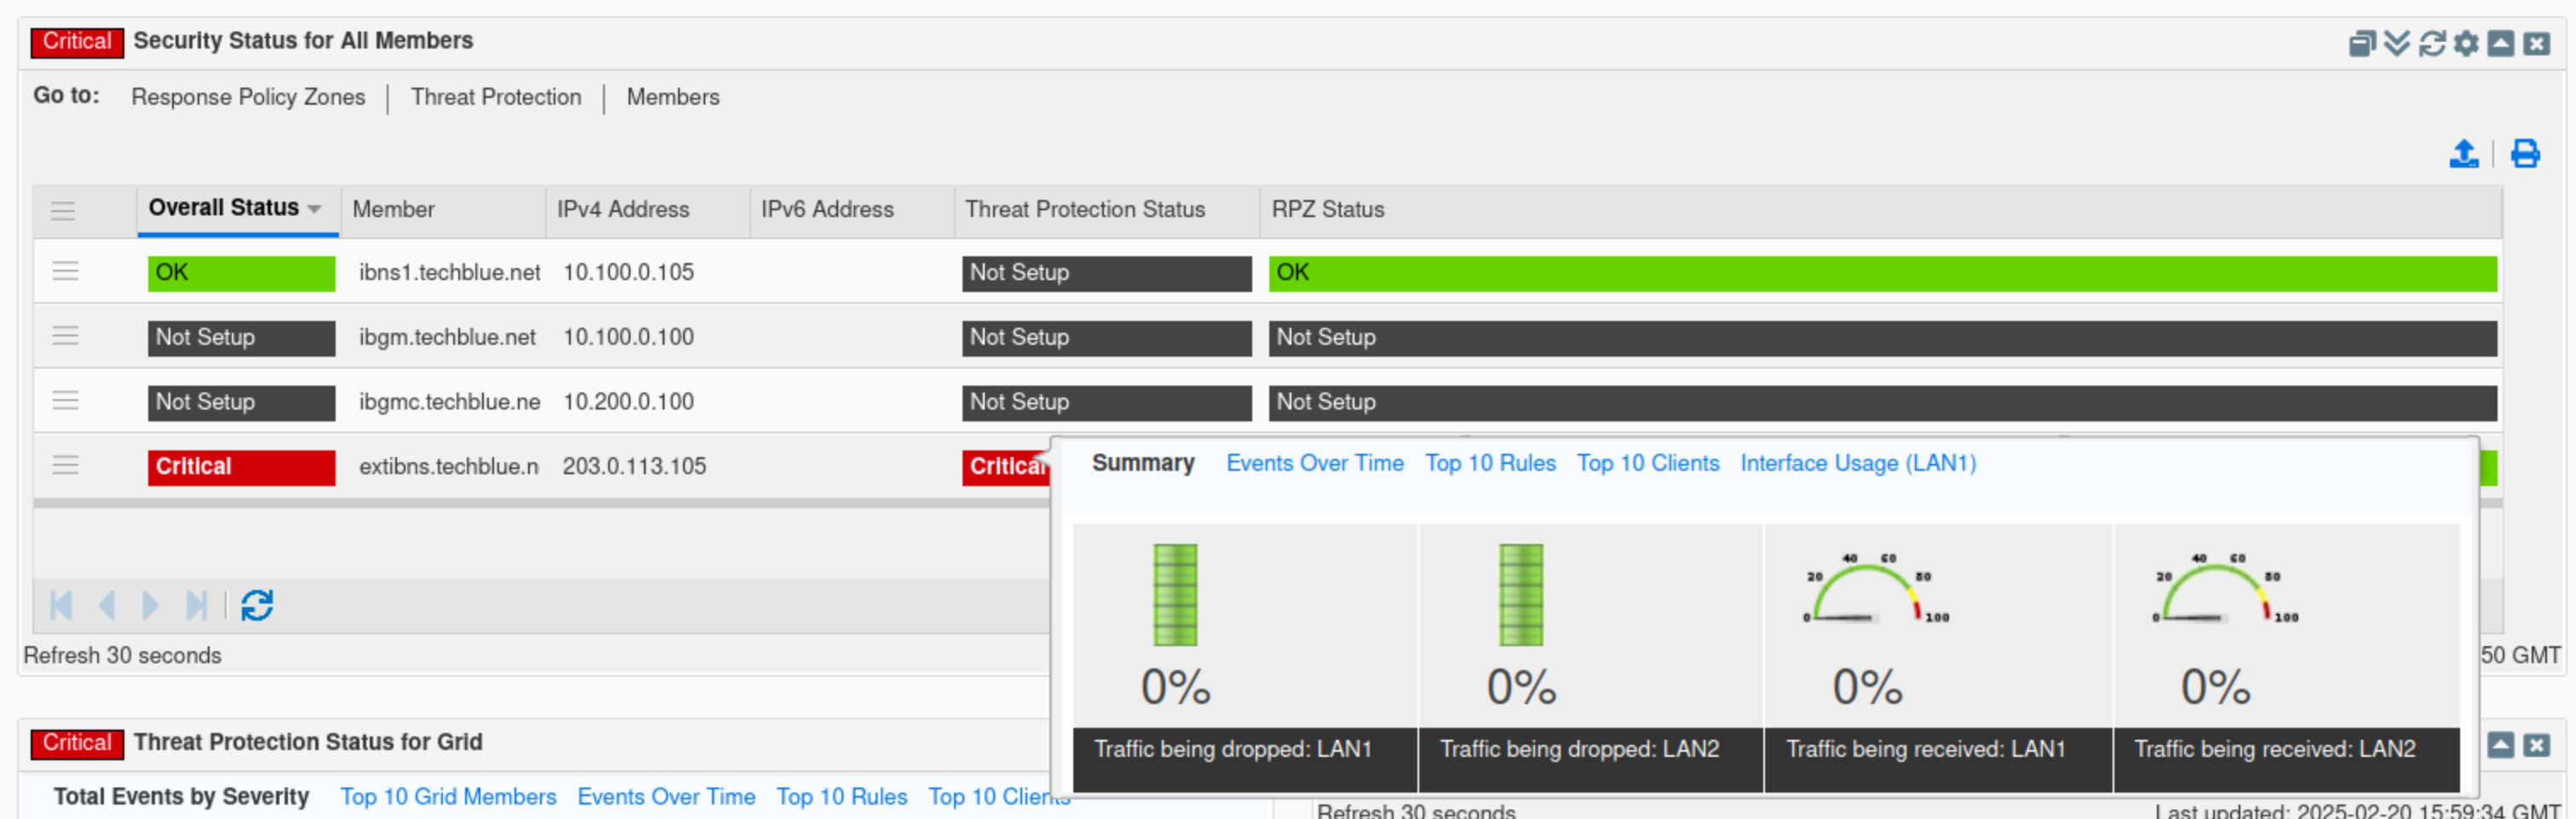
Find the Threat Protection Status for member widget.
-
Click the cog wheel icon.
-
Select extibns.techblue.net.
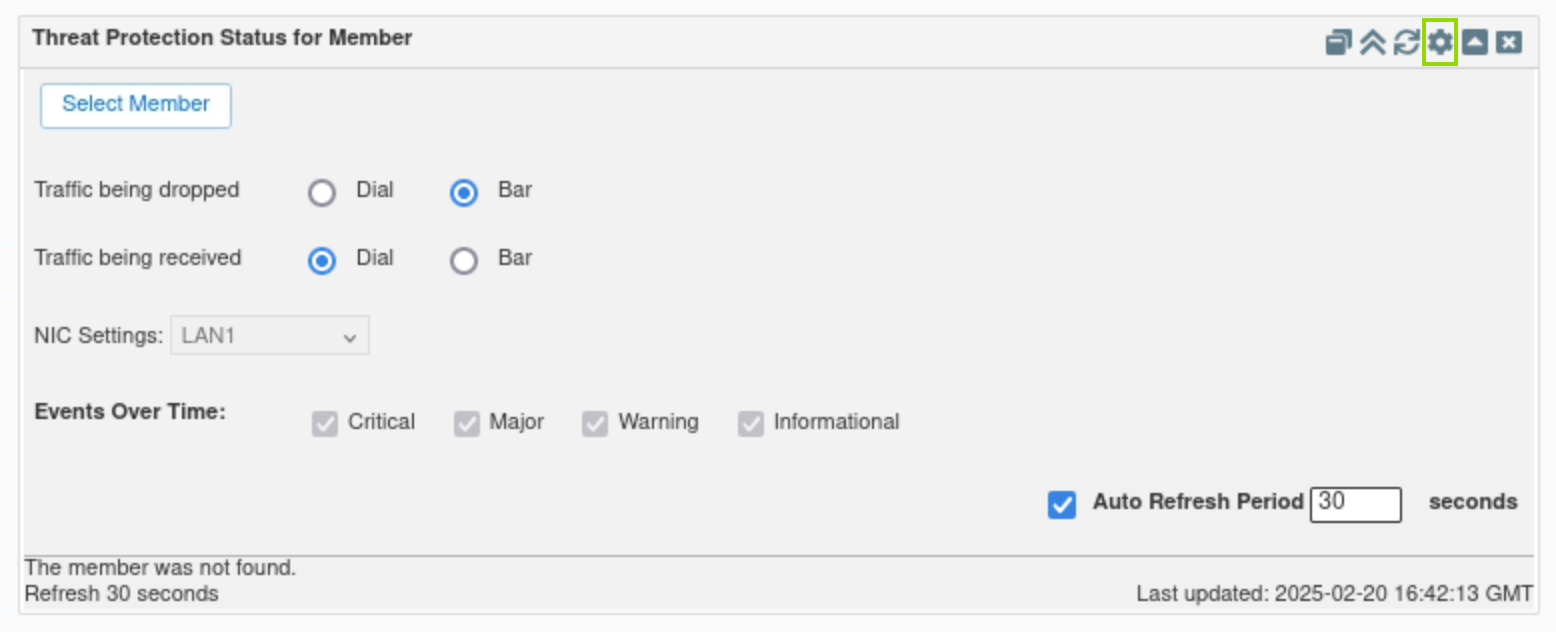
-
This widget displays information similar to the Threat Protection status for the Grid, but for a selected Grid member.
-
The widget contains five tabs: Summary, Events Over Time, Top 10 Rules, Top 10 Clients, and Interface Usage.
-
Task 27 Solution: Investigate the available Reporting Server Dashboards for Threat Protection (ADP)
In this task, we will use the reporting server to explore default reports and dashboards, adding historical context to recent events. The NIOS security dashboard shows current grid activity, while the Reporting Server provides historical data. We will focus on analyzing which Threat Protection (ADP) categories were triggered and how many times each was triggered, identifying affected Grid members and the sources of the attack. Then, generate a PDF with our findings to report to management.
-
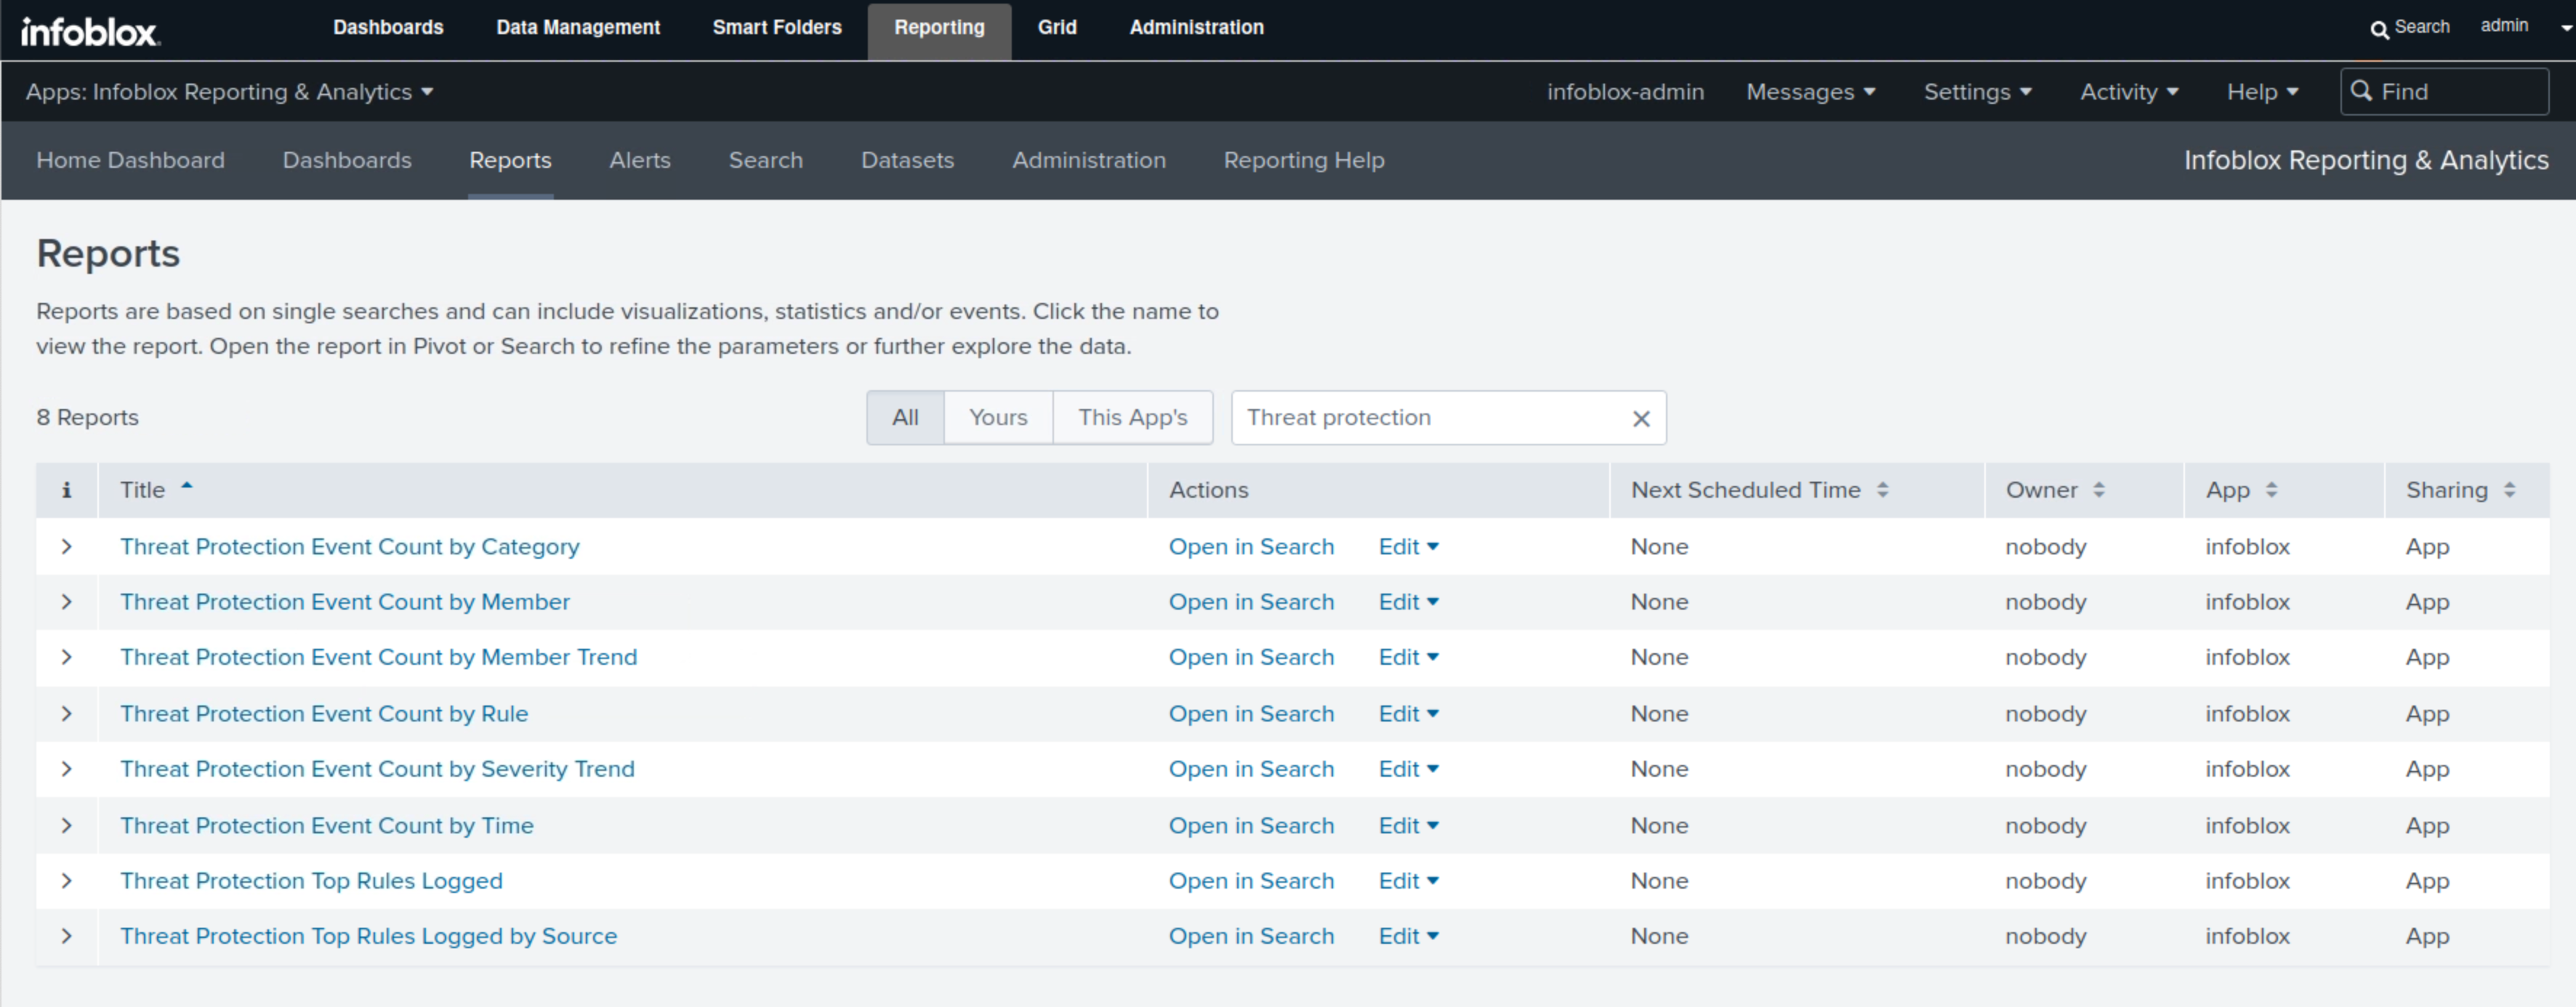
Navigate to Reporting.
-
Click on Reports.
-
Type threat protection in the filter box.
-
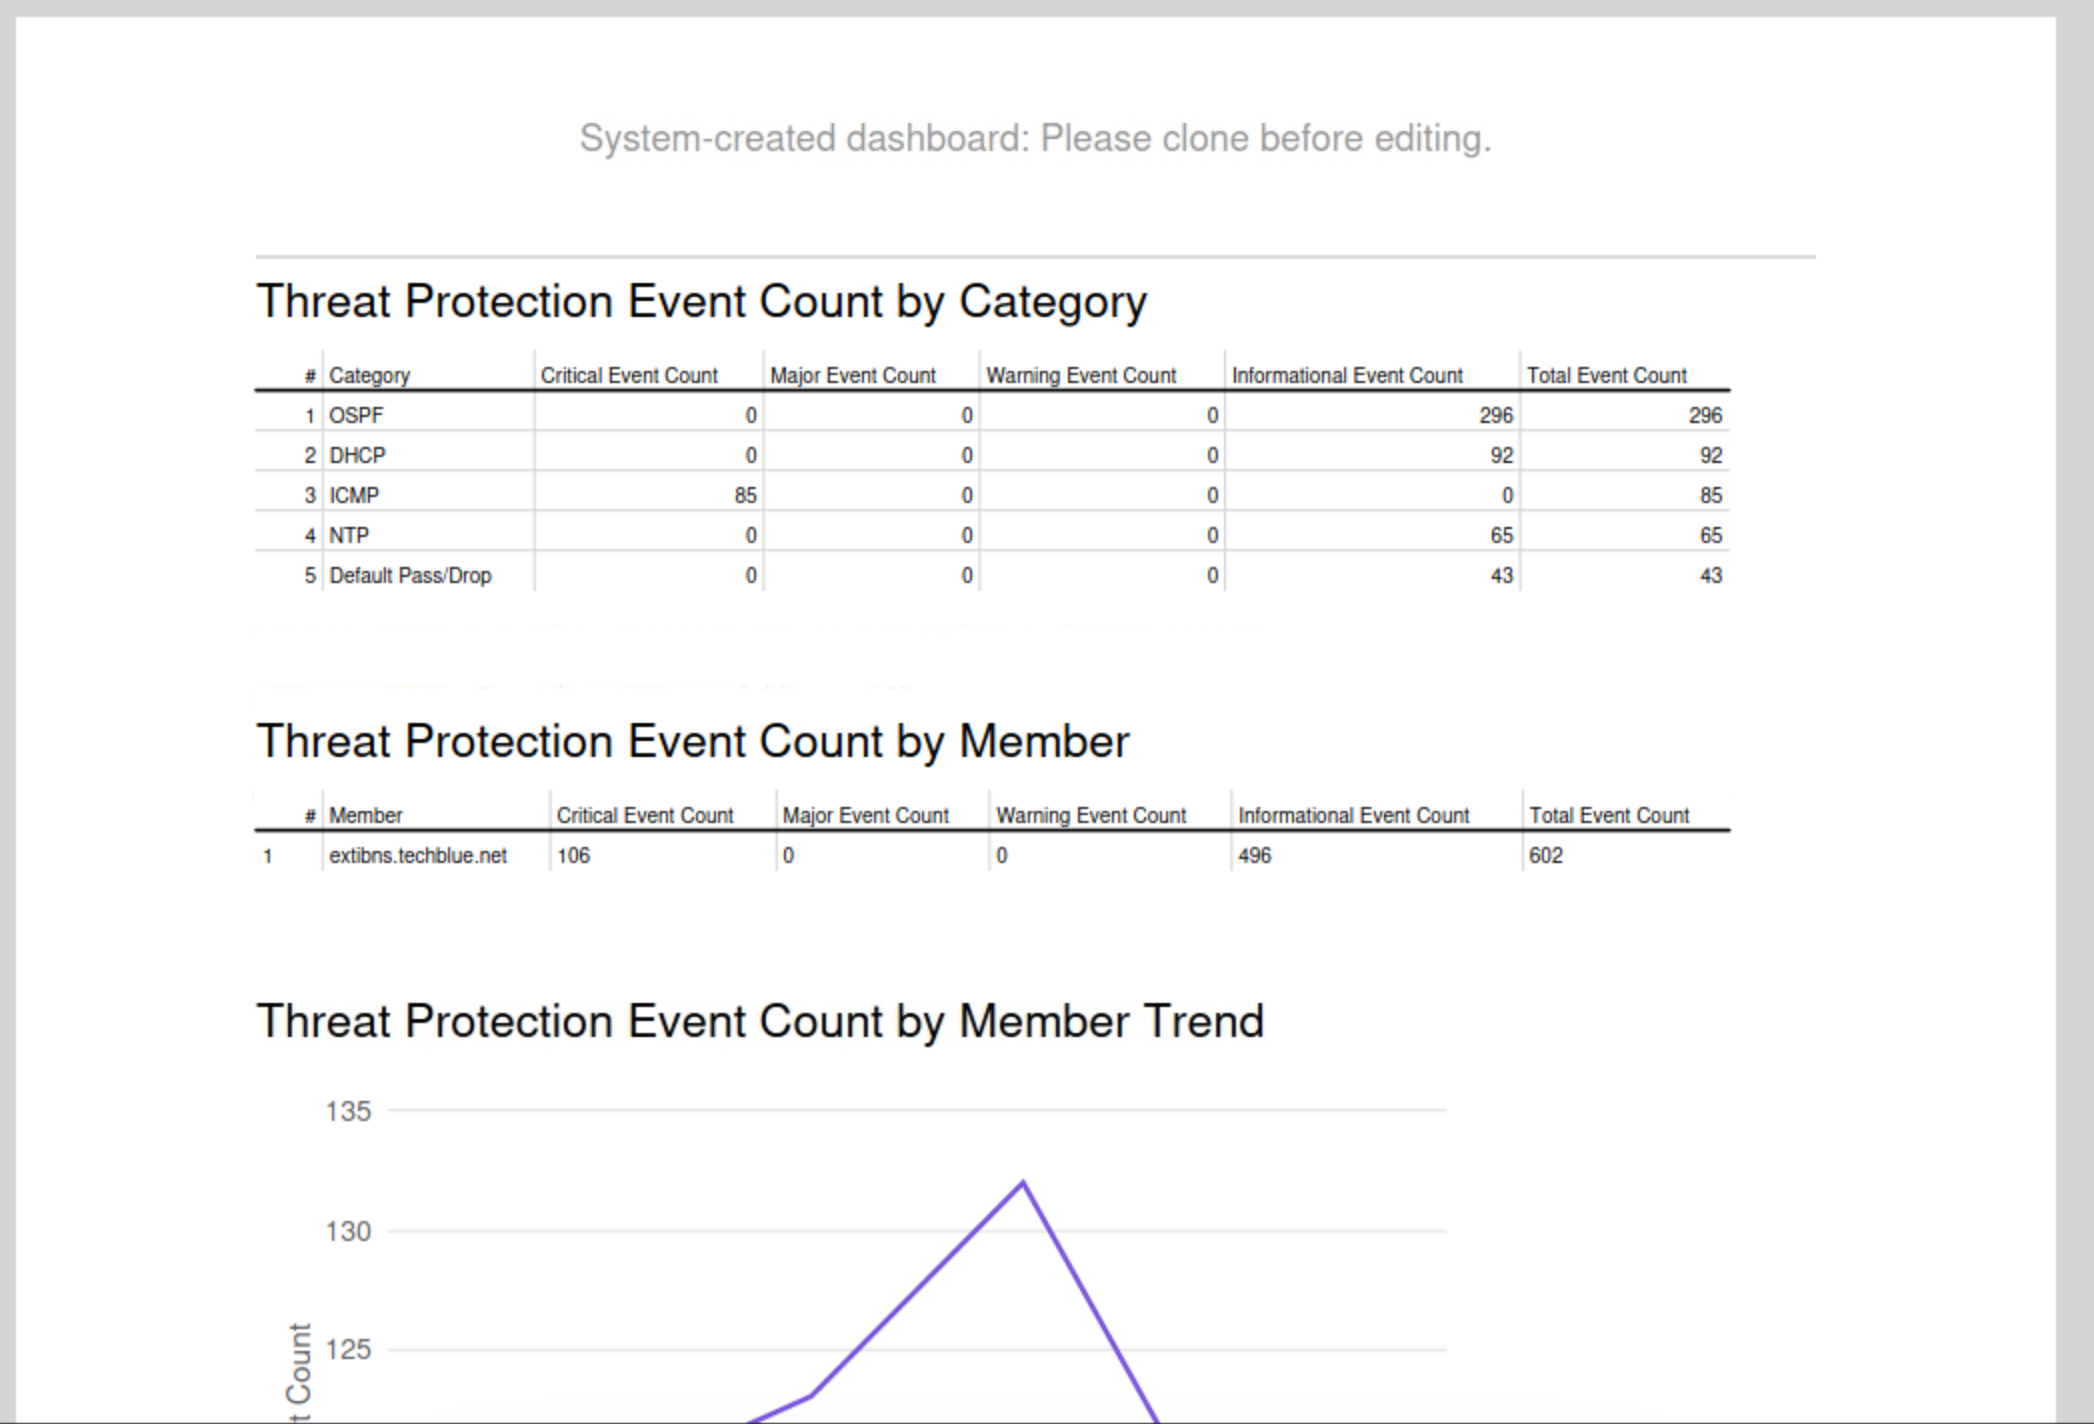
There are eight default Reports; in this lab, we will focus on four of them: Threat Protection Event Count by category, Threat Protection Event Count by member, Threat Protection Event Count by rule, and Threat Protection Event Count by time.
-
-
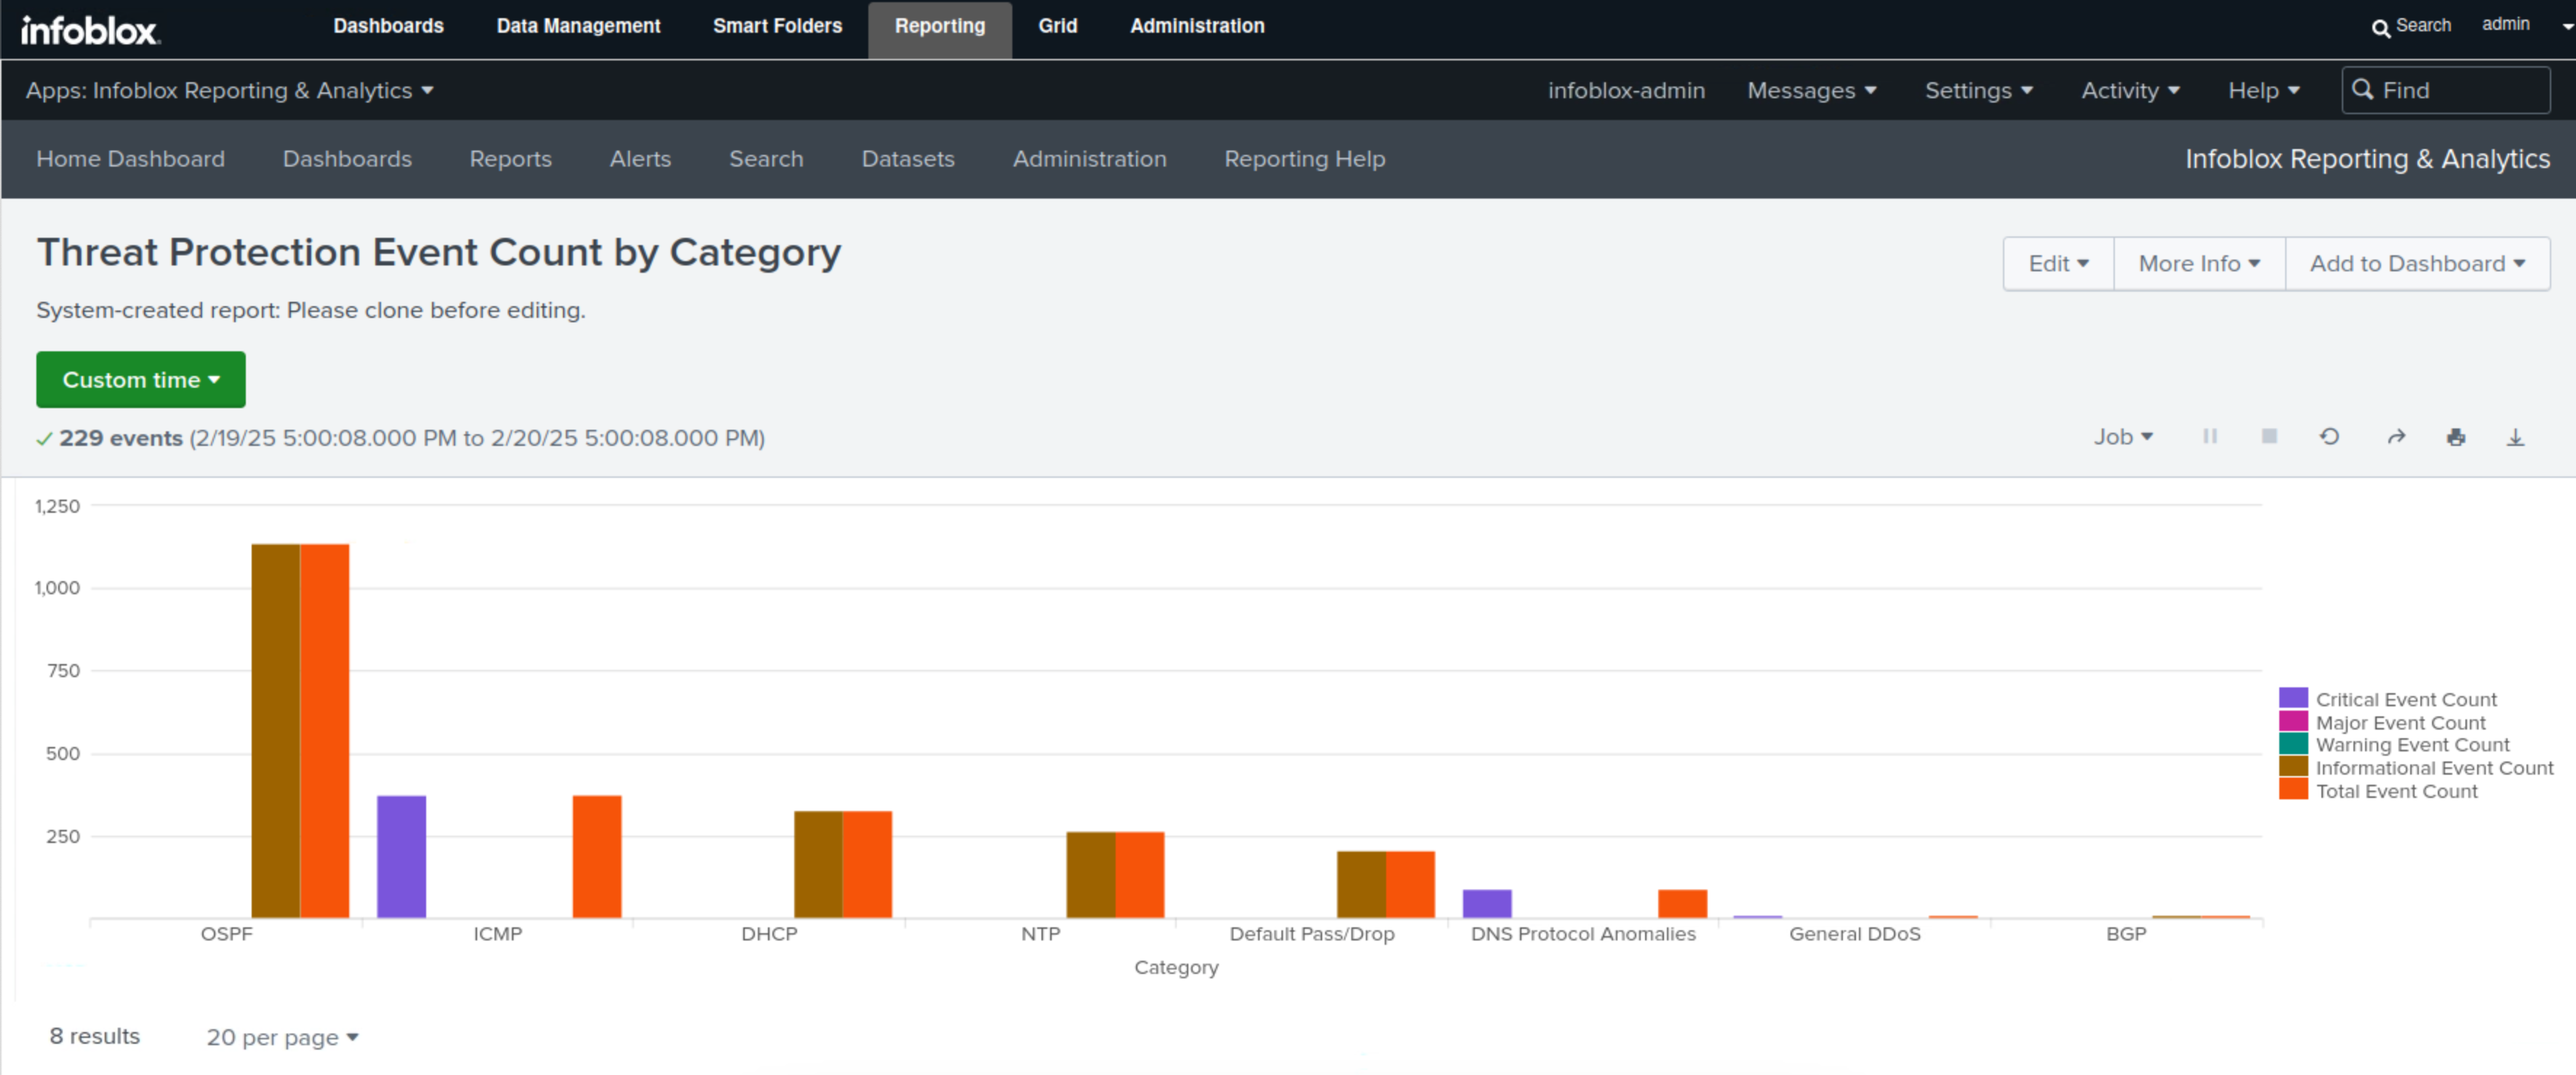
Select Threat Protection Event Count by category.
-
This report displays the total number of Threat Protection (ADP) events per category and severity level in bar charts and tables.
-
In this example, we can see that the categories of OSPF, ICMP, and DHCP are at the top, and we can also see the breakdown of the number of events per severity level for each category.
-
-
Repeat Steps 5 and 6 for the following reports:
-
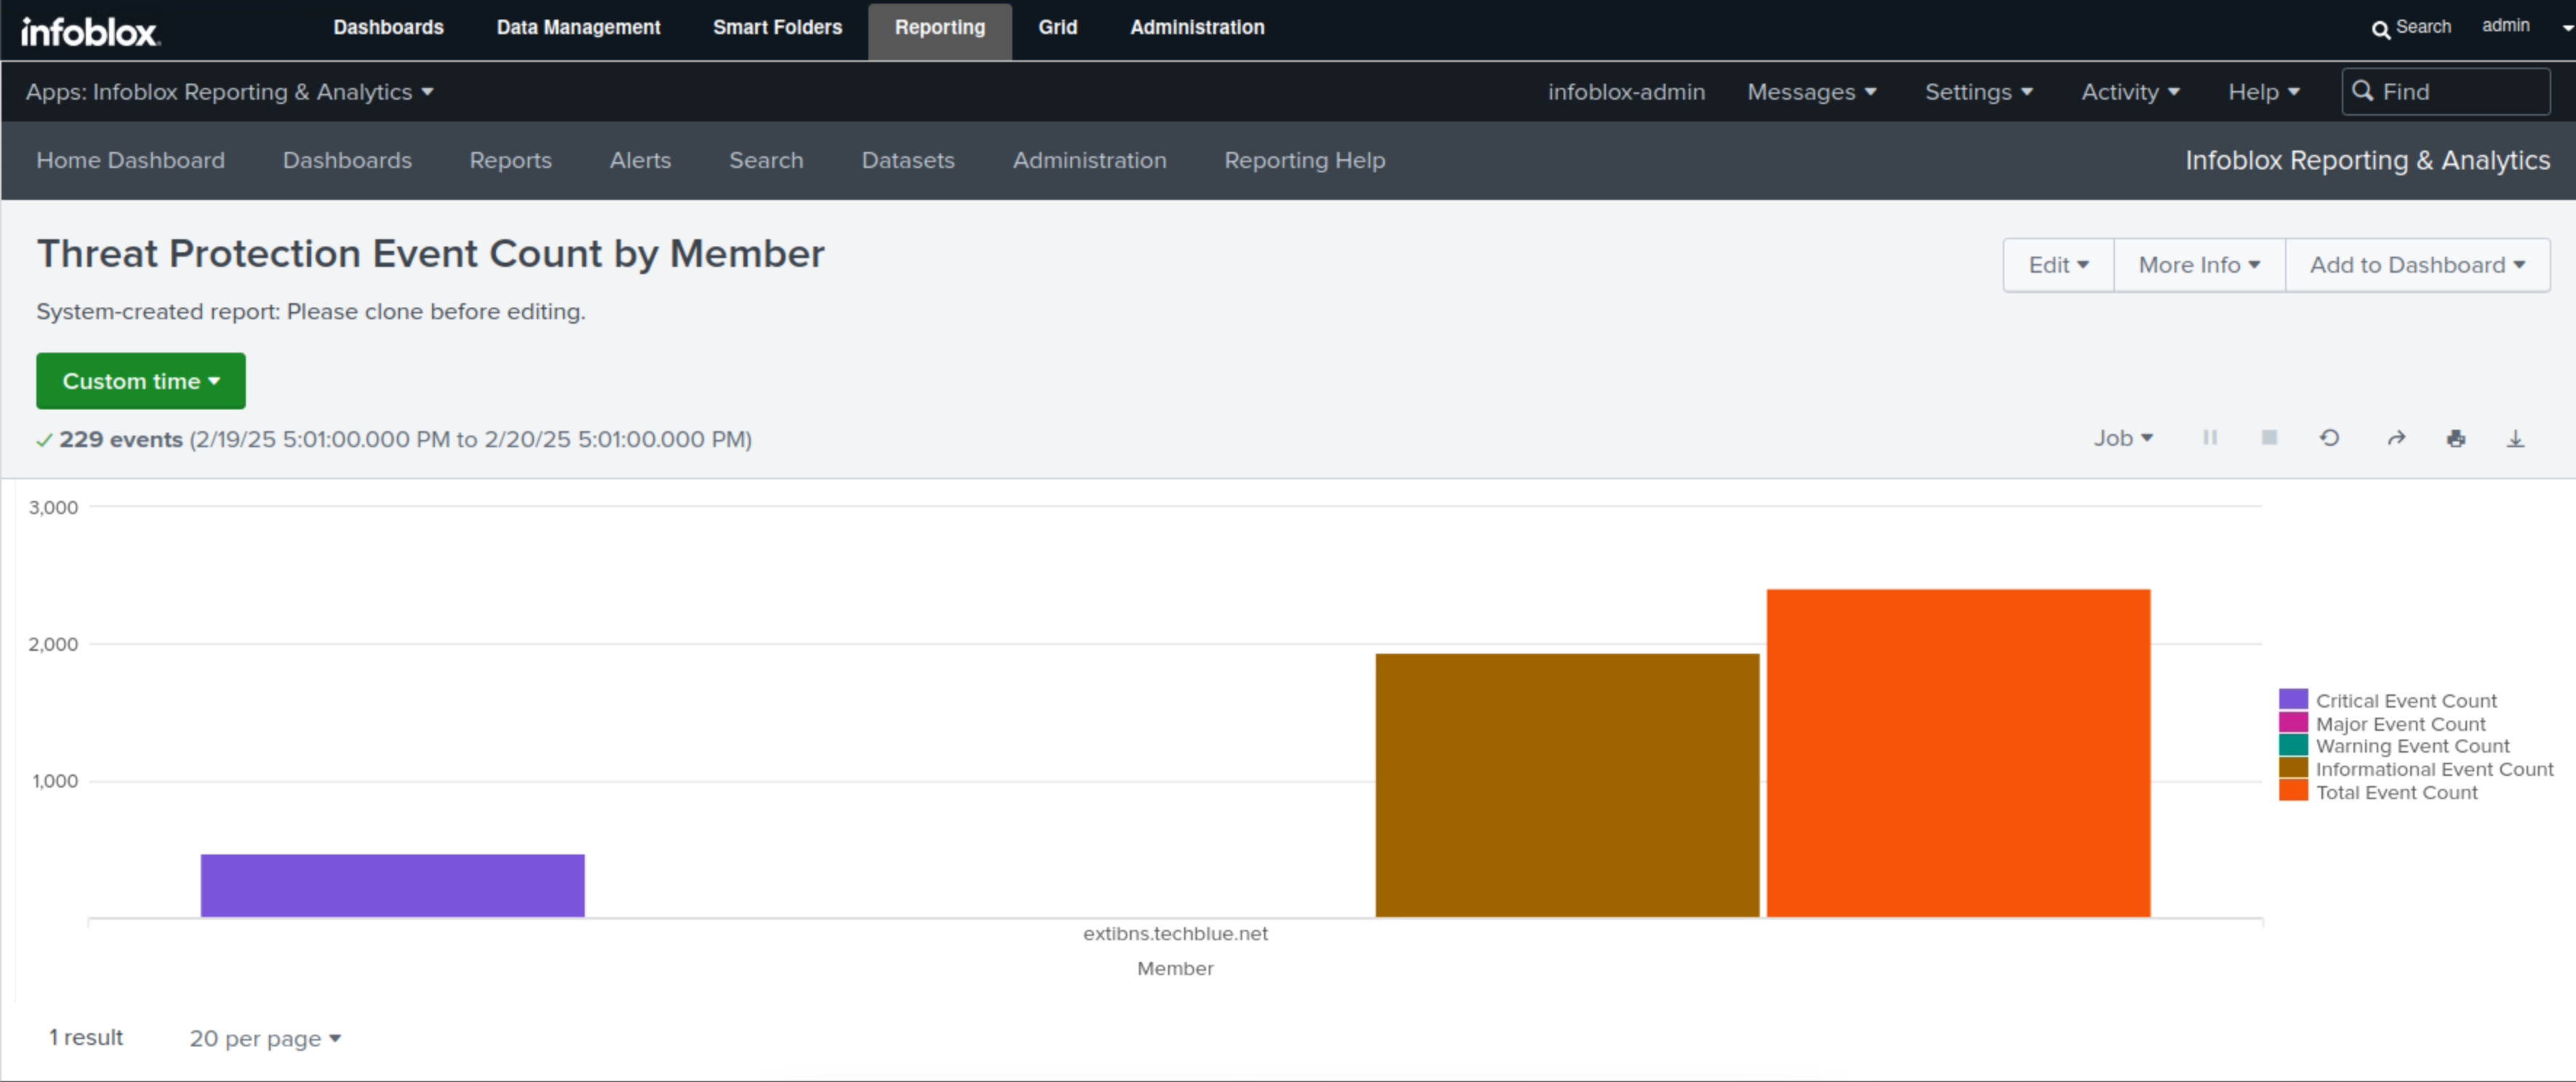
Select Threat Protection Event Count by member.
-
This report displays each member's total Threat Protection (ADP) event count, broken down into severity levels in bar charts and tables.
-
In this example, we only have one Threat Protection (ADP) enabled member, extibns.techblue.net. The entire graph will be dedicated to it, and we can clearly see the total number of events represented by the orange bar, along with its breakdown into different severity levels: critical, represented in purple, and informational, represented in brown.
-
-
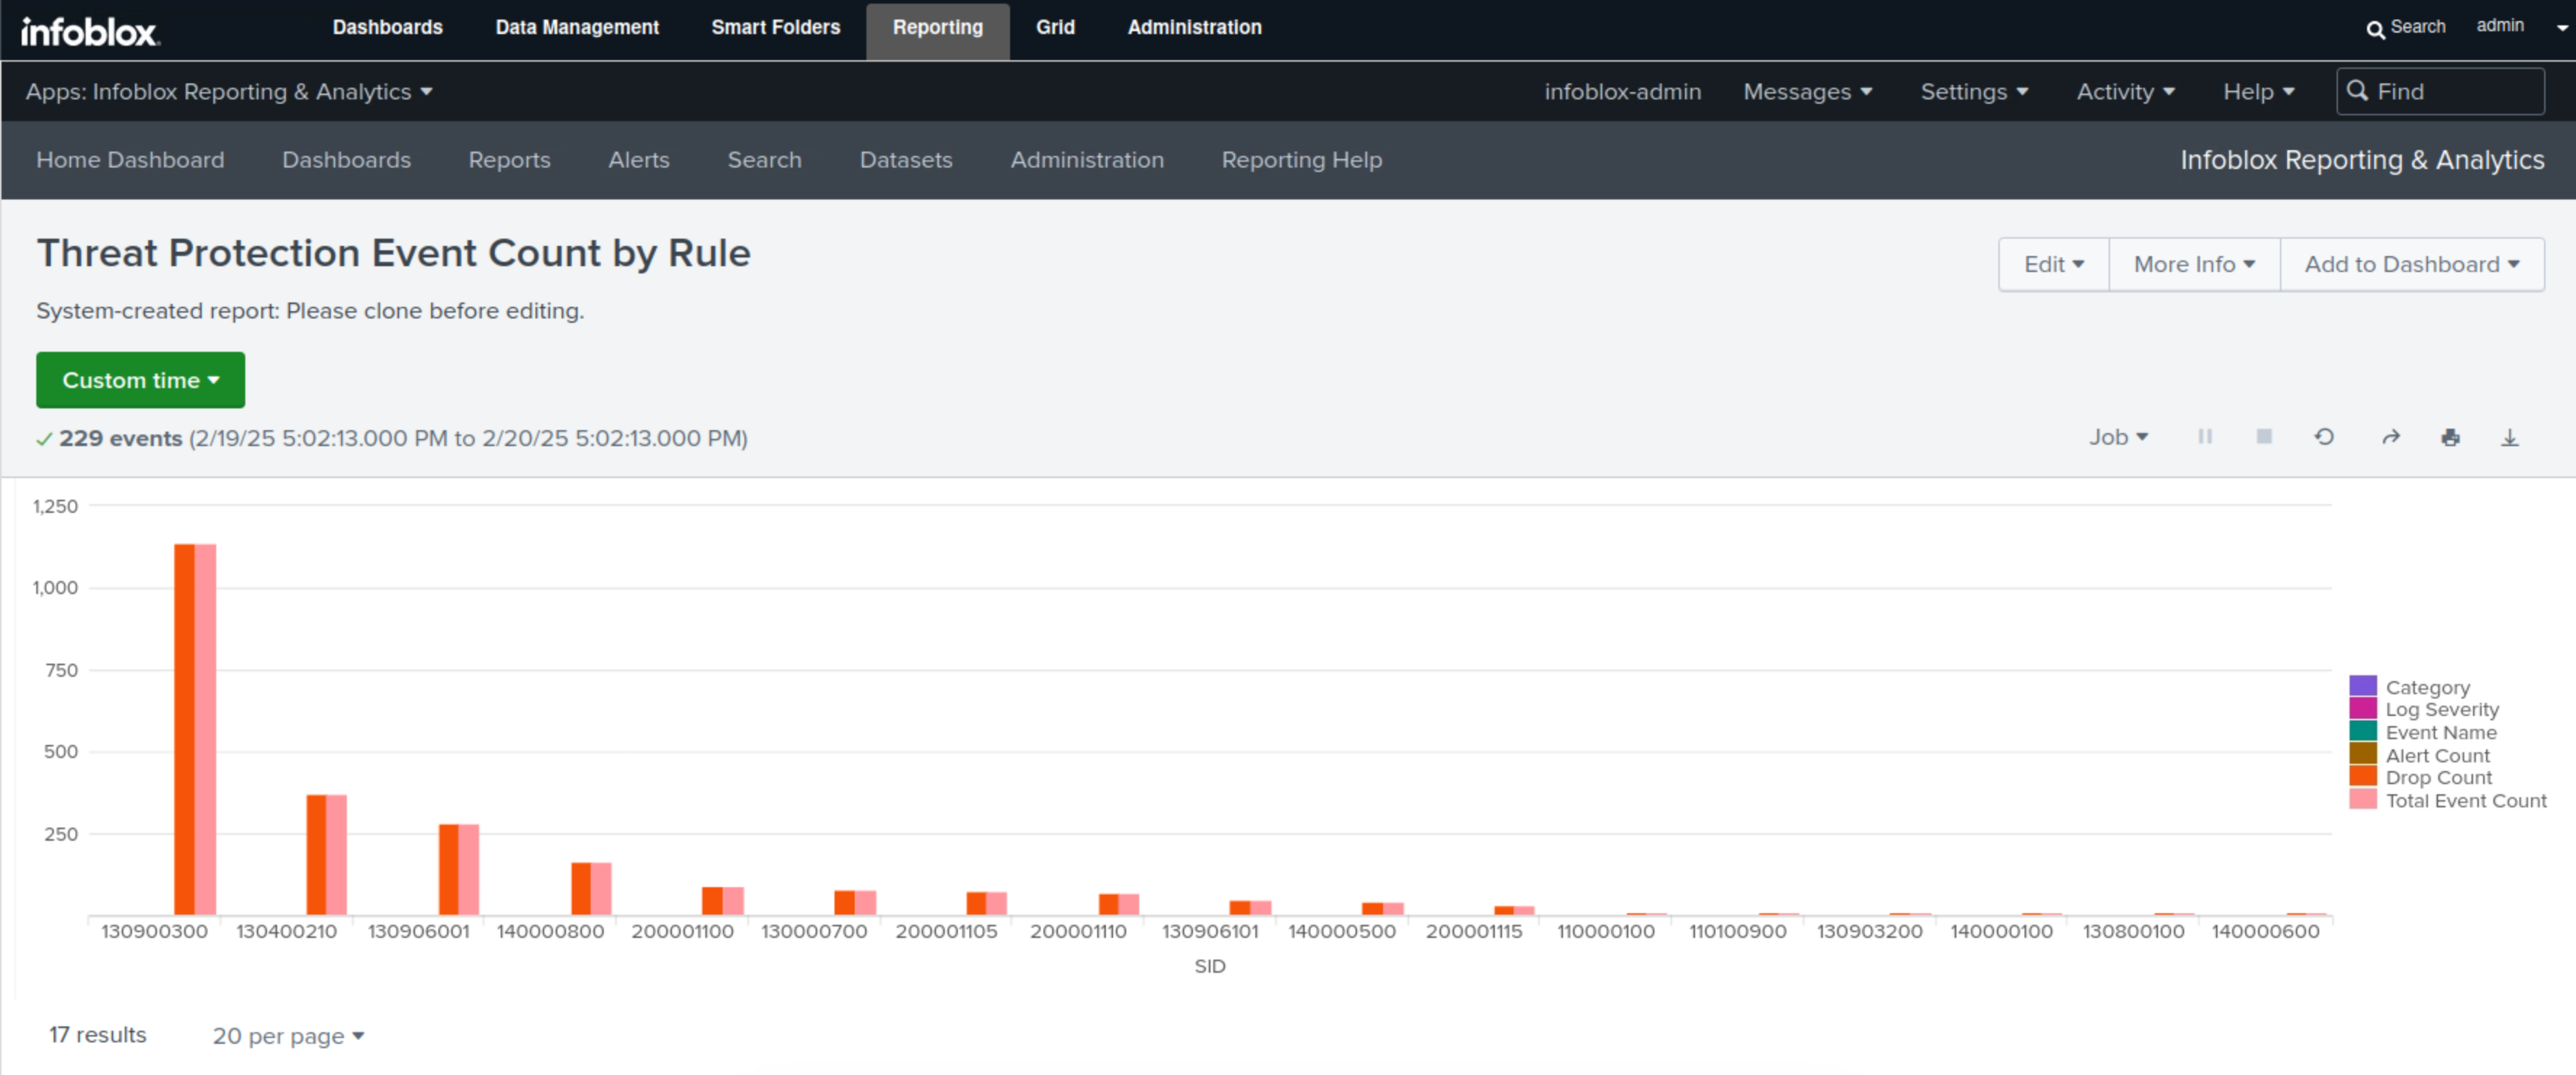
Select Threat Protection Event Count by rule.
-
This report displays all the Threat Protection (ADP) rules, the total number of triggers for each rule, and the actions taken by each rule in bar charts and tables.
-
In this example, rules 130900300 and 130400210 are the two most frequently triggered, with the action of 'Drop'.
-
-
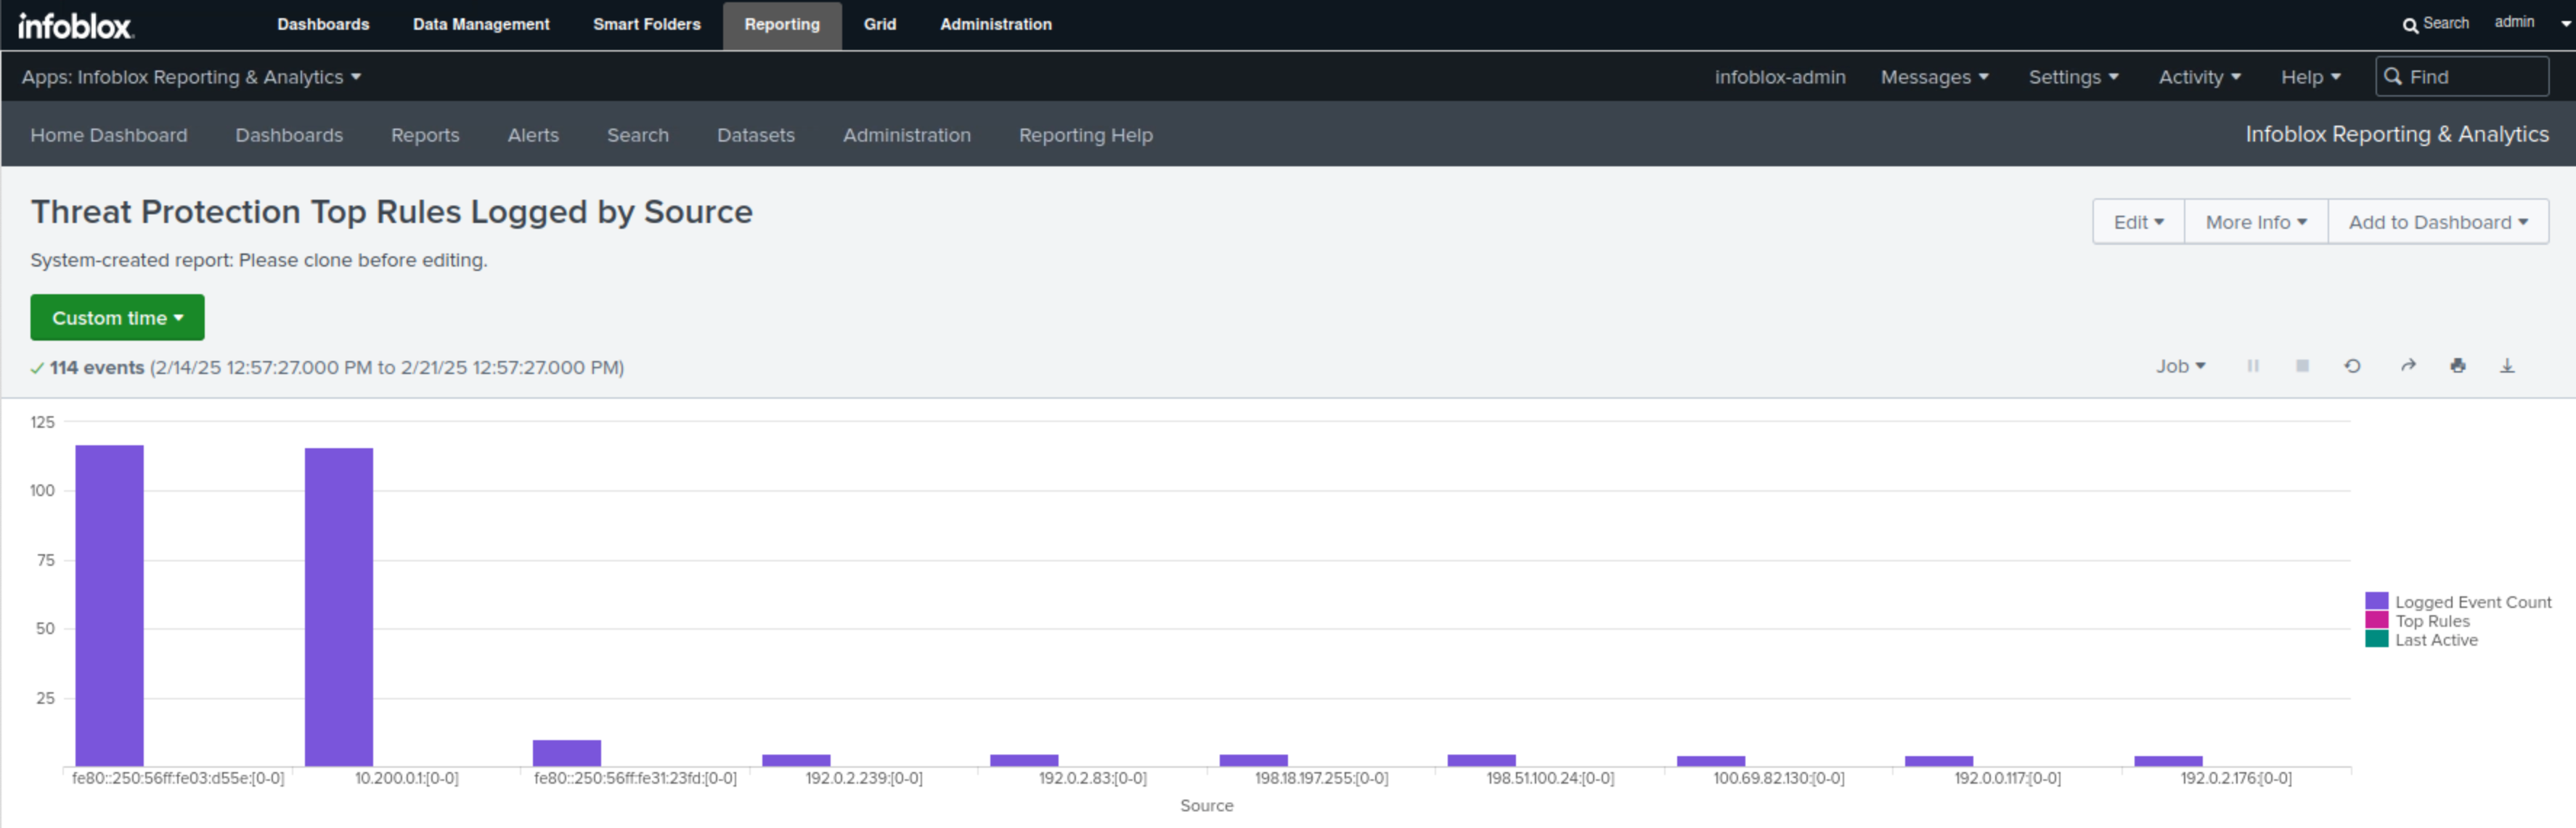
Select Threat Protection Top Rules Logged by Source.
-
This report displays all IPv4 and IPv6 addresses associated with Threat Protection (ADP) rule triggers in bar charts and tables, along with the number of events triggered by each IP address.
-
In this example, we can see that the IPv6 address fe80::250:56ff:fe03:d55e has the highest number of triggers, 117, followed by the IPv4 address 10.200.0.1, which has 116.
-
-
-
Navigate to Reporting → Dashboards.
-
Type threat protection in the filter box.
-
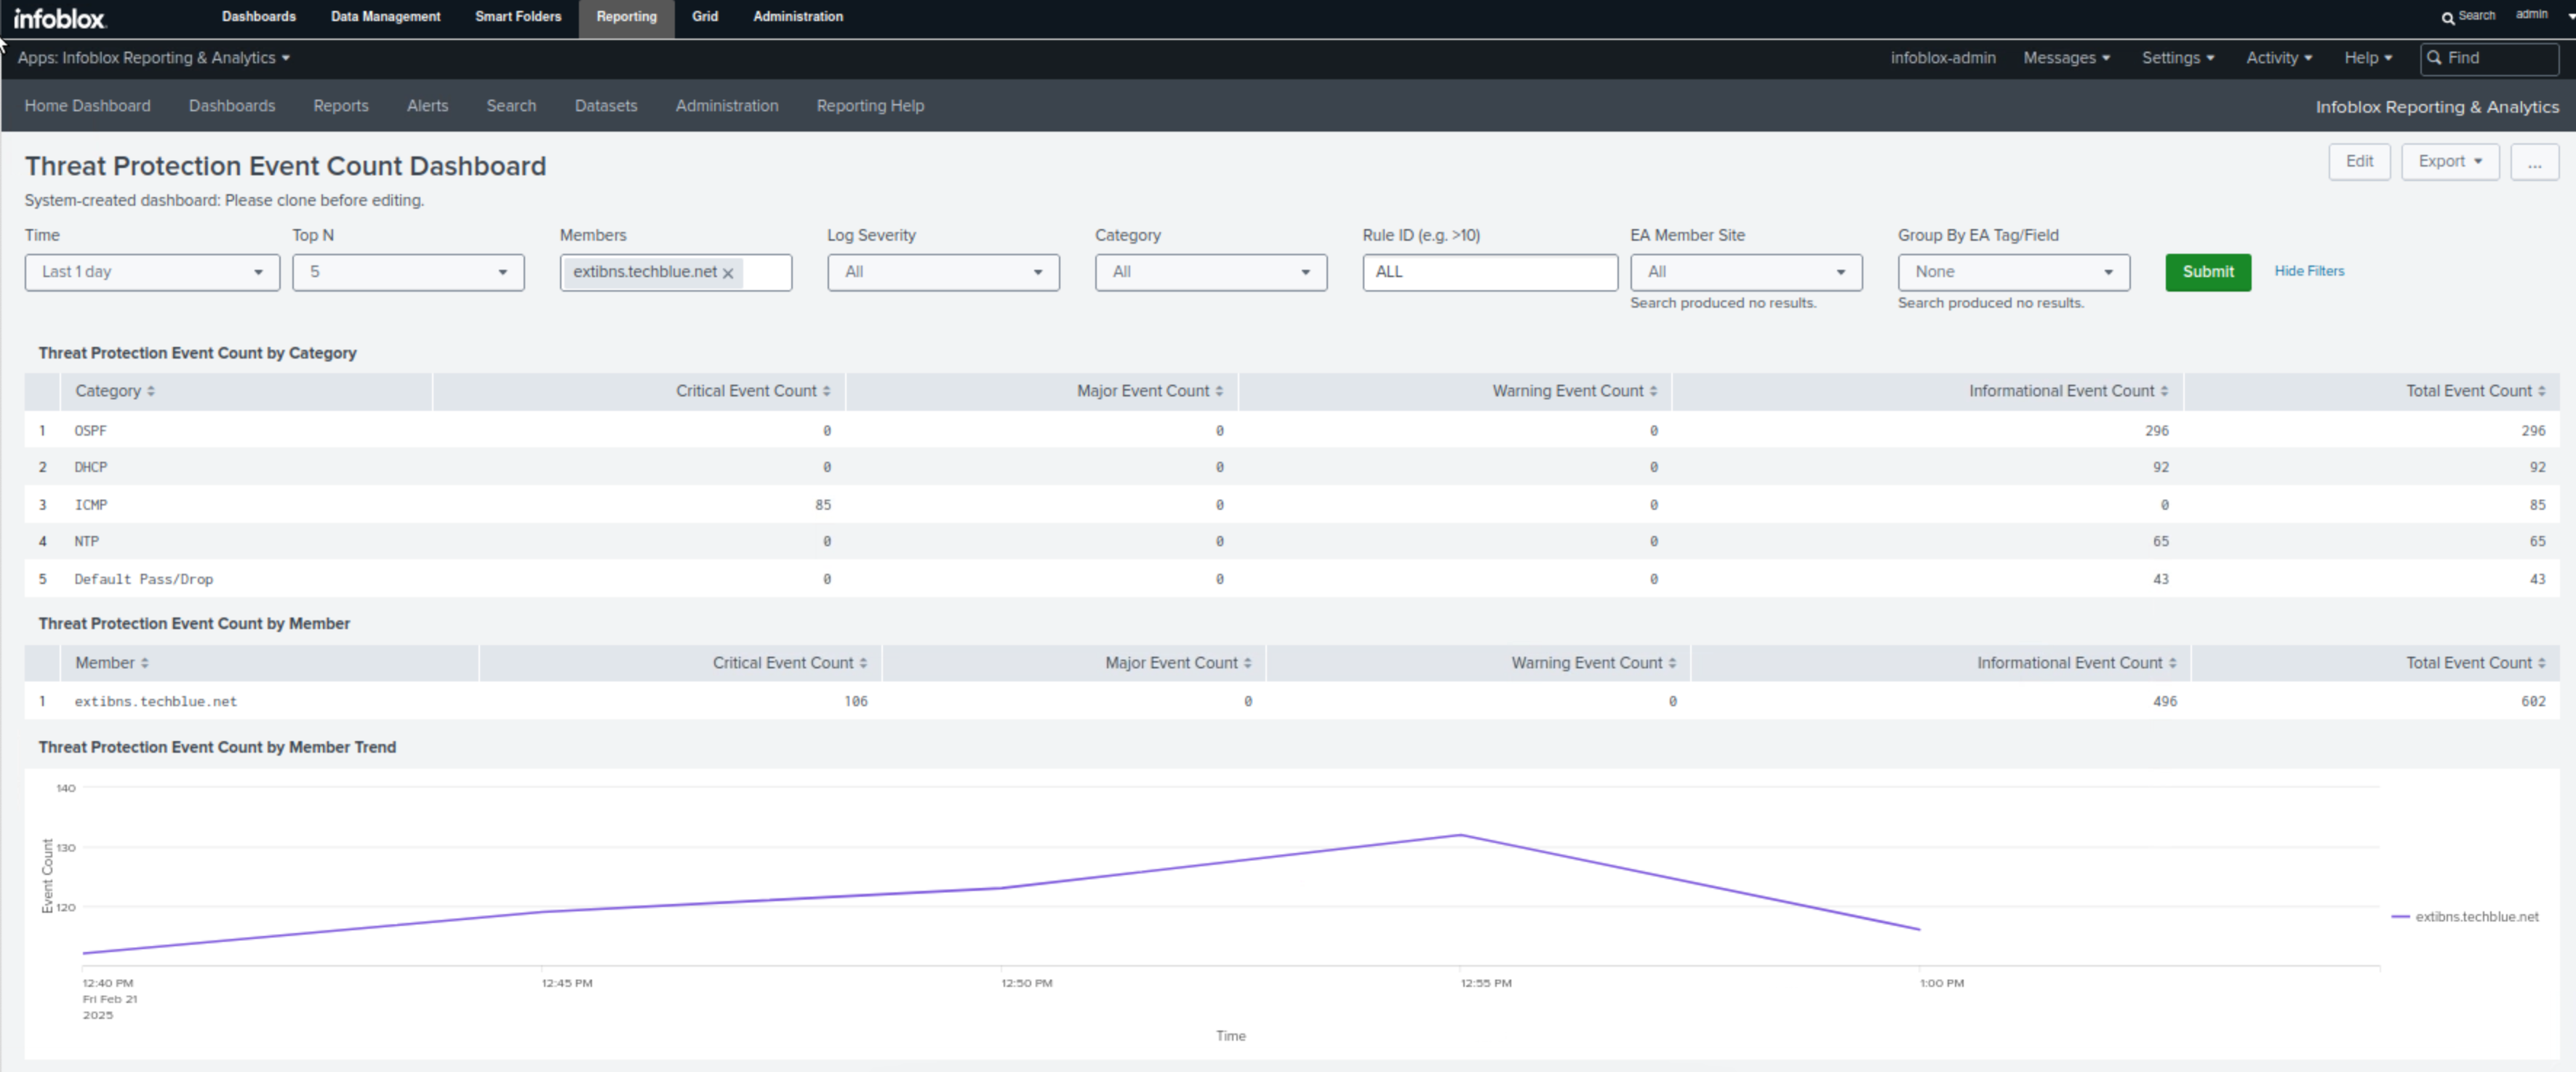
Find the Threat Protection Event Count Dashboard
-
This dashboard combines all the gathered information on one page, allowing us to view event counts by category, Affected members, event counts by rule, and trend graphs of events per member and per severity level.
-
In our scenario, this is the perfect dashboard to present to management.
-
-
Click on Export
-
Select Export as PDF
Task 28 Solution: Configure SNMP traps
In this task, we configure SNMP Traps for the Grid to be triggered when DNS traffic exceeds a preset threshold. This will allow us to react faster to DDoS or any future Threat Protection (ADP) triggering attacks. The traps will be sent to the SNMP receiver 10.100.0.10.
NOTE: In this lab, we will not configure or adjust SNMP Thresholds; we will use the system’s default presets.
-
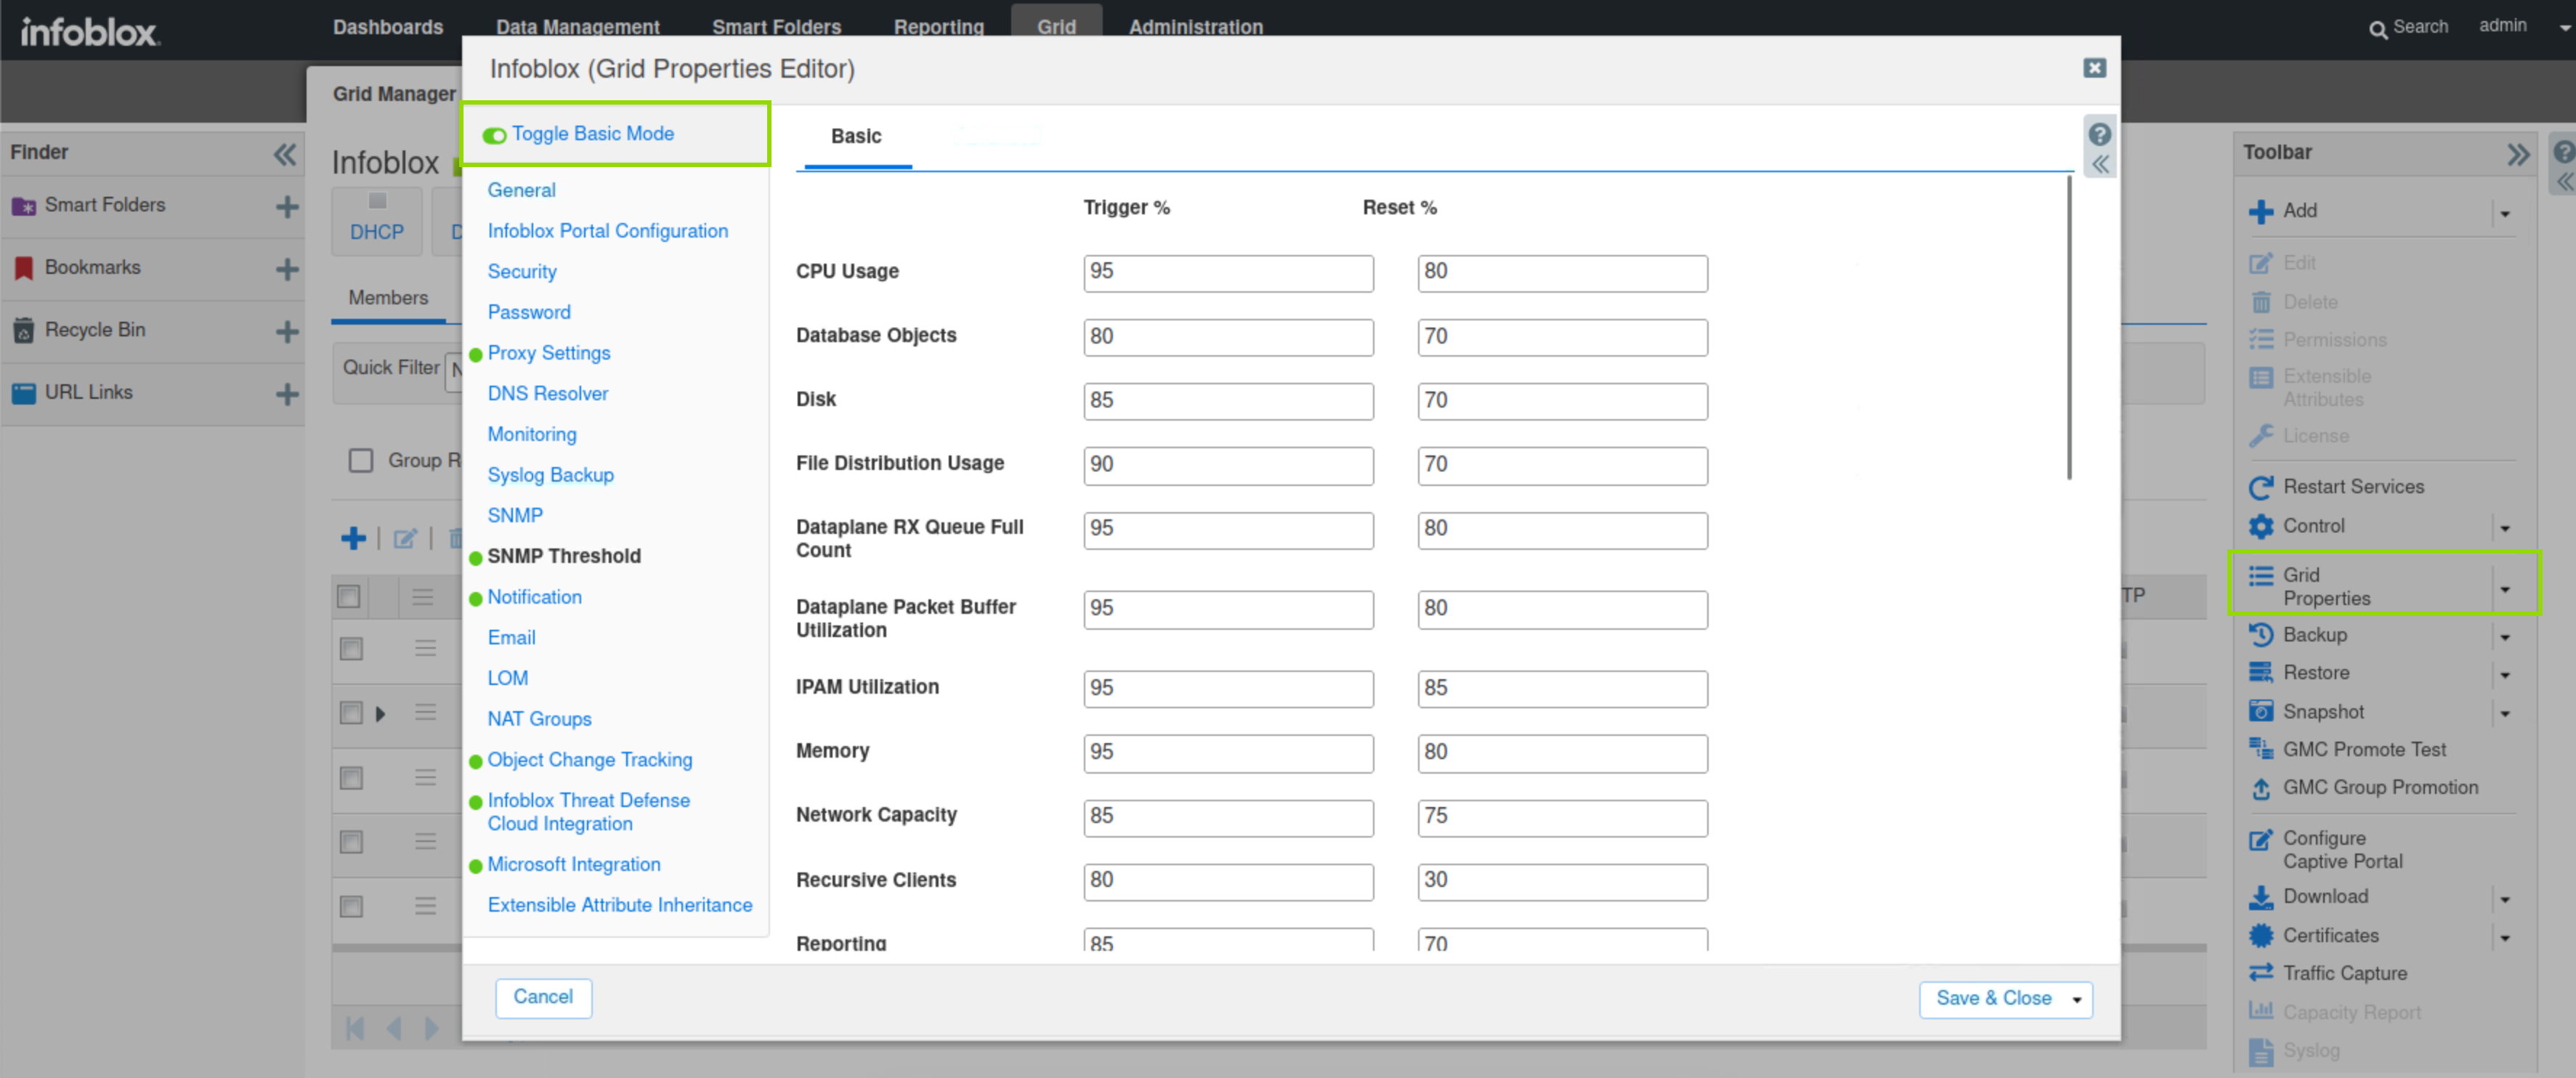
Navigate to Grid → Grid Manager → Members.
-
Click Grid Properties in the Toolbar.
-
Toggle Advanced Mode.
-
Select SNMP Thresholds.
-
View the preset Thresholds for the grid. The first column (trigger %) is the value at which an SNMP trap is sent, and the second column (reset %) is when the grid returns to its normal state and the trap is reset.
-
-
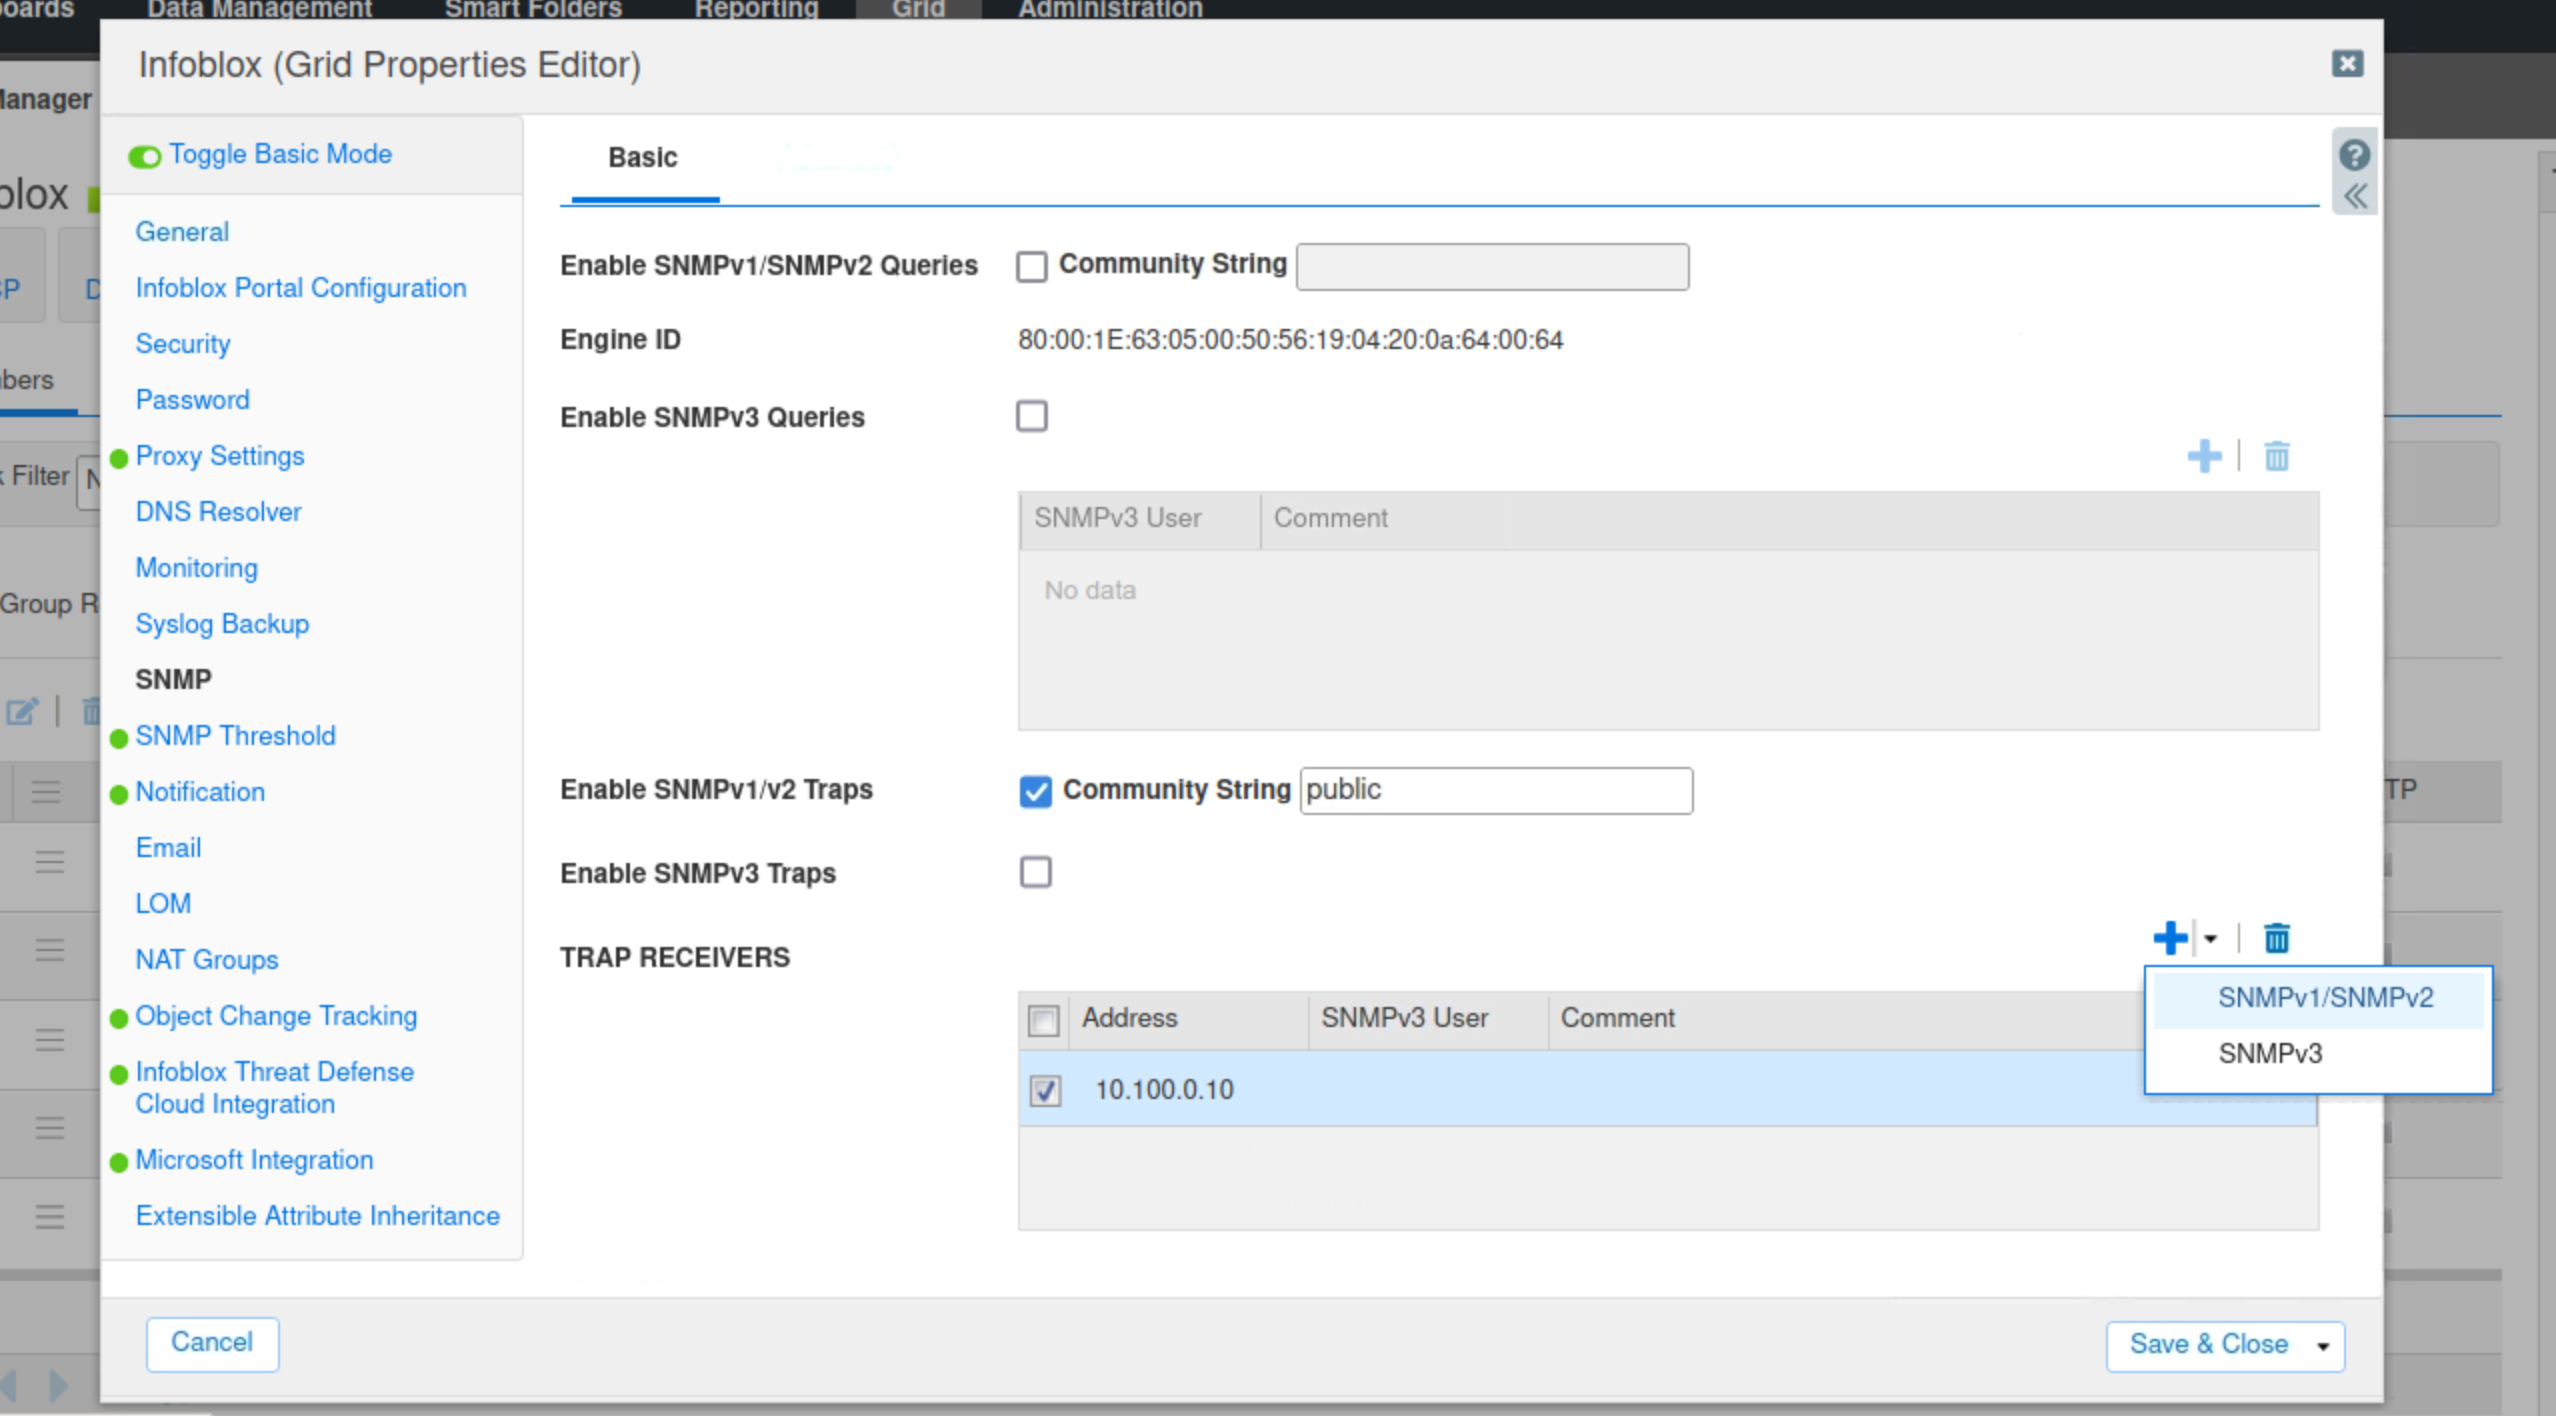
Select SNMP.
-
Check the SNMP v1/v2 Traps box.
-
Enter public for the community string.
-
Click the plus (+) symbol to add an SNMP v1/v2 Trap Receiver.
-
Use the IP address 10.100.0.10 for the trap receiver.
-
Click Save & Close.
-
When prompted with an SCP Warning, click Yes for confirmation.