Scenario
Your organization has recently enabled the DNS Infrastructure Protection service on the authoritative DNS server extibns.techblue.net and set it to be in monitor-mode. The next step is to tune DNS Infrastructure Protection rules to suit your organization’s needs.
To achieve that, you will first identify noisy clients, investigate whether or not their behaviour is expected, and establish a DNS usage baseline for your organization. Then, using the gathered information, you will tune relevant DNS Infrastructure Protection rules.
Estimate Completion Time
-
45 Minutes to 1 hour
Related Lab Guides:
Credentials
|
Description |
Username |
Password |
URL or IP |
|---|---|---|---|
|
Grid Manager UI |
admin |
infoblox |
|
|
NIOS-4 VM |
admin |
infoblox |
|
|
support-server |
training |
infoblox |
|
Requirements
-
Administrative access to the Grid
-
Usage of the NIOS Lab Environment (DNS Infrastructure Protection) Lab environment
Learning Content
Lab Initiation
Access jump-desktop
Once the lab is deployed, you can access the virtual machines required for this activity. To begin, select VM List from the navigation bar at the top, locate jump-desktop, and click the green play icon to open its console. Log in to the Linux UI.

Username: training
Password: infoblox
Initiate lab
To initiate the lab, double-click the Launch Lab icon on the Desktop.

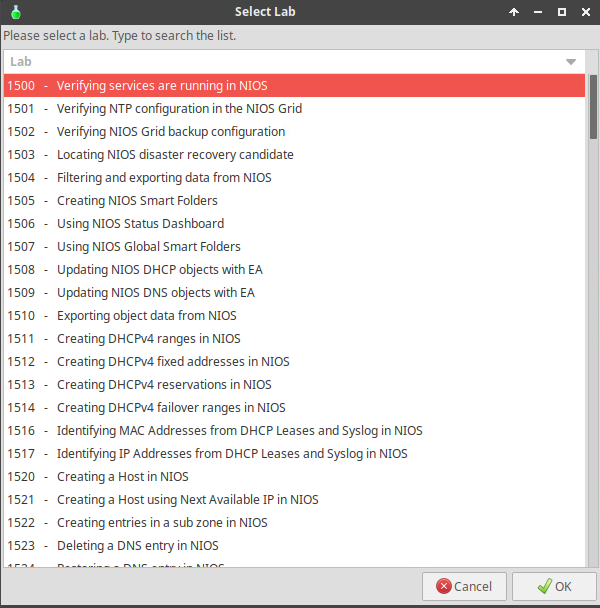
Choose the lab number from the list and click OK.
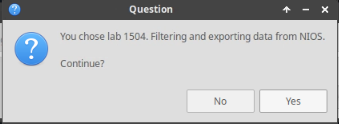
After clicking OK, you will see a pop-up message with a brief description of the lab task. If the description looks correct, click Yes to continue lab initiation.
Lab initiation will take a couple of minutes to finish.
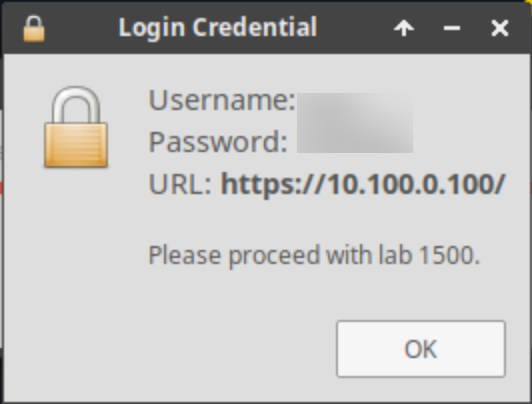
Once complete, you will see another pop-up message with the login credentials and the URL for the Grid Manager’s User Interface. Note that the credentials may differ from those from prior labs.
Tasks
-
Task 1: Load DNS Infrastructure Protection License Files to the Grid
-
Task 2: Set up the Reporting Server
-
Task 3: Identify and Investigate Outliers
-
Task 4: Establish a Baseline
-
Task 5: Create a Profile for Tuned Rulesets
-
Task 6: Manage Rule Categories
-
Task 7: Tune Default Rules in the Authoritative - Tuned Profile
-
Task 8: Test the new Configuration with monitor-mode Enabled
-
Task 9: Test the new Configuration with monitor-mode Disabled
Task 1: Load DNS Infrastructure Protection License Files to the Grid
Advanced DNS Protection (ADP) is an older name for the DNS Infrastructure Protection (DNS-IP) service; some system files still use the old name.
Reload the DNS Infrastructure Protection license files to the Grid by navigating to Shared Drive/Licenses. Select the ADP.lic file. This is done due to limitations in the lab environment. Verify the Grid was configured in previous labs to include two rulesets (20250702-16 and 20251209-16), and an untuned initial profile (Authoritative - Initial Config) used by extibns.techblue.net. This task is only necessary due to lab environment limitations.
Task 2: Set up the Reporting Server
Set up the Reporting Server with the following information:
|
Configuration |
Value |
|
Username |
training |
|
Password |
infoblox |
|
Protocol |
SCP |
|
Host/ IP Address |
10.100.0.205 |
|
Port |
22 |
|
Path |
/home/training/Documents/ReportingData |
Task 3: Identify and Investigate Outliers
Leave the Grid running passively for 30 to 35 minutes to allow enough traffic to flow through the Grid and populate its dashboards and reports
Use the Reporting Server dashboards to identify noisy clients (outliers). The DNS Infrastructure Protection service hasn’t been running long enough, so dashboards that show daily trends, such as DNS Daily Peak Hour Query Rate by Member, will not be accurate or useful in this instance. However, this is an important dashboard to check in a production system where the DNS Infrastructure Protection service has been running for several days or weeks.
Task 4: Establish a Baseline
Use the Reporting Server dashboards to establish the normal rate of DNS Queries Per Second (QPS) or a baseline. The information you want to gather here can also be found under DNS Query Rate by Member, or Daily Peak Hour Query Rate by Member dashboards. However, since the DNS Infrastructure Protection service hasn’t been running long enough, dashboards showing daily trends will not be accurate or useful in this instance.
Task 5: Create a Profile for Tuned Rulesets
Create a DNS Infrastructure Protection profile named Authoritative - Tuned. In this process, override the Active Ruleset and select the 20250702-16 ruleset for the new profile, and assign this profile to extibns.techblue.net.
Task 6: Manage Rule Categories
Since extibns.techblue.net is an authoritative-only DNS server, certain rule categories are not required. Disable the following rule categories:
-
DNS Malware
-
DNS DDoS
-
DNS Tunneling
Task 7: Tune Default Rules in the Authoritative - Tuned Profile
The values used in this task are specific to the lab and do not reflect the values you should use in a production environment
You will tune three rules to suit your current lab environment; these rules are to protect against TCP and UDP flood attacks.
-
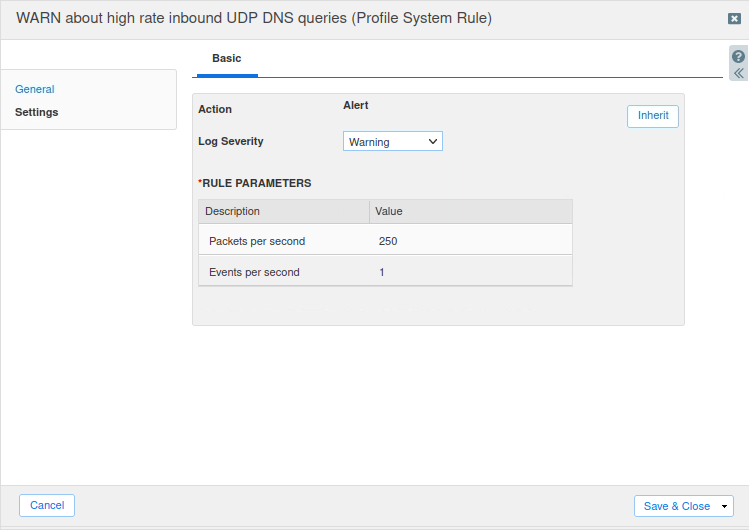
Tune the rule ID 130000100 (WARN about high rate inbound UDP DNS queries) as follows:
-
Log Severity: Warning
-
Packets per second: 250
-
Enable the rule
-
-
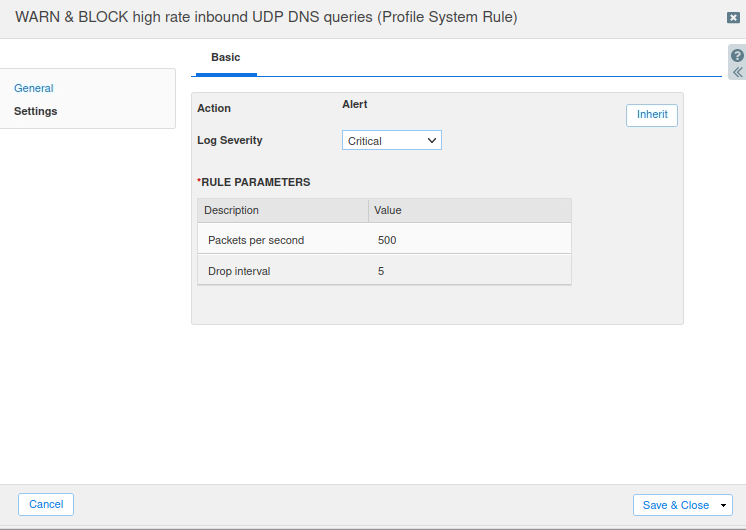
Tune the rule ID 130000200 (WARN & BLOCK about high rate inbound UDP DNS queries) as follows:
-
Log Severity: Critical
-
Packets per second: 500
-
Enable the rule
-
-
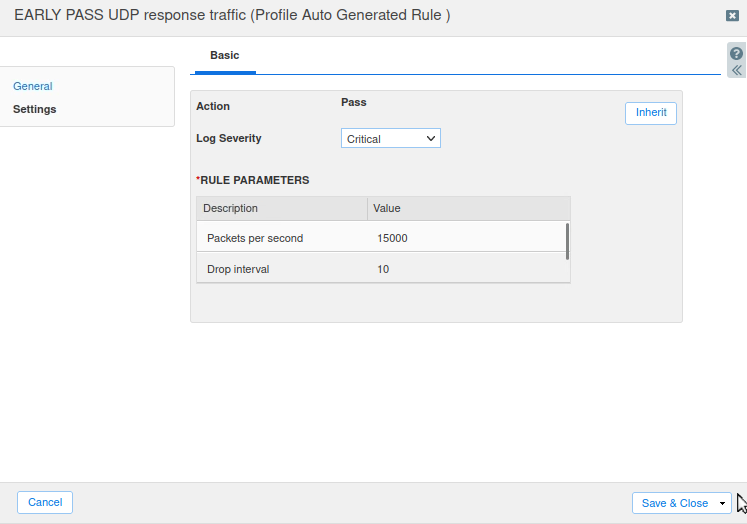
Tune the rule ID 100000100 (EARLY PASS UDP response traffic) as follows:
-
Log Severity: Critical
-
Packets per second: 15000
-
Task 8: Test the new Configuration with monitor-mode Enabled
Test the Authoritative - Tuned Profile’s newly tuned rules, keeping extibns.techblue.net in monitor-mode.
-
Use the bmon monitoring tool, installed on the support-server virtual machine, to monitor the eth2 interface.
-
Use the queryperf tool, installed on the support-server virtual machine, to send DNS queries to the extibns.techblue.net DNS server at the following rates:
-
Set the query rate to 350
-
This will exceed the threshold for rule ID 130000100 and trigger it.
-
-
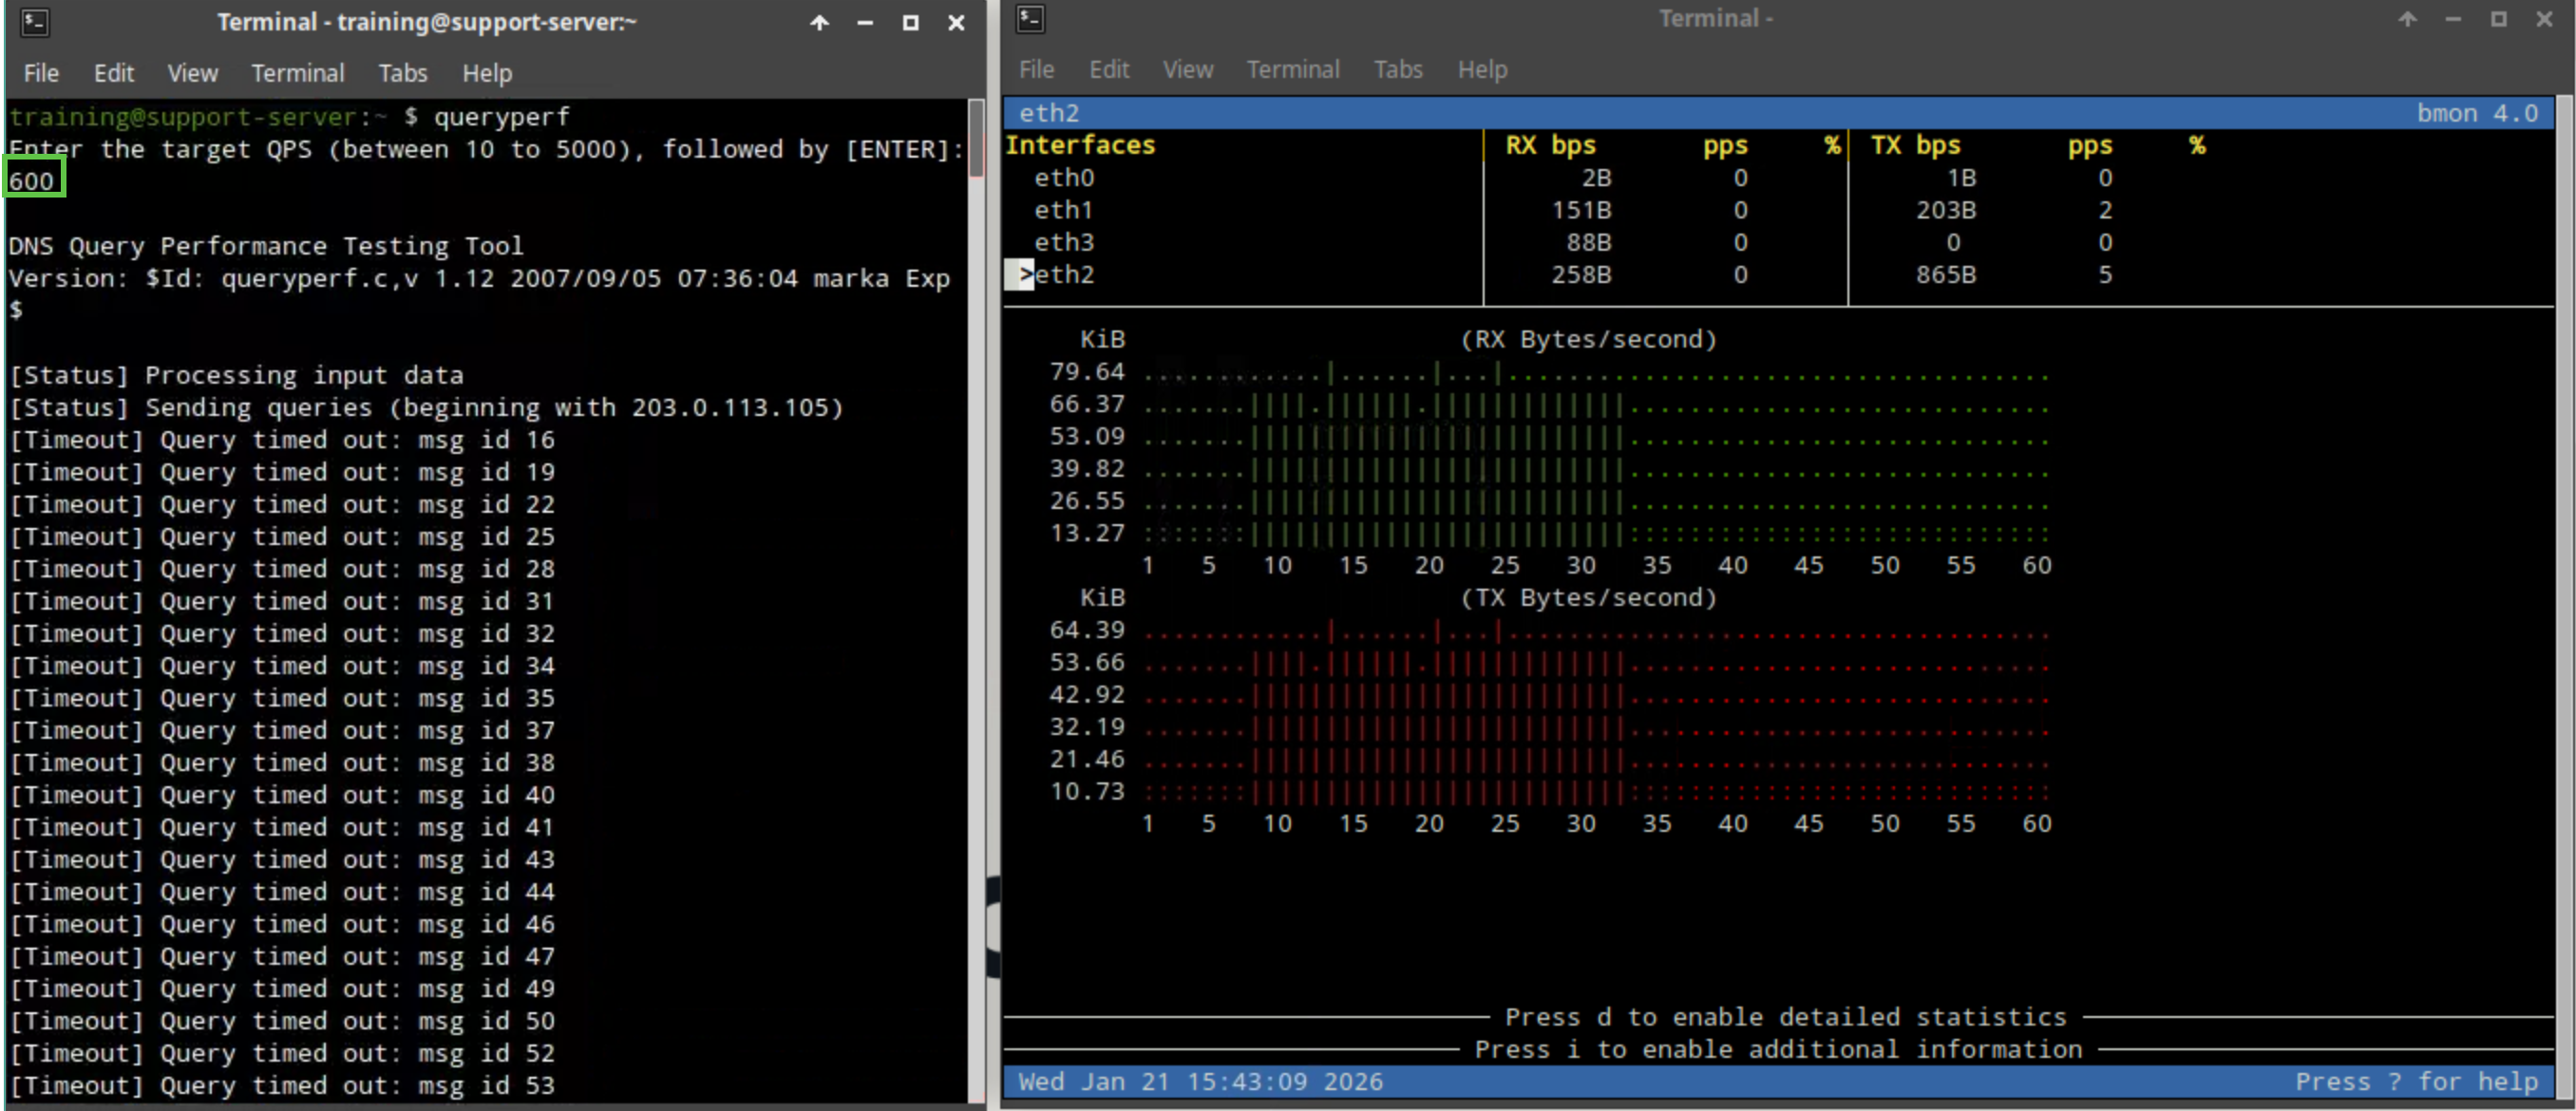
Set the query rate to 600
-
This will exceed the threshold for rule ID 130000200 and trigger it.
-
-
Monitor the eth2 interface health using bmon.
-
Use NIOS syslogs to verify your observations.
-
Task 9: Test the new Configuration with monitor-mode Disabled
-
Disable monitor-mode on NIOS-4 (extibns.techblue.net), then repeat your tests with the same query rates (350 then 600) and observe the difference in the eth2 interface health. Use NIOS syslogs to verify your observations.
Solutions
Task 1 Solution: Load DNS Infrastructure Protection License Files to the Grid
In this task, we will reload the DNS Infrastructure Protection license on the Grid due to limitations in the lab environment. There should be two licenses bundled into the file. The first “DNS Infrastructure Protection” license enables the service on the Grid, while the second “DNS Infrastructure Protection Update” license allows the Grid to download and install the latest rule sets.
We will then verify that the Grid was configured in previous labs to include two rulesets: 20250702-16, the active ruleset, and 20251209-16, and an untuned profile (Authoritative - Initial Config) used by the Grid member extibns.techblue.net. This task is only necessary due to lab environment limitations.
-
On the jump-desktop machine, open a browser window to https://10.100.0.100.
-
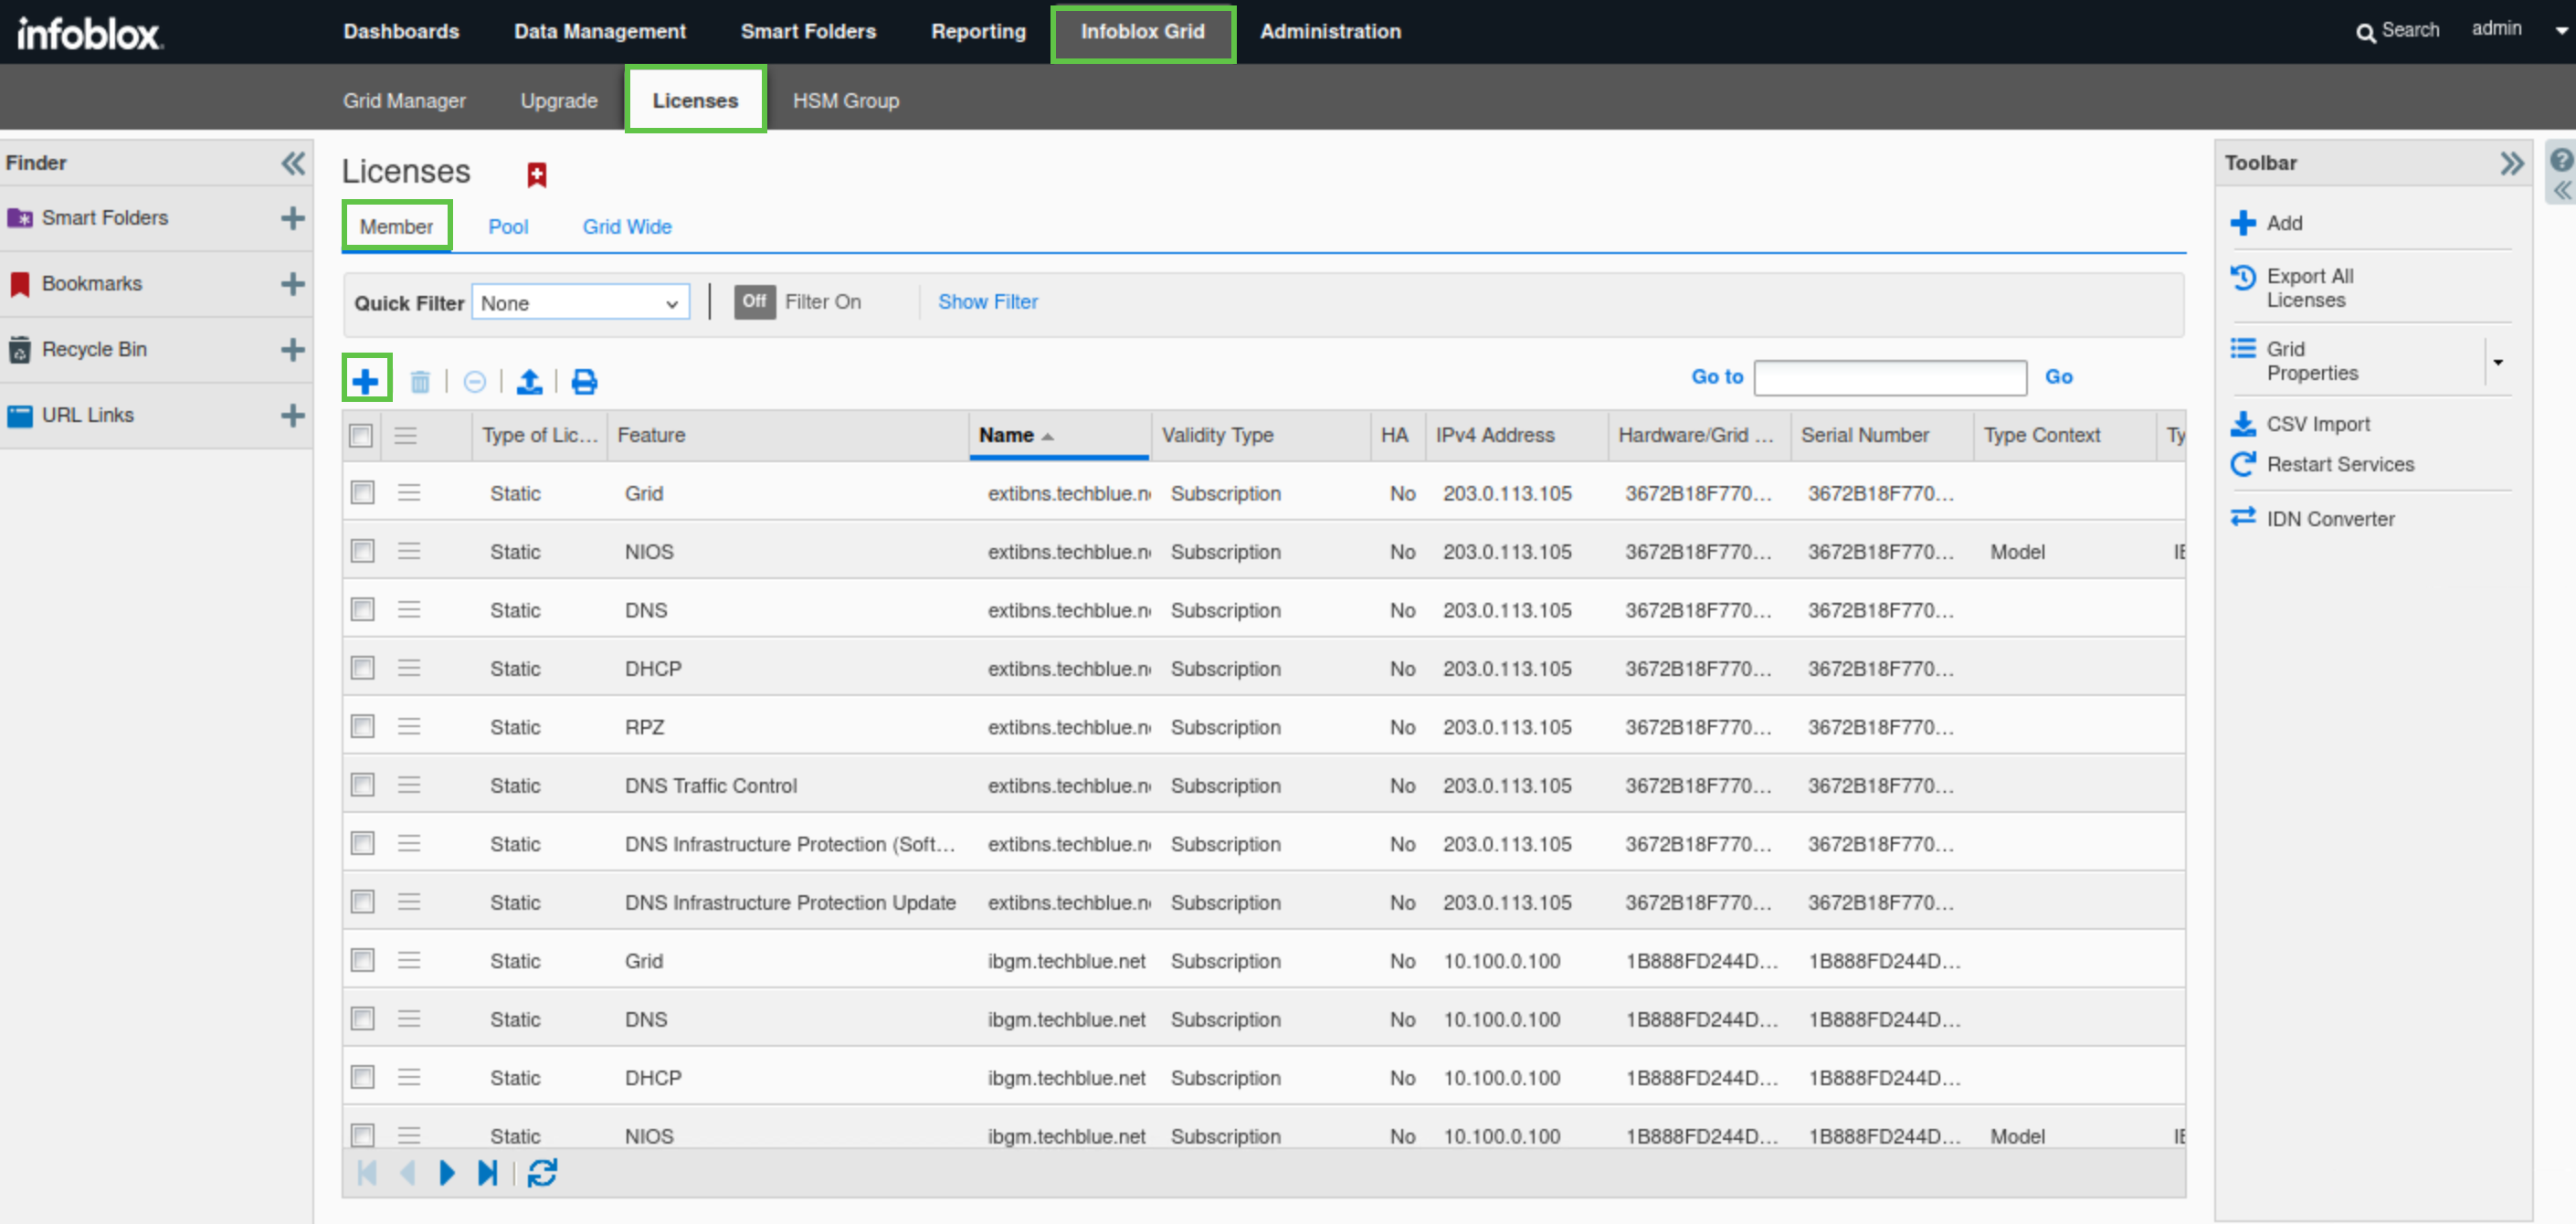
Navigate to Infoblox Grid → Licenses → Members.
-
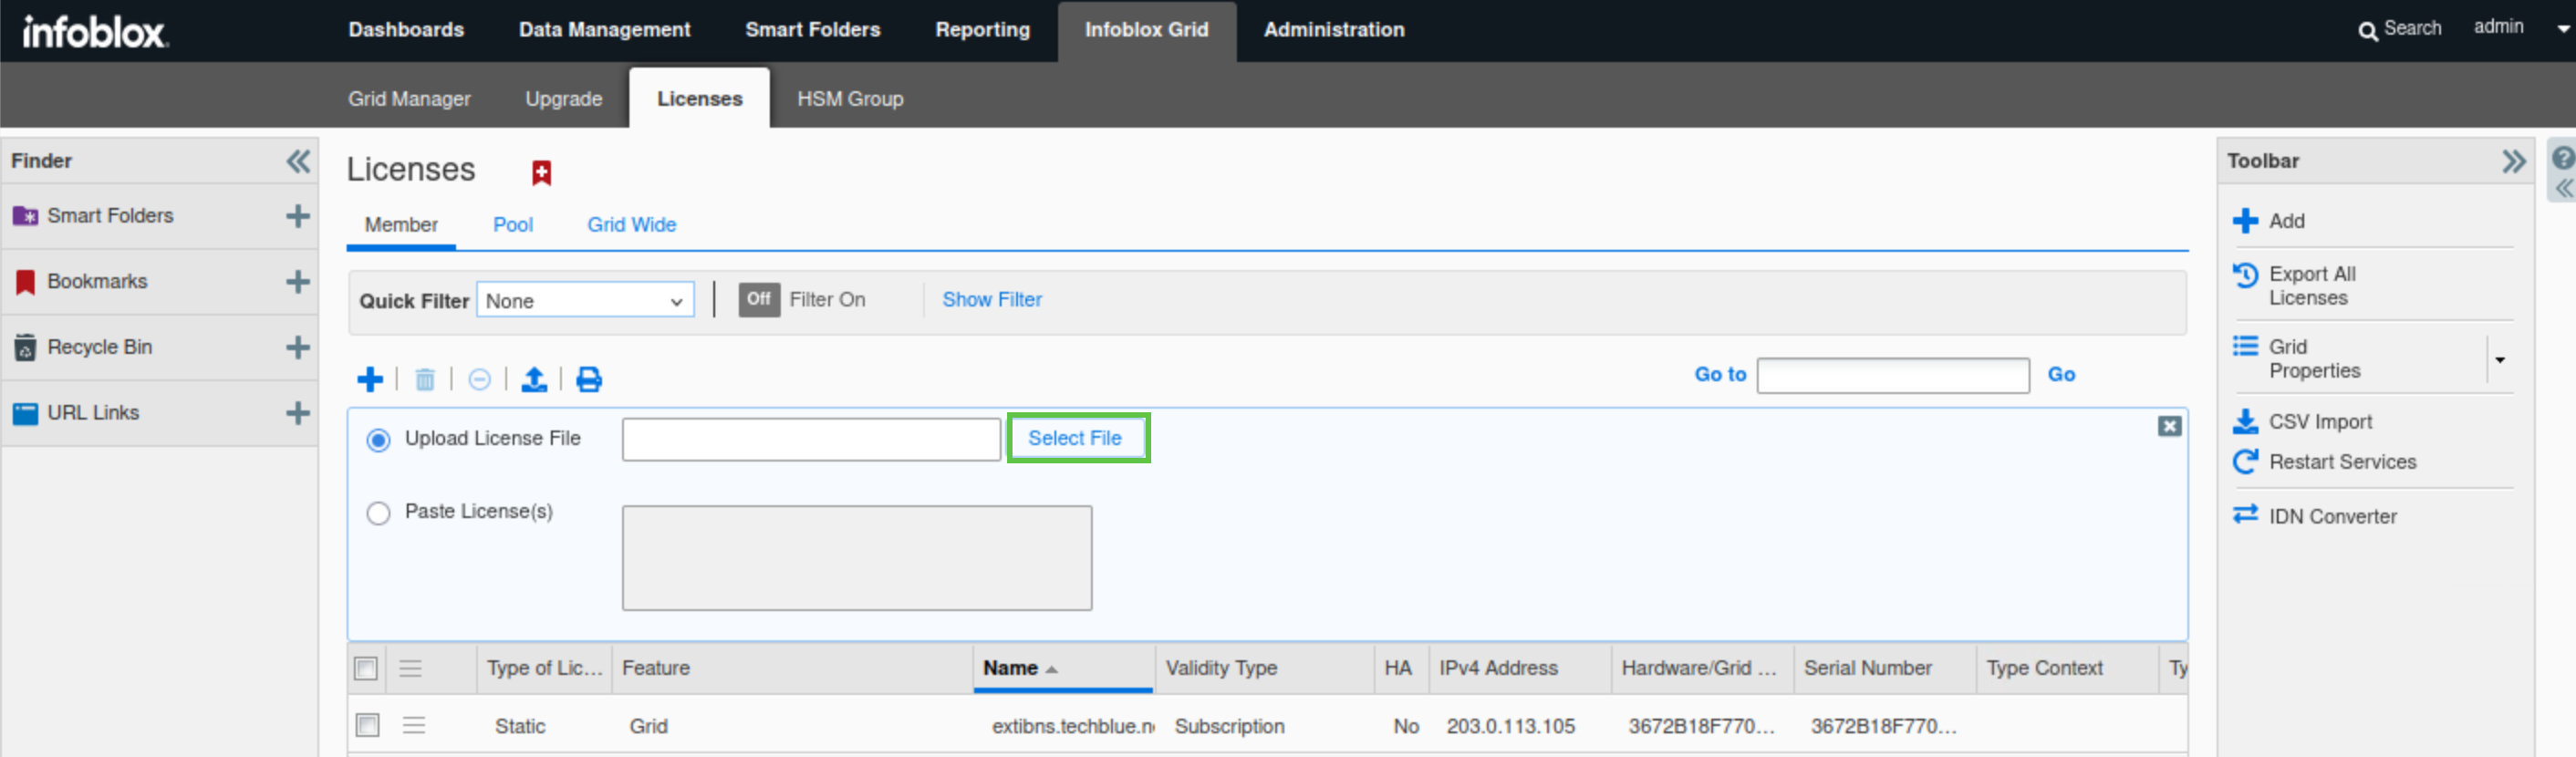
Click the plus (+) symbol to add a new license.
-
Click Select File to upload the license file.
-
Navigate to
Shared Drive/Licenses/9.0. -
Select the ADP.lic file and click Open.
-
Advanced DNS Protection (ADP) is an older name for the DNS Infrastructure Protection (DNS-IP) service; some system files still use the old name.
-
-
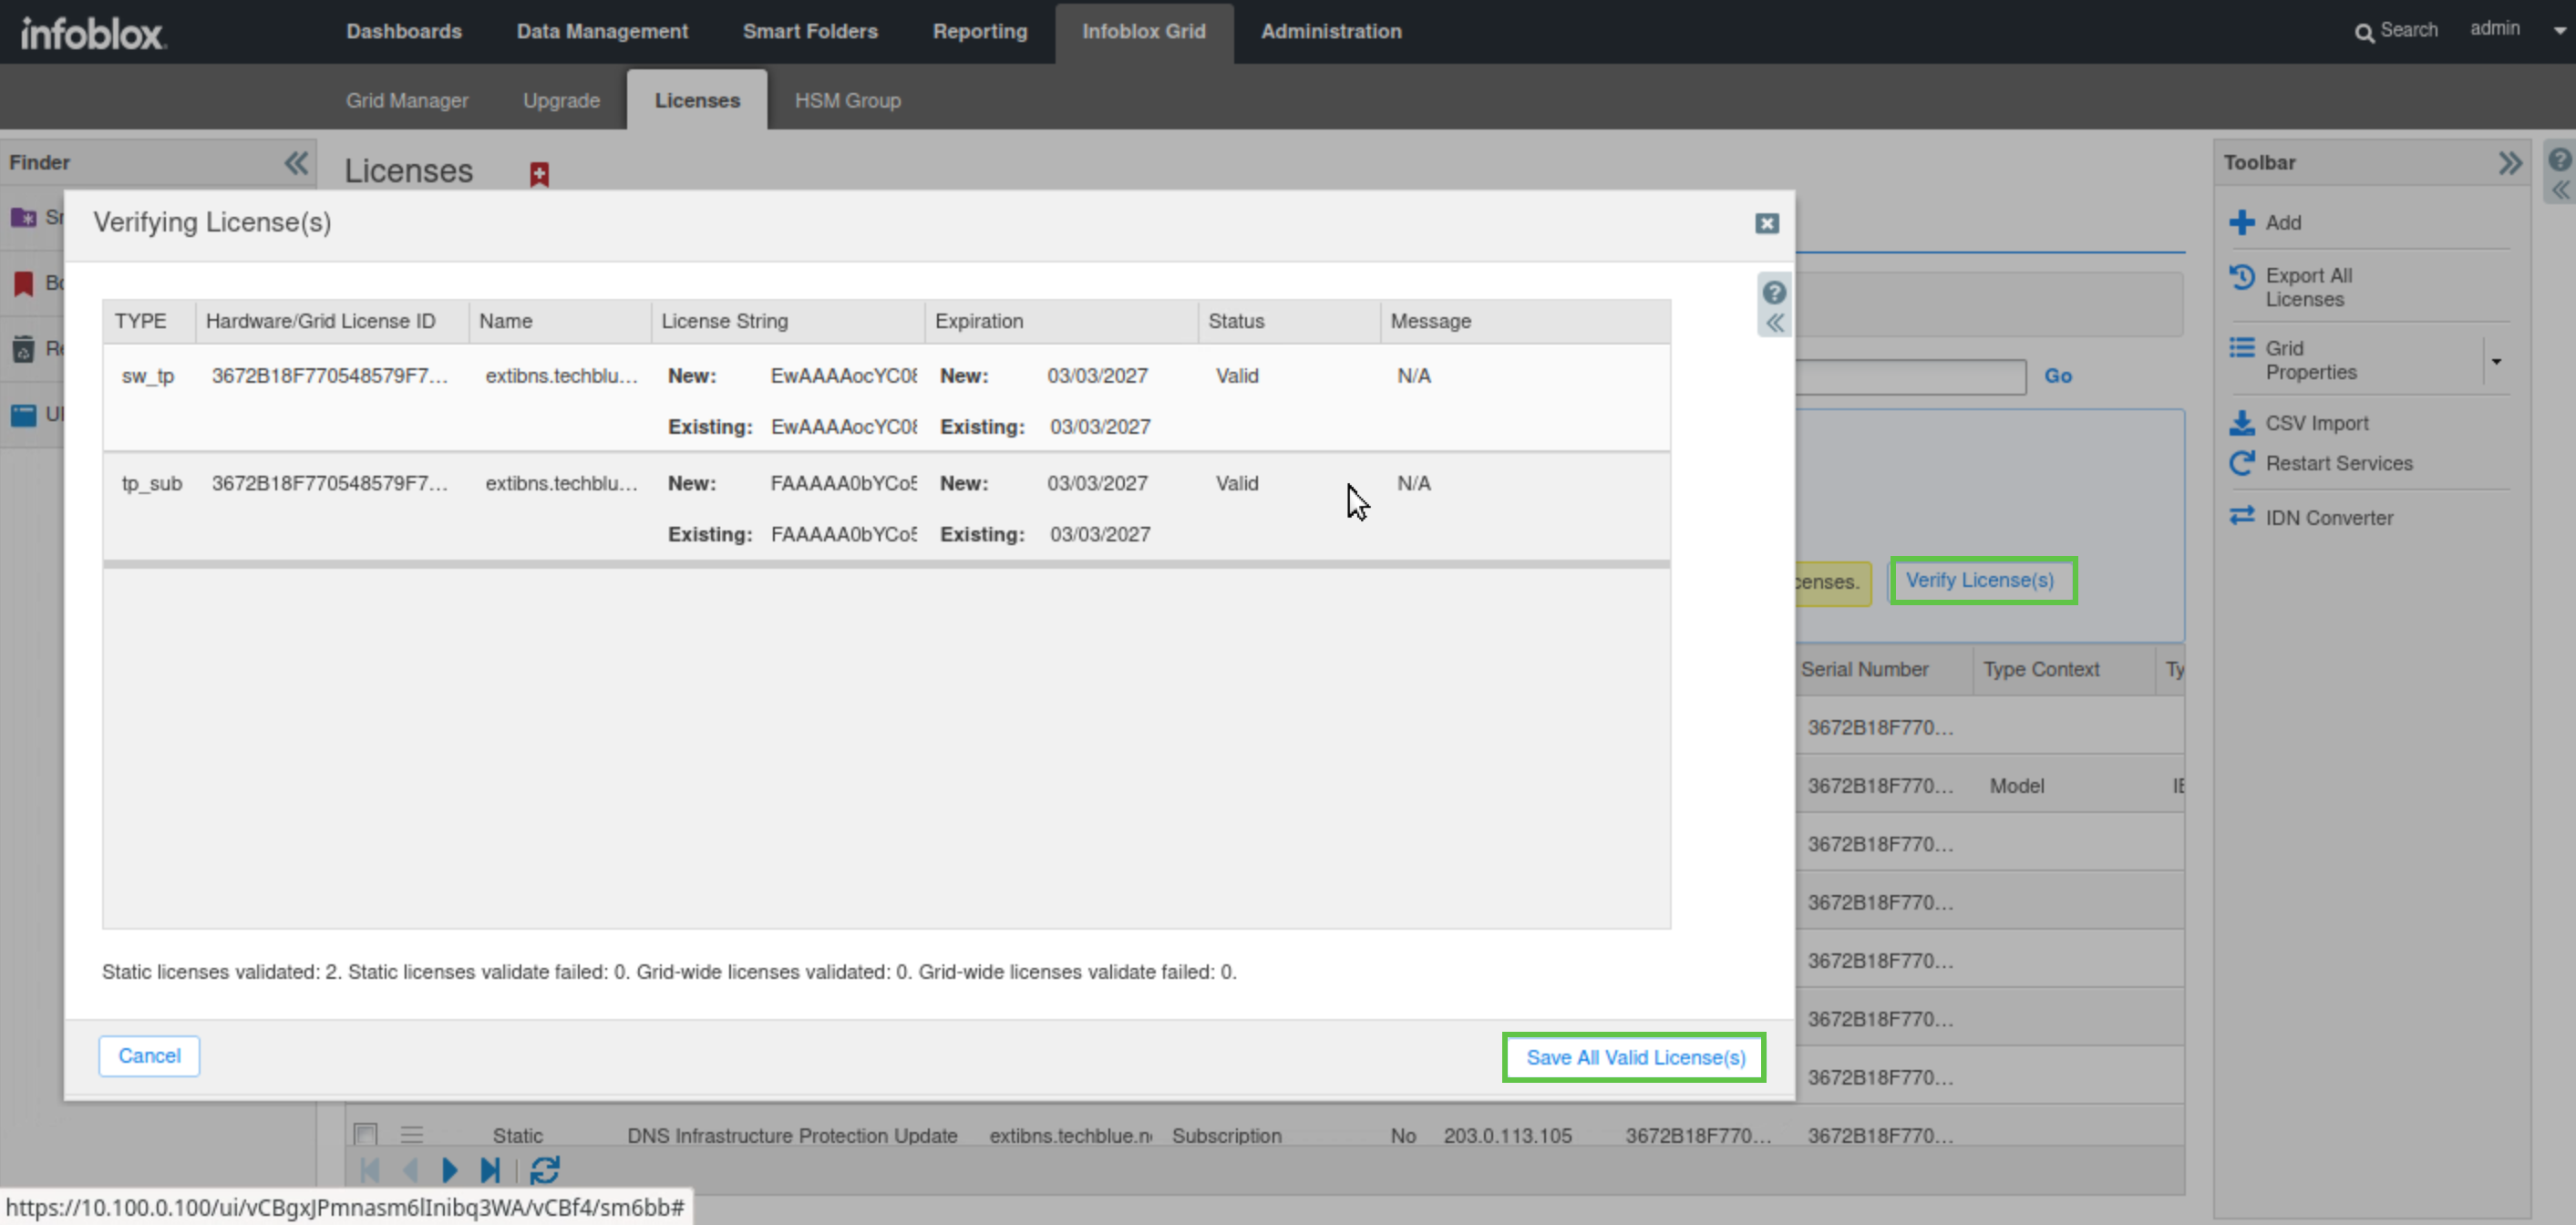
Click Verify License(s), then Save All Valid Licenses.
-
After the licenses are added, two new DNS Infrastructure Protection licenses will be listed. The first “DNS Infrastructure Protection” license enables the service on the Grid, while the second “DNS Infrastructure Protection Update” license allows the Grid to download and install the latest rule sets.
-
-
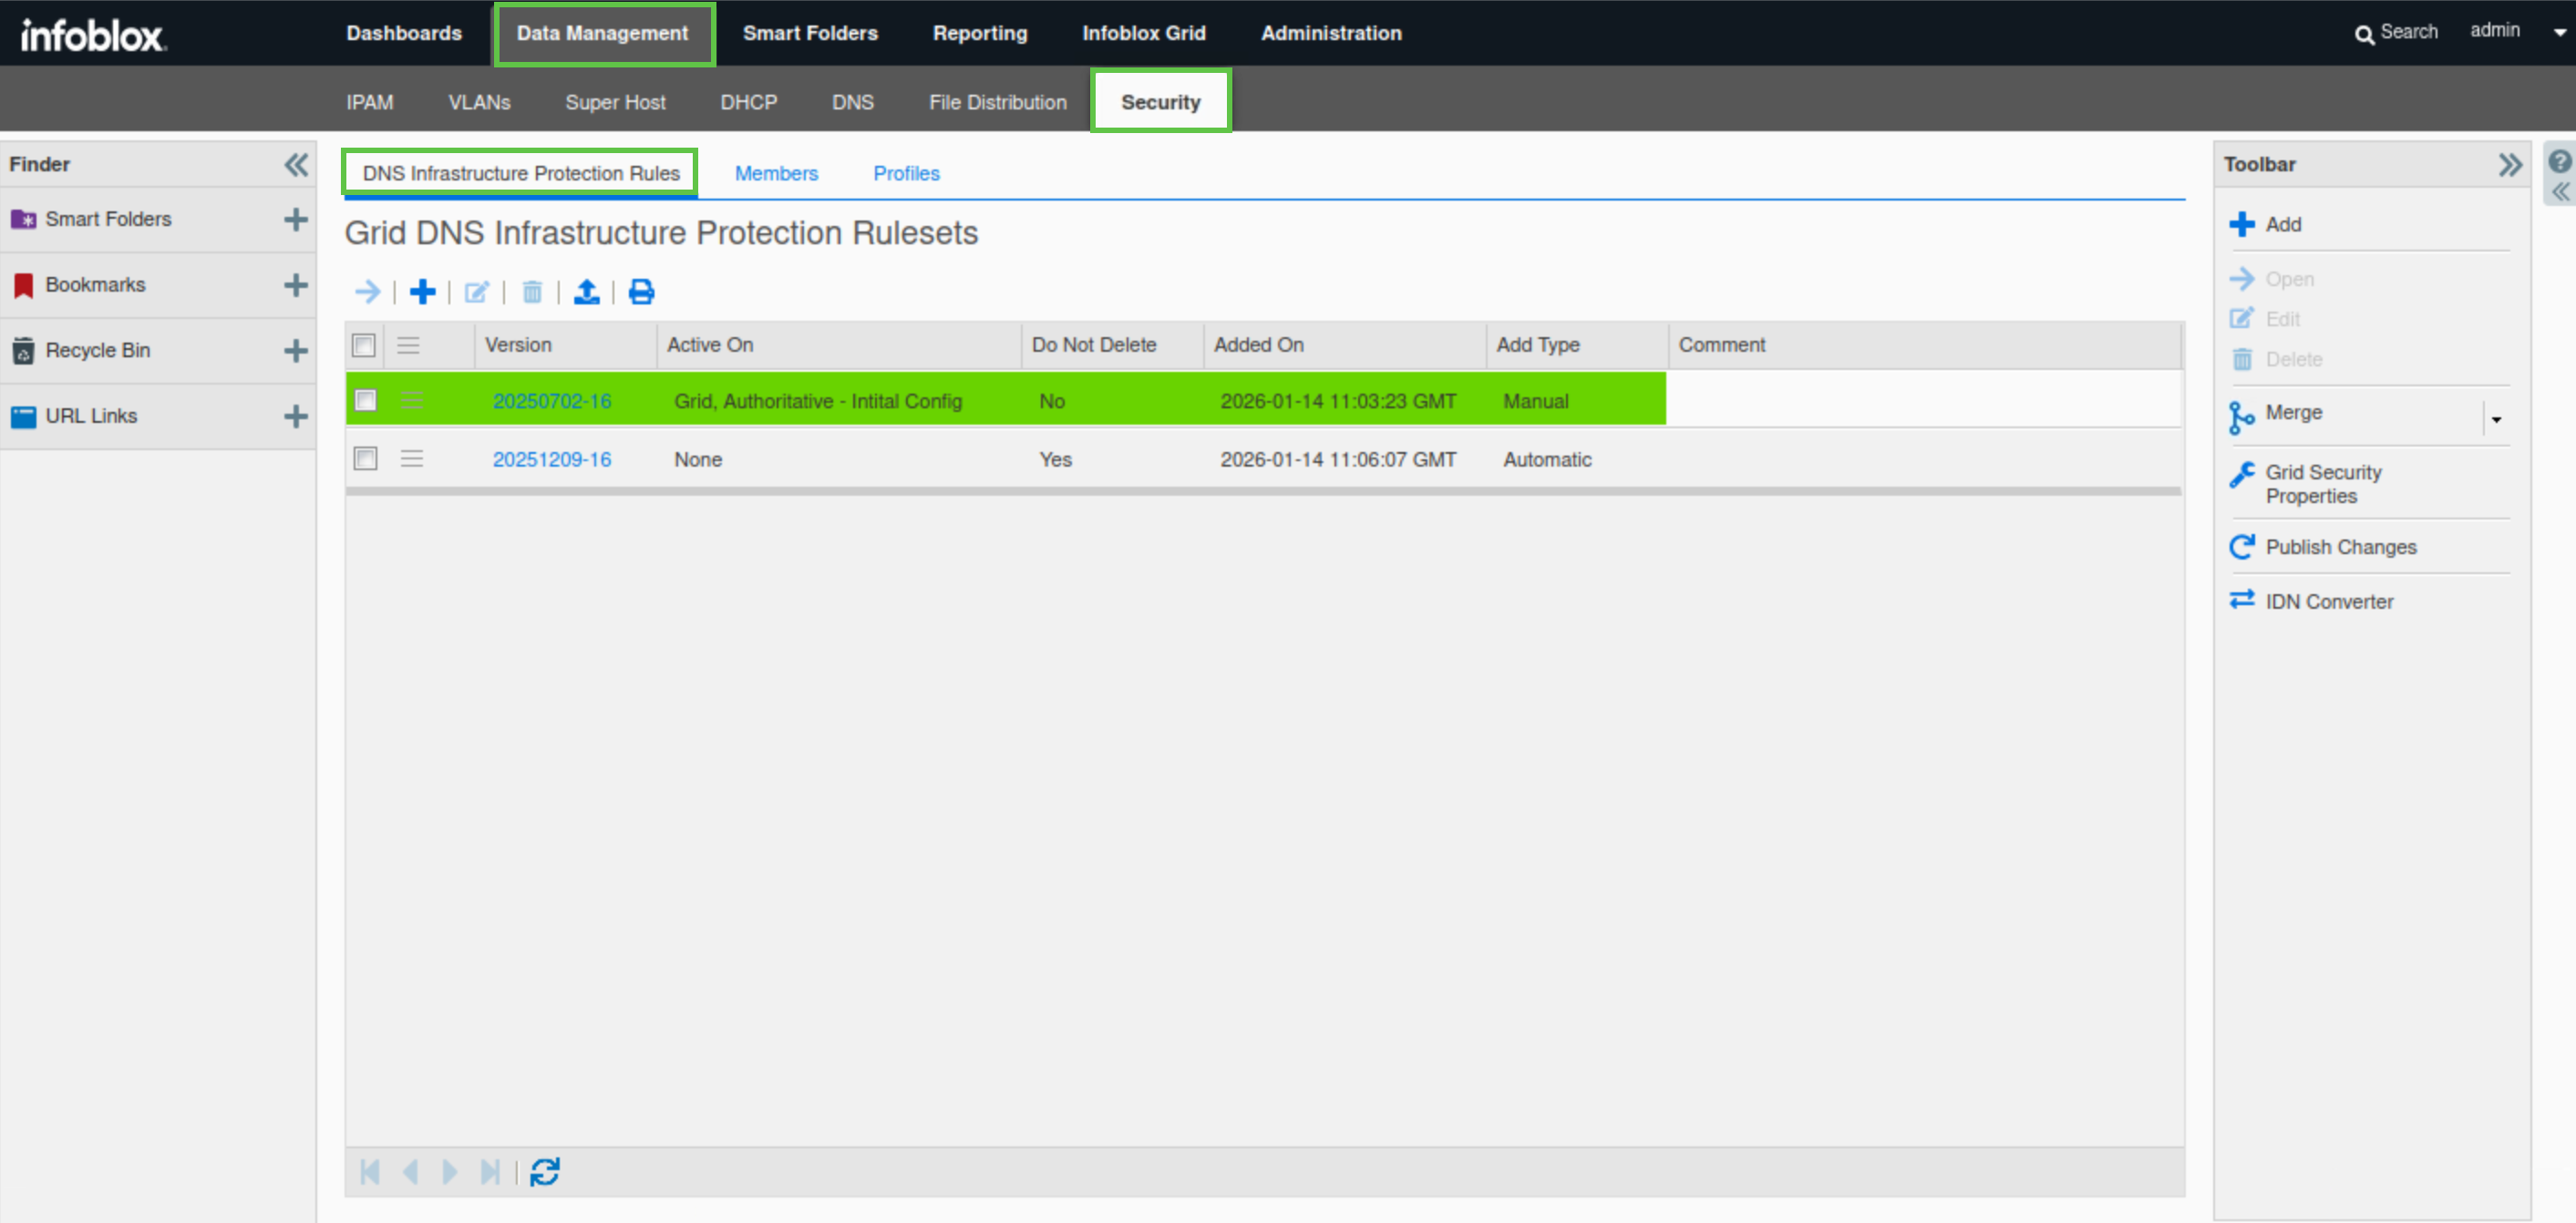
Navigate to Data Management → Security → DNS Infrastructure Protection Rules.
-
Two rulesets will be listed. The first is 20250702-16, the active ruleset highlighted in green, and the second is 20251209-16.
-
-
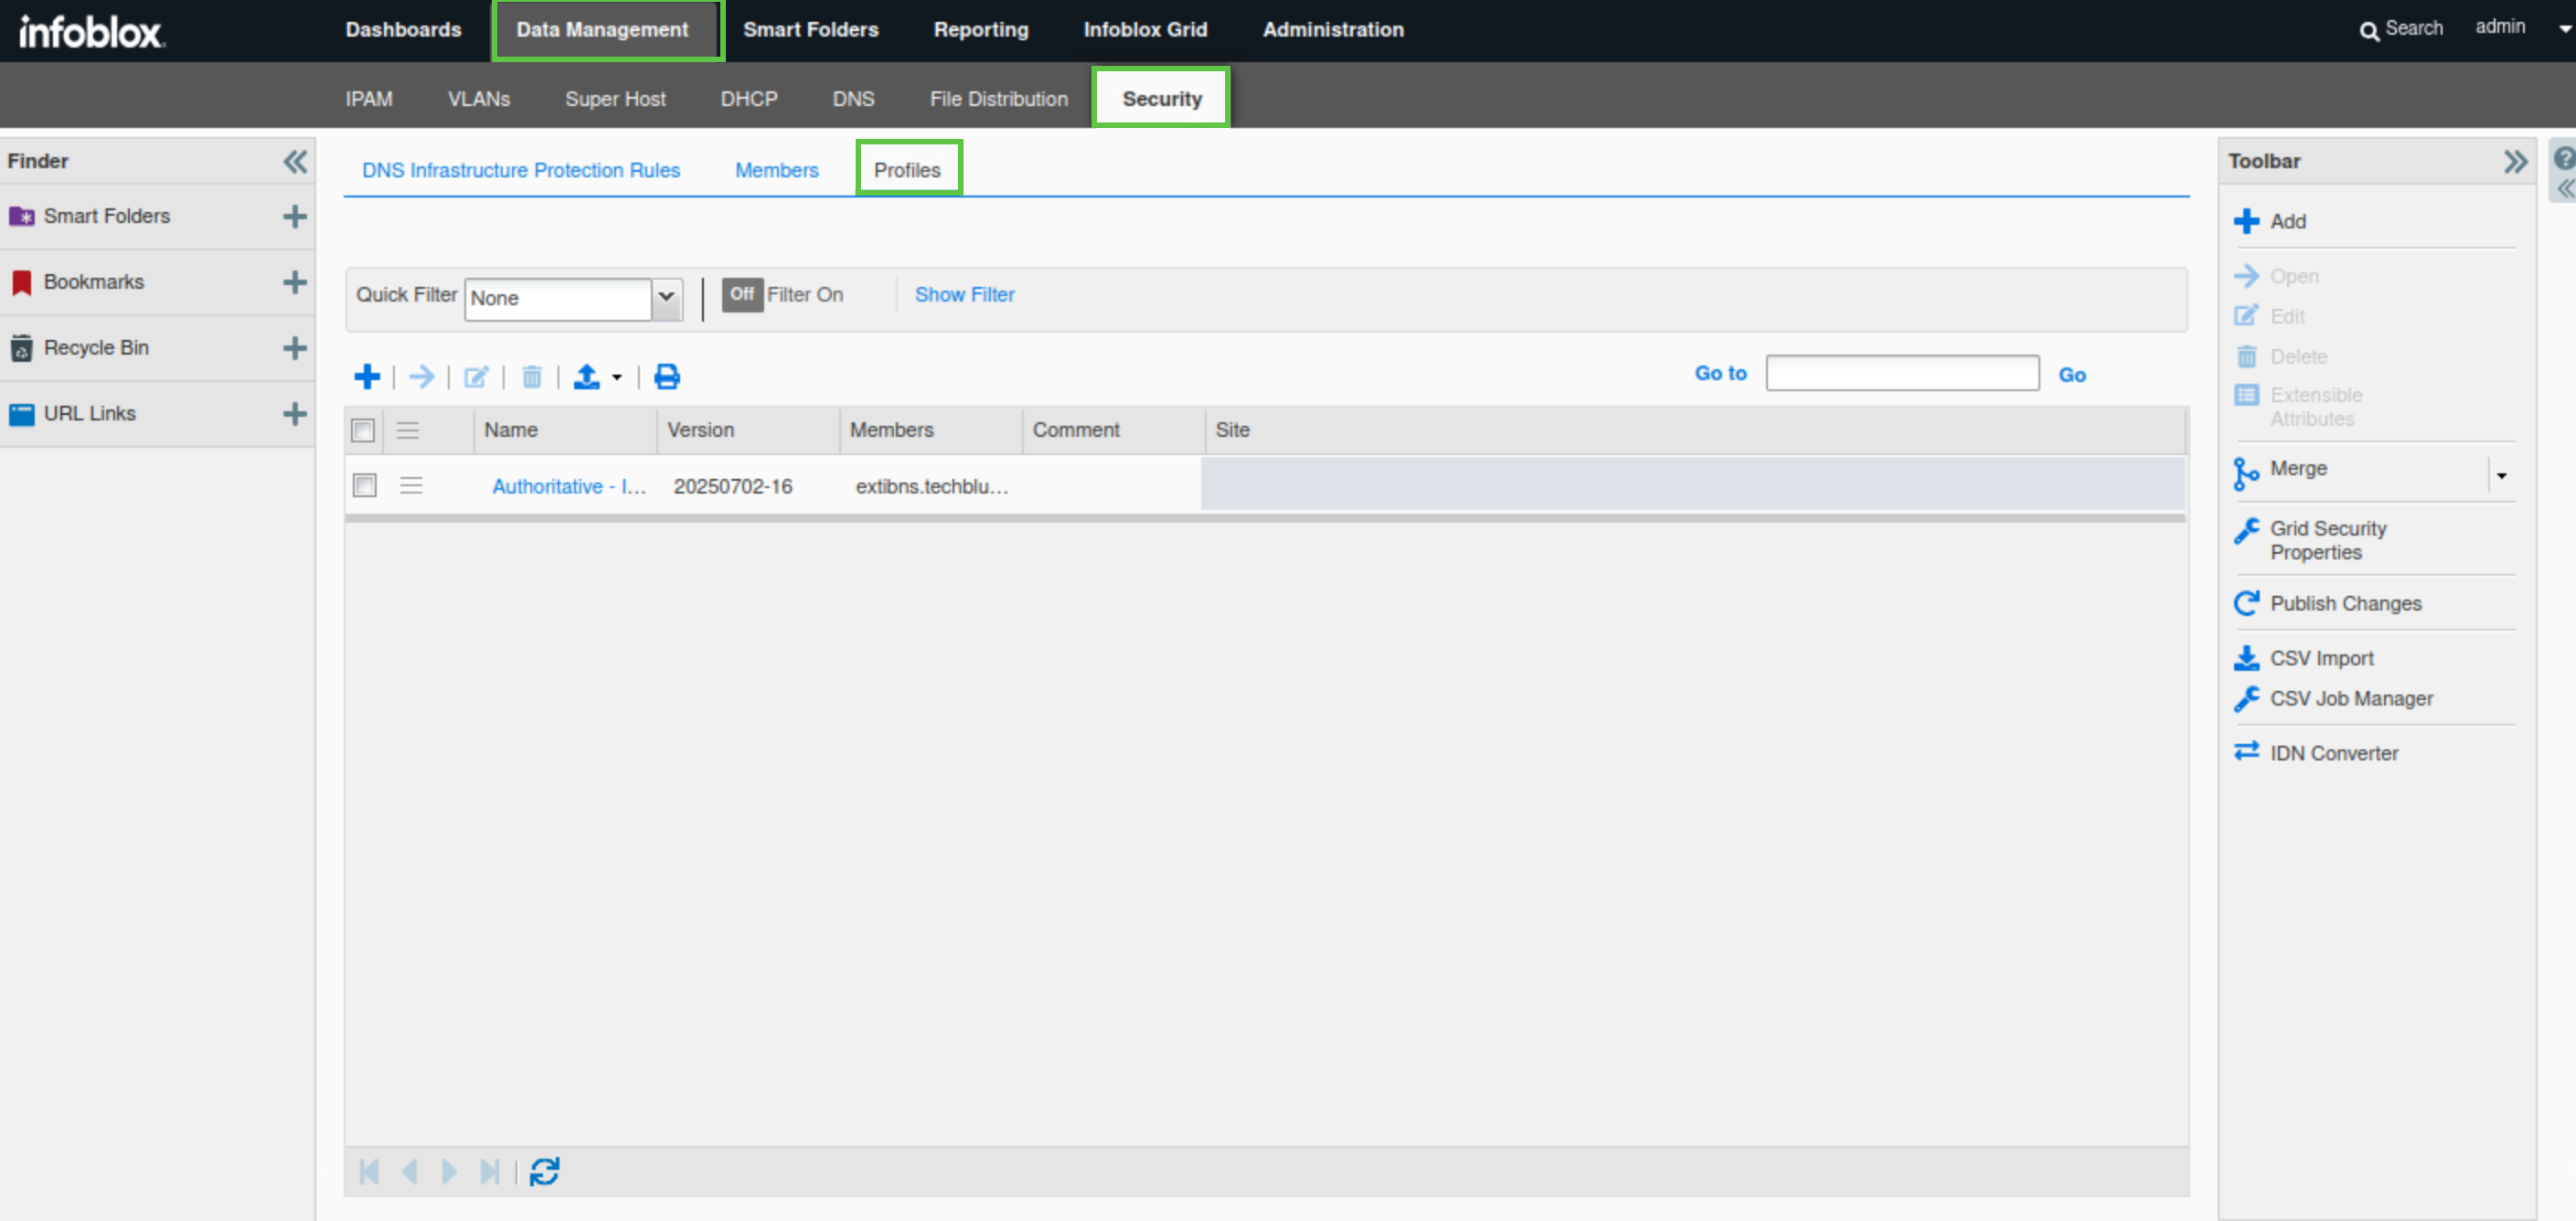
Navigate to Data Management → Security → Profiles
-
One profile will be listed, an untuned profile Authoritative - Initial Config used by the Grid member extibns.techblue.net
-
Task 2 Solution: Set up the Reporting Server
In this task, we will set up the Grid’s Reporting Server so we can view and analyse its DNS Infrastructure Protection dashboards and reports in later steps. These reports will be used to identify noisy clients and establish a baseline for DNS traffic flow.
-
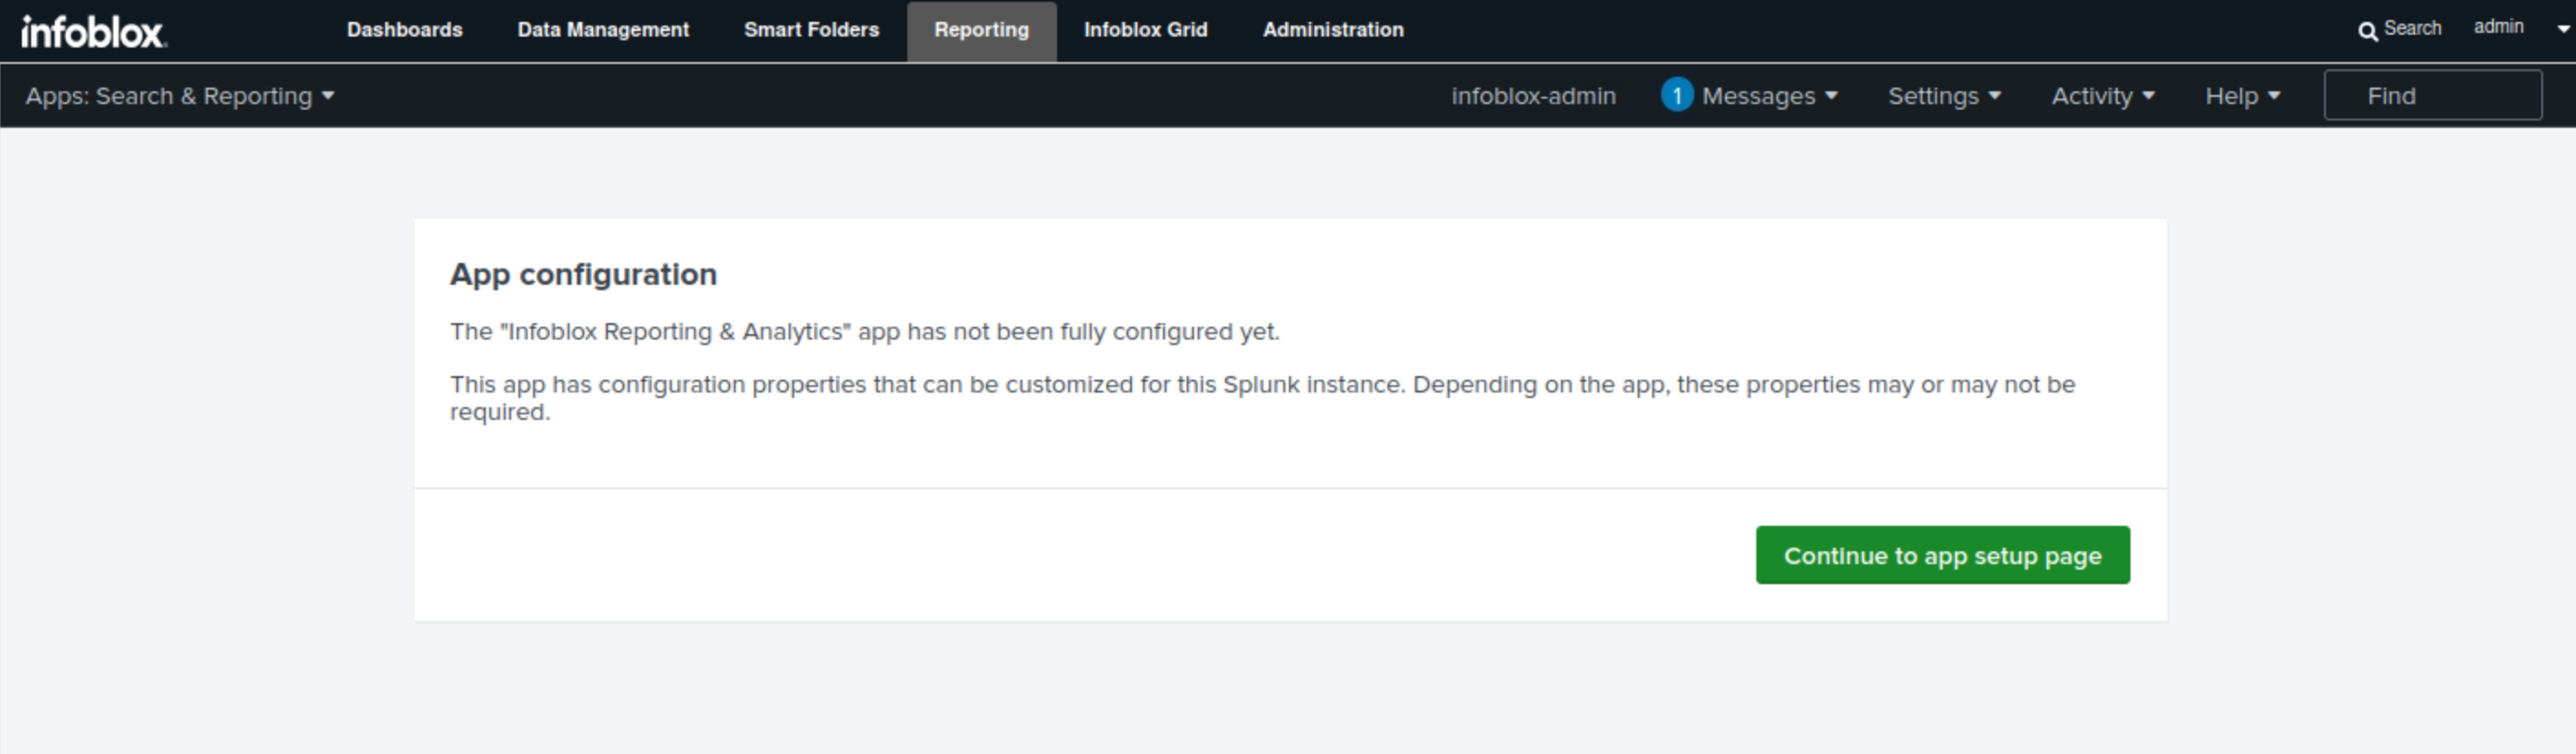
Navigate to Reporting
-
Click Continue to app setup page.
-
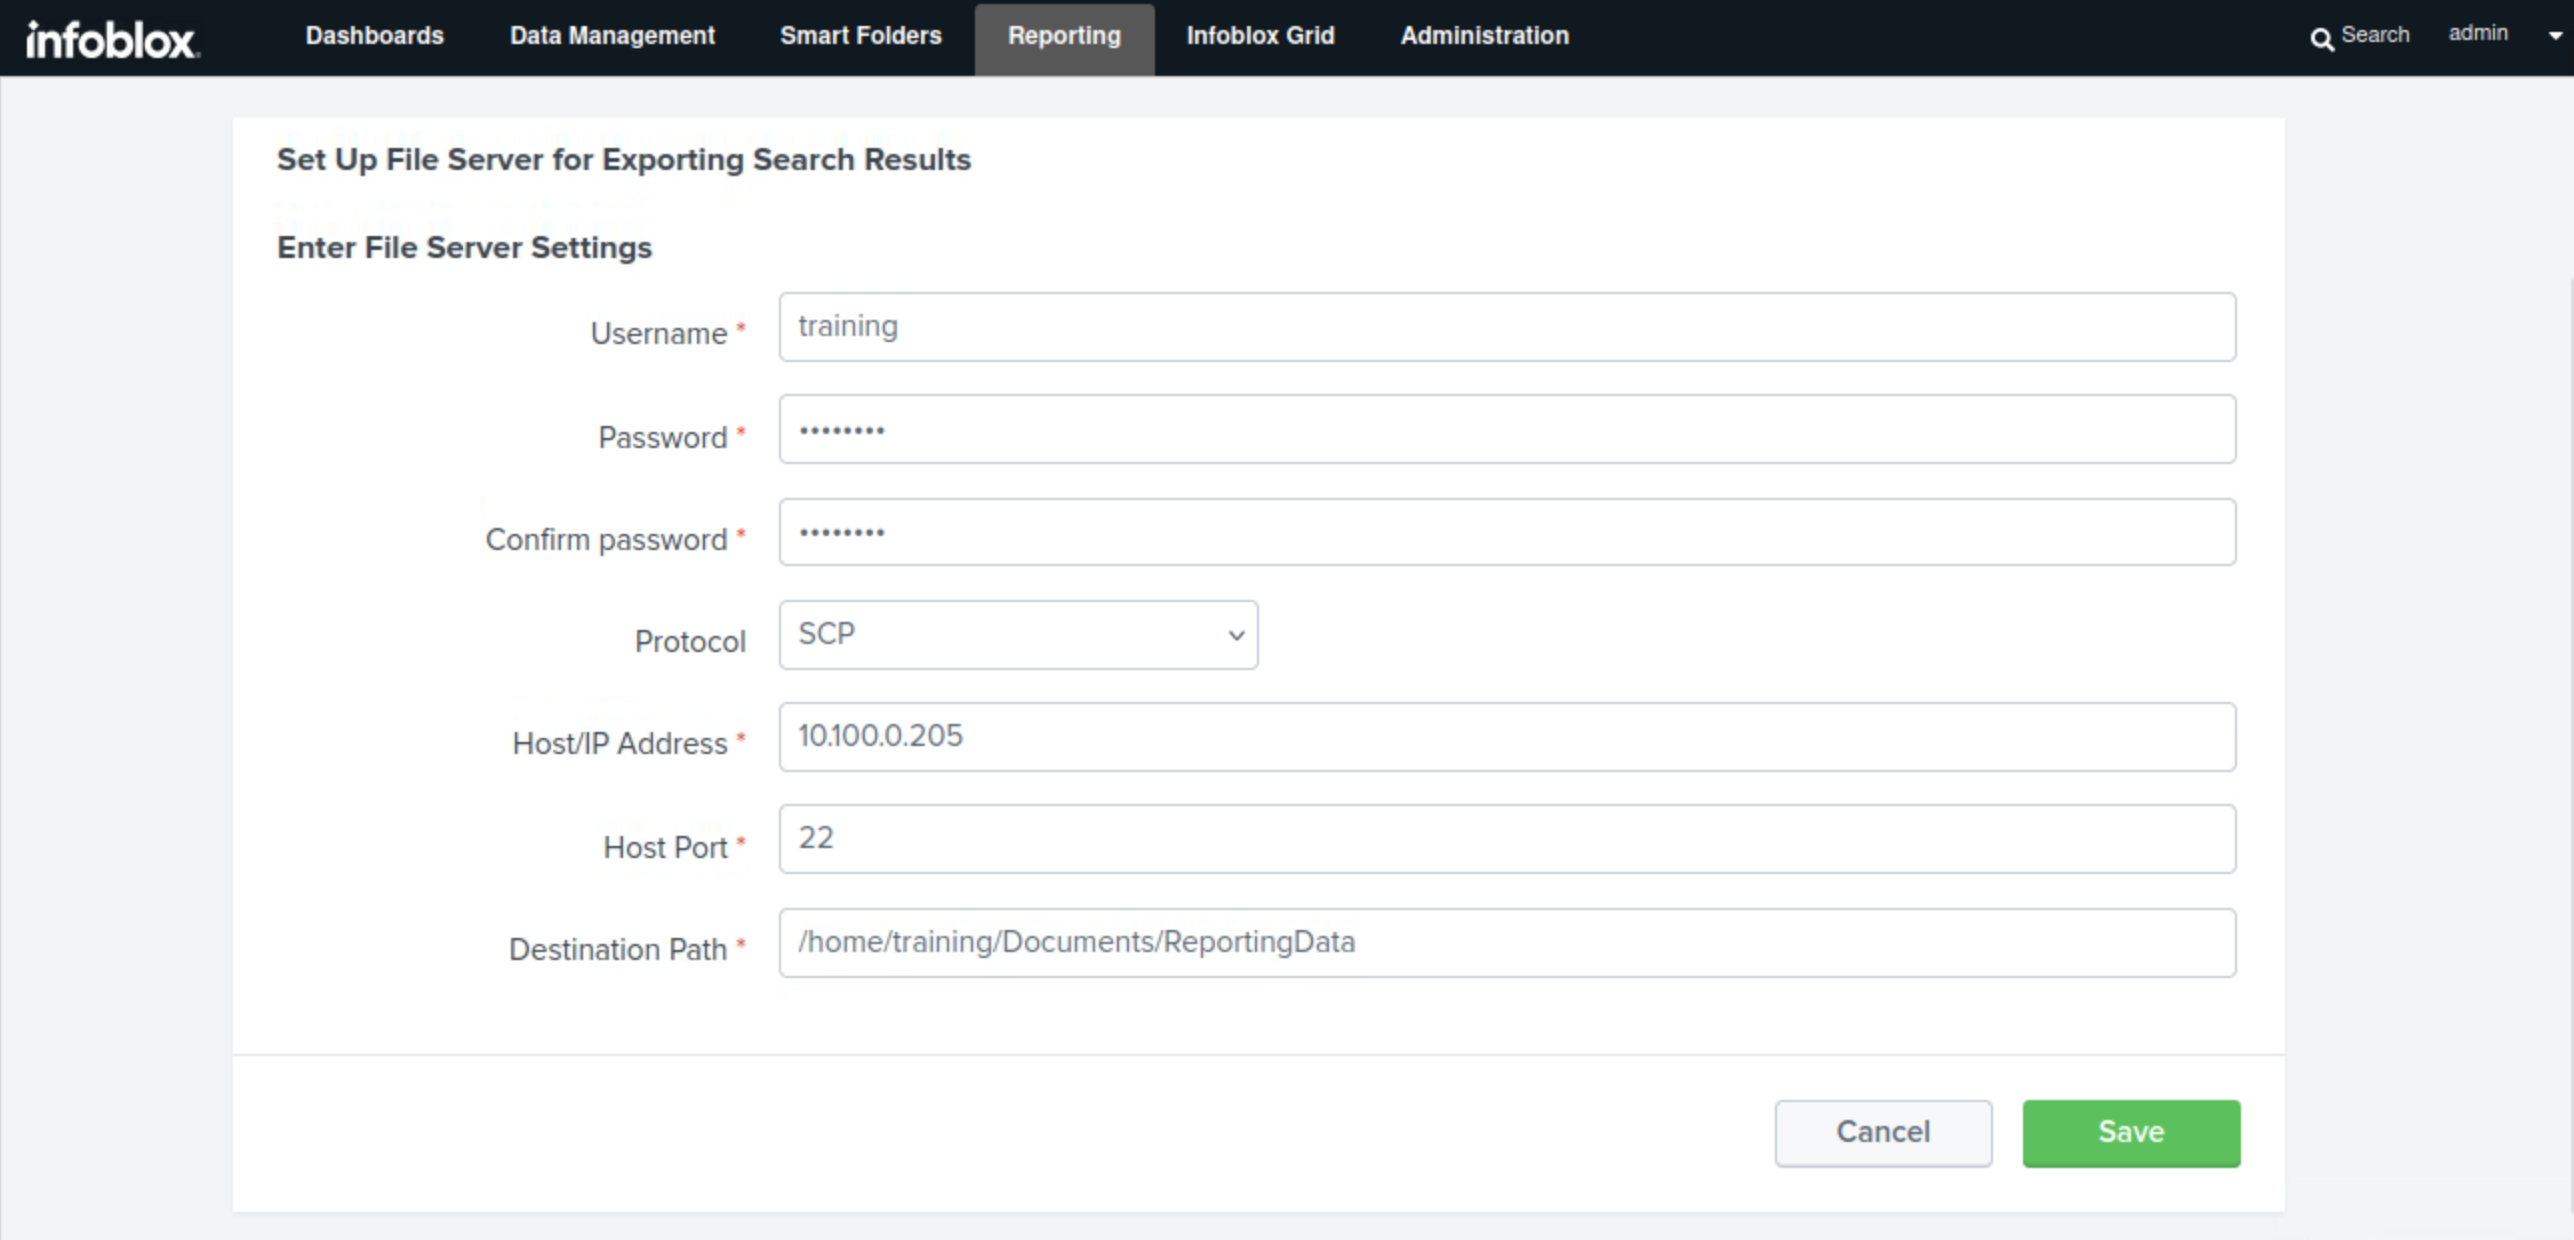
Use the information from this table to set up the reporting server:
|
Configuration |
Value |
|
Username |
training |
|
Password |
infoblox |
|
Protocol |
SCP |
|
Host/ IP Address |
10.100.0.205 |
|
Port |
22 |
|
Path |
/home/training/Documents/ReportingData |
-
Click Save.
Task 3 Solution: Identify and Investigate Outliers
Leave the Grid running passively for 30 to 35 minutes to allow enough traffic to flow through the Grid and populate its dashboards and reports
In this task, we will use the Reporting Server dashboards, specifically the DNS Top Clients dashboard, to identify noisy clients or outliers. Noisy clients or outliers are hosts or IP addresses that make significantly more queries per second than the average. After identifying the outliers, we will investigate them. Some clients might have valid reasons for making more queries per second than the average; for example, an IP address might be a NAT address used by multiple devices.
Identifying and investigating noisy clients is important, as when we start tuning DNS Infrastructure Protection rules, we will run them to align with the traffic patterns of the majority of clients. So by identifying them, we can decide whether we need to create custom rules to allow, block, or rate-limit their specific traffic patterns.
Since the DNS Infrastructure Protection service hasn’t been running long enough, dashboards that show daily trends, such as the DNS Daily Peak Hour Query Rate by Member dashboard, will not be accurate or useful in this instance. However, this is an important dashboard to check in a production system where DNS Infrastructure Protection has been running for several days or weeks.
-
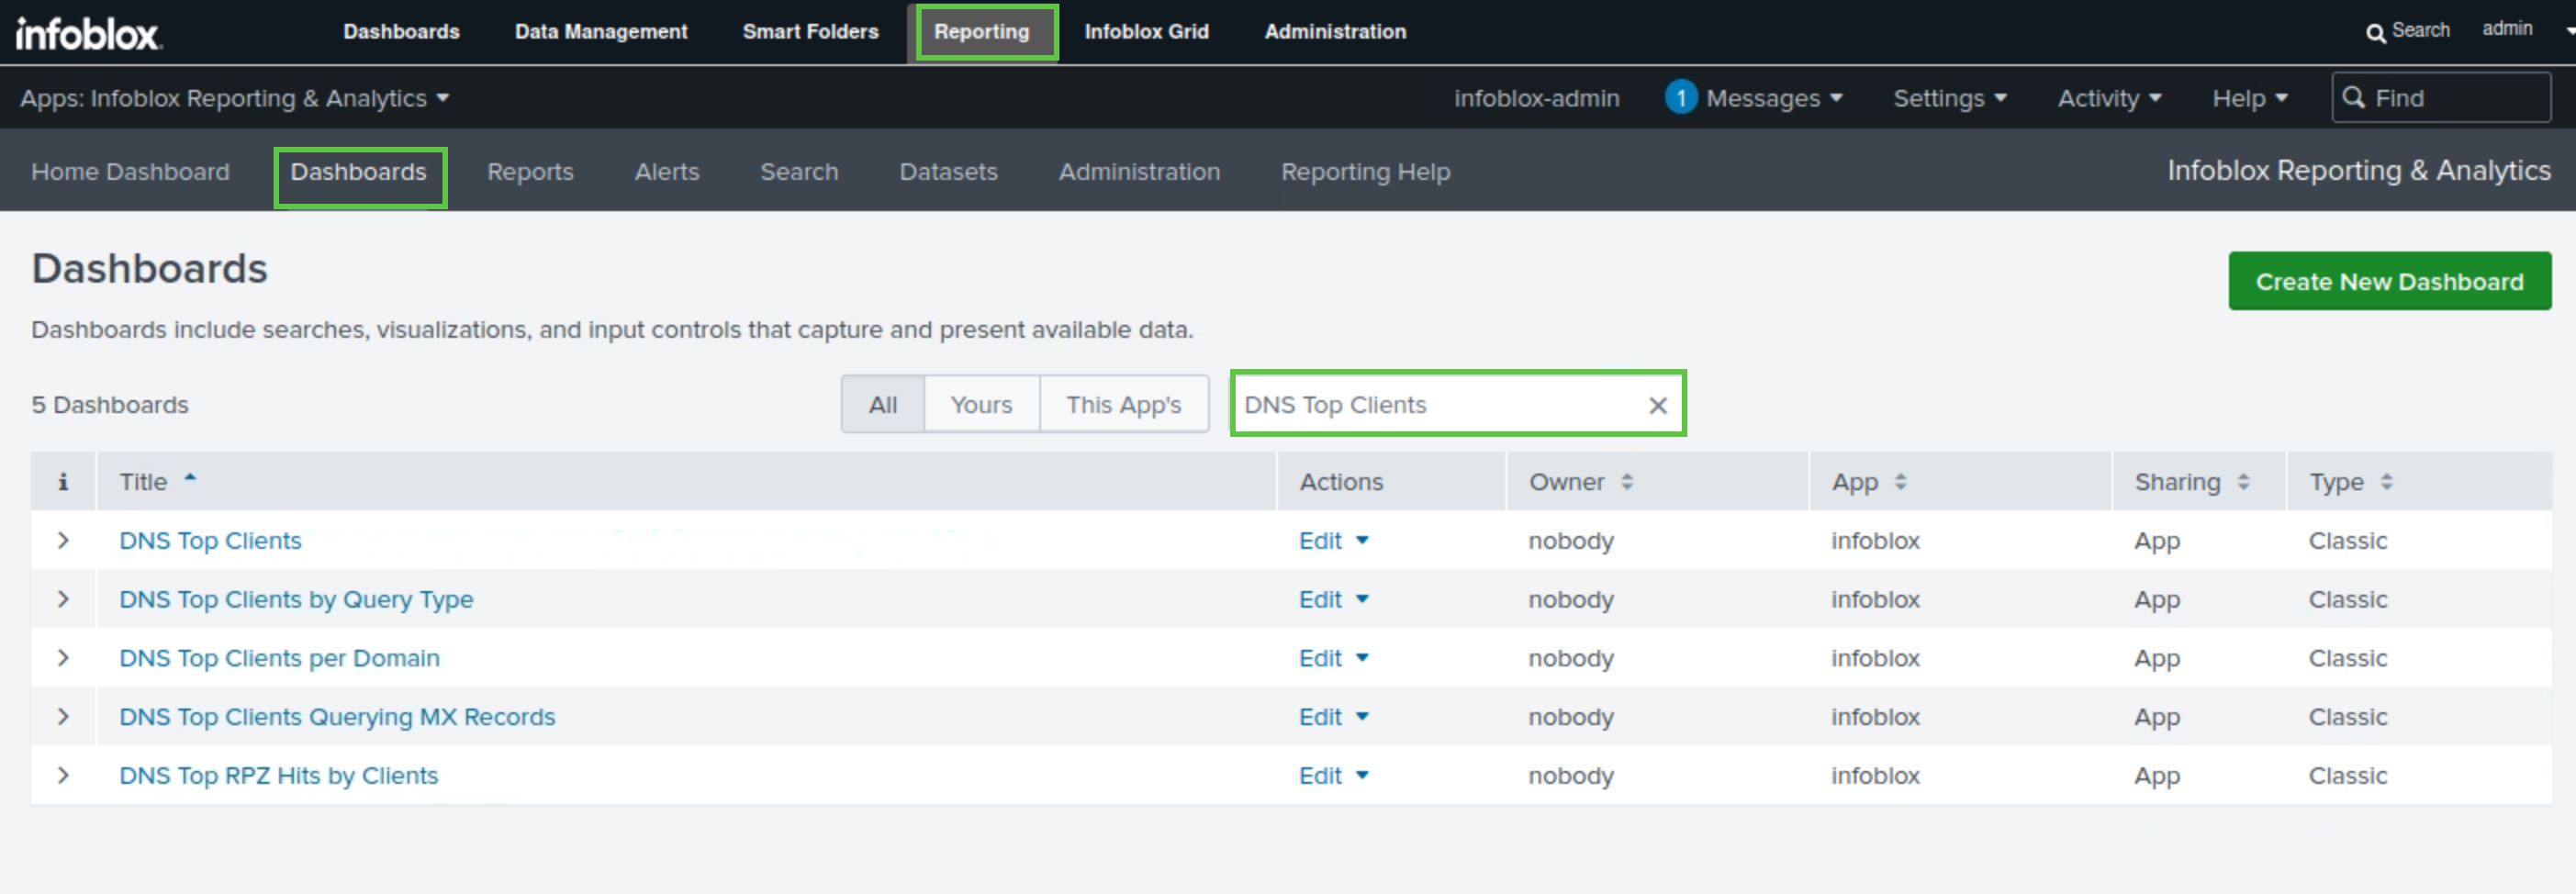
Navigate to Reporting → Dashboards.
-
Type DNS Top Clients in the search bar.
-
Select the DNS Top Clients dashboard.
-
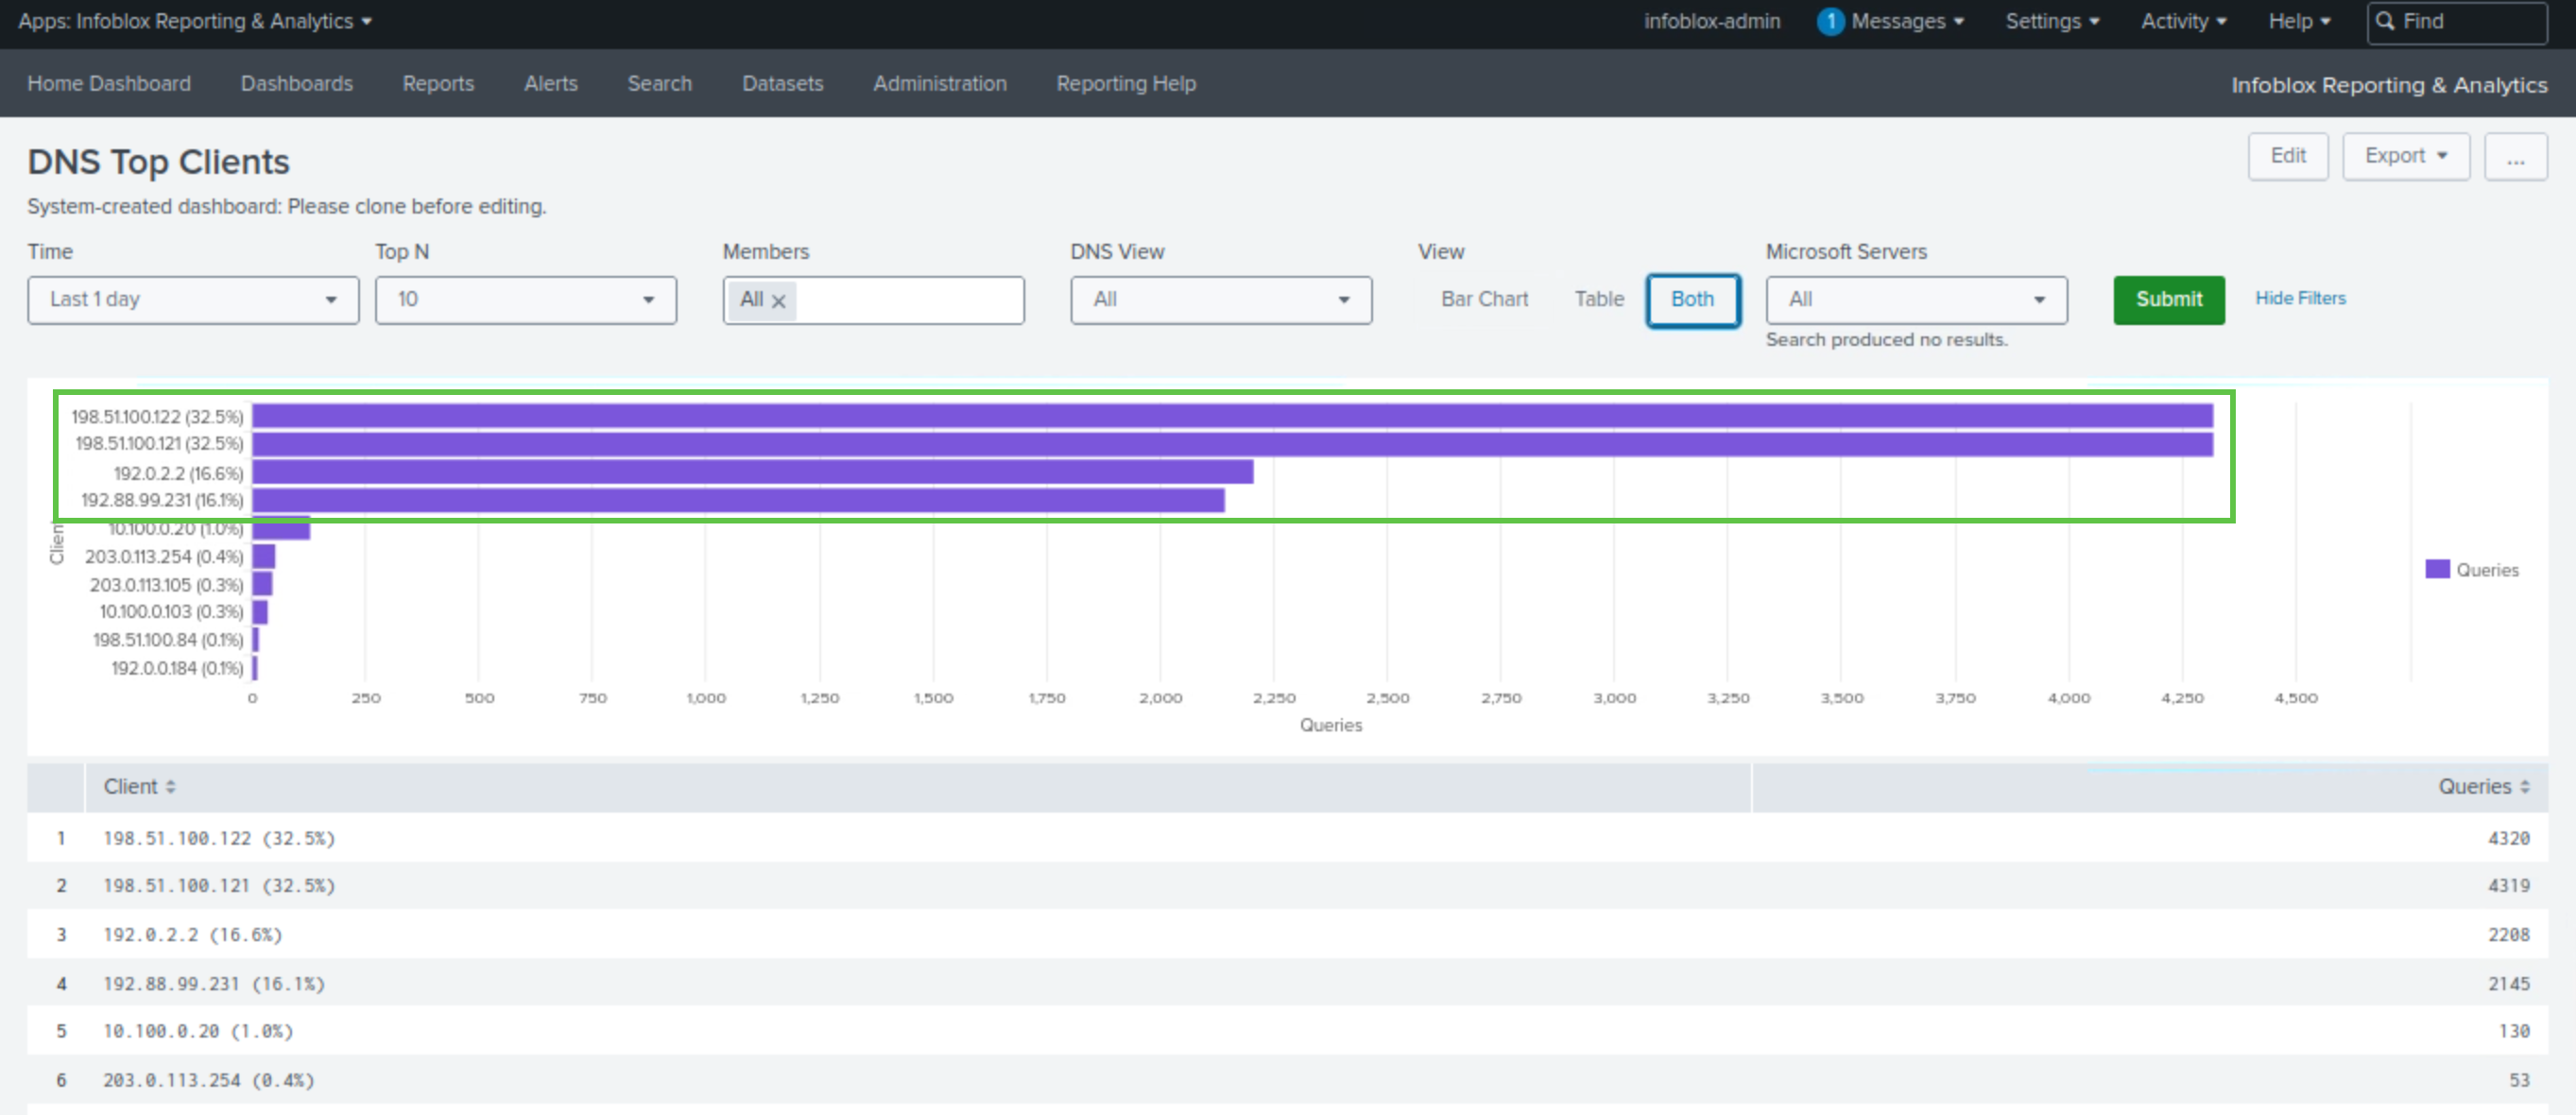
Click the Both button under the View section.
-
This will display both views of the dashboard, the Bar Chart and the Table.
-
-
Observe that four clients have significantly more queries than the majority.
-
The Client IP addresses are 198.51.100.121, 198.51.100.122, 192.88.99.231, and 192.0.2.2.
-
-
These hosts require further investigation. The investigation establishes that:
-
The hosts 192.0.2.2 and 192.88.99.231 belong to local companies with which our organization does business. The hosts are using NAT, and a large number of clients are behind those two IP addresses, accessing our services. As a result, we expect these hosts to make a higher-than-average number of queries. As a result, we can clear them from the outliers list.
-
The hosts 198.51.100.121 and 198.51.100.122 are the local ISP’s caching servers. They provide services to both home and business broadband users. As a result, they are also expected to make more queries than the average client. As a result, they should also be cleared from the outliers list.
-
In this lab environment, we will not act on this information due to technical limitations. However, in a production system, we need to decide whether to create custom rules to cater to the identified clients during the tuning process. If you are unsure about how to tune your production DNS Infrastructure Protection-enabled appliances, we recommend engaging Infoblox Professional Services
-
Task 4 Solution: Establish a Baseline
In this task, we will use the DNS Query Rate By Member dashboard to establish the normal DNS query rate per second. This value will be used by various rules, either directly or indirectly, to set them appropriately so they trigger at the right time without negatively affecting our environment’s operation.
In a production system, we would also use the DNS Query Rate by Member and the Daily Peak Hour Query Rate by Member dashboards. However, since the DNS Infrastructure Protection service hasn’t been running long enough, dashboards that show daily trends will not be accurate or useful in this instance.
-
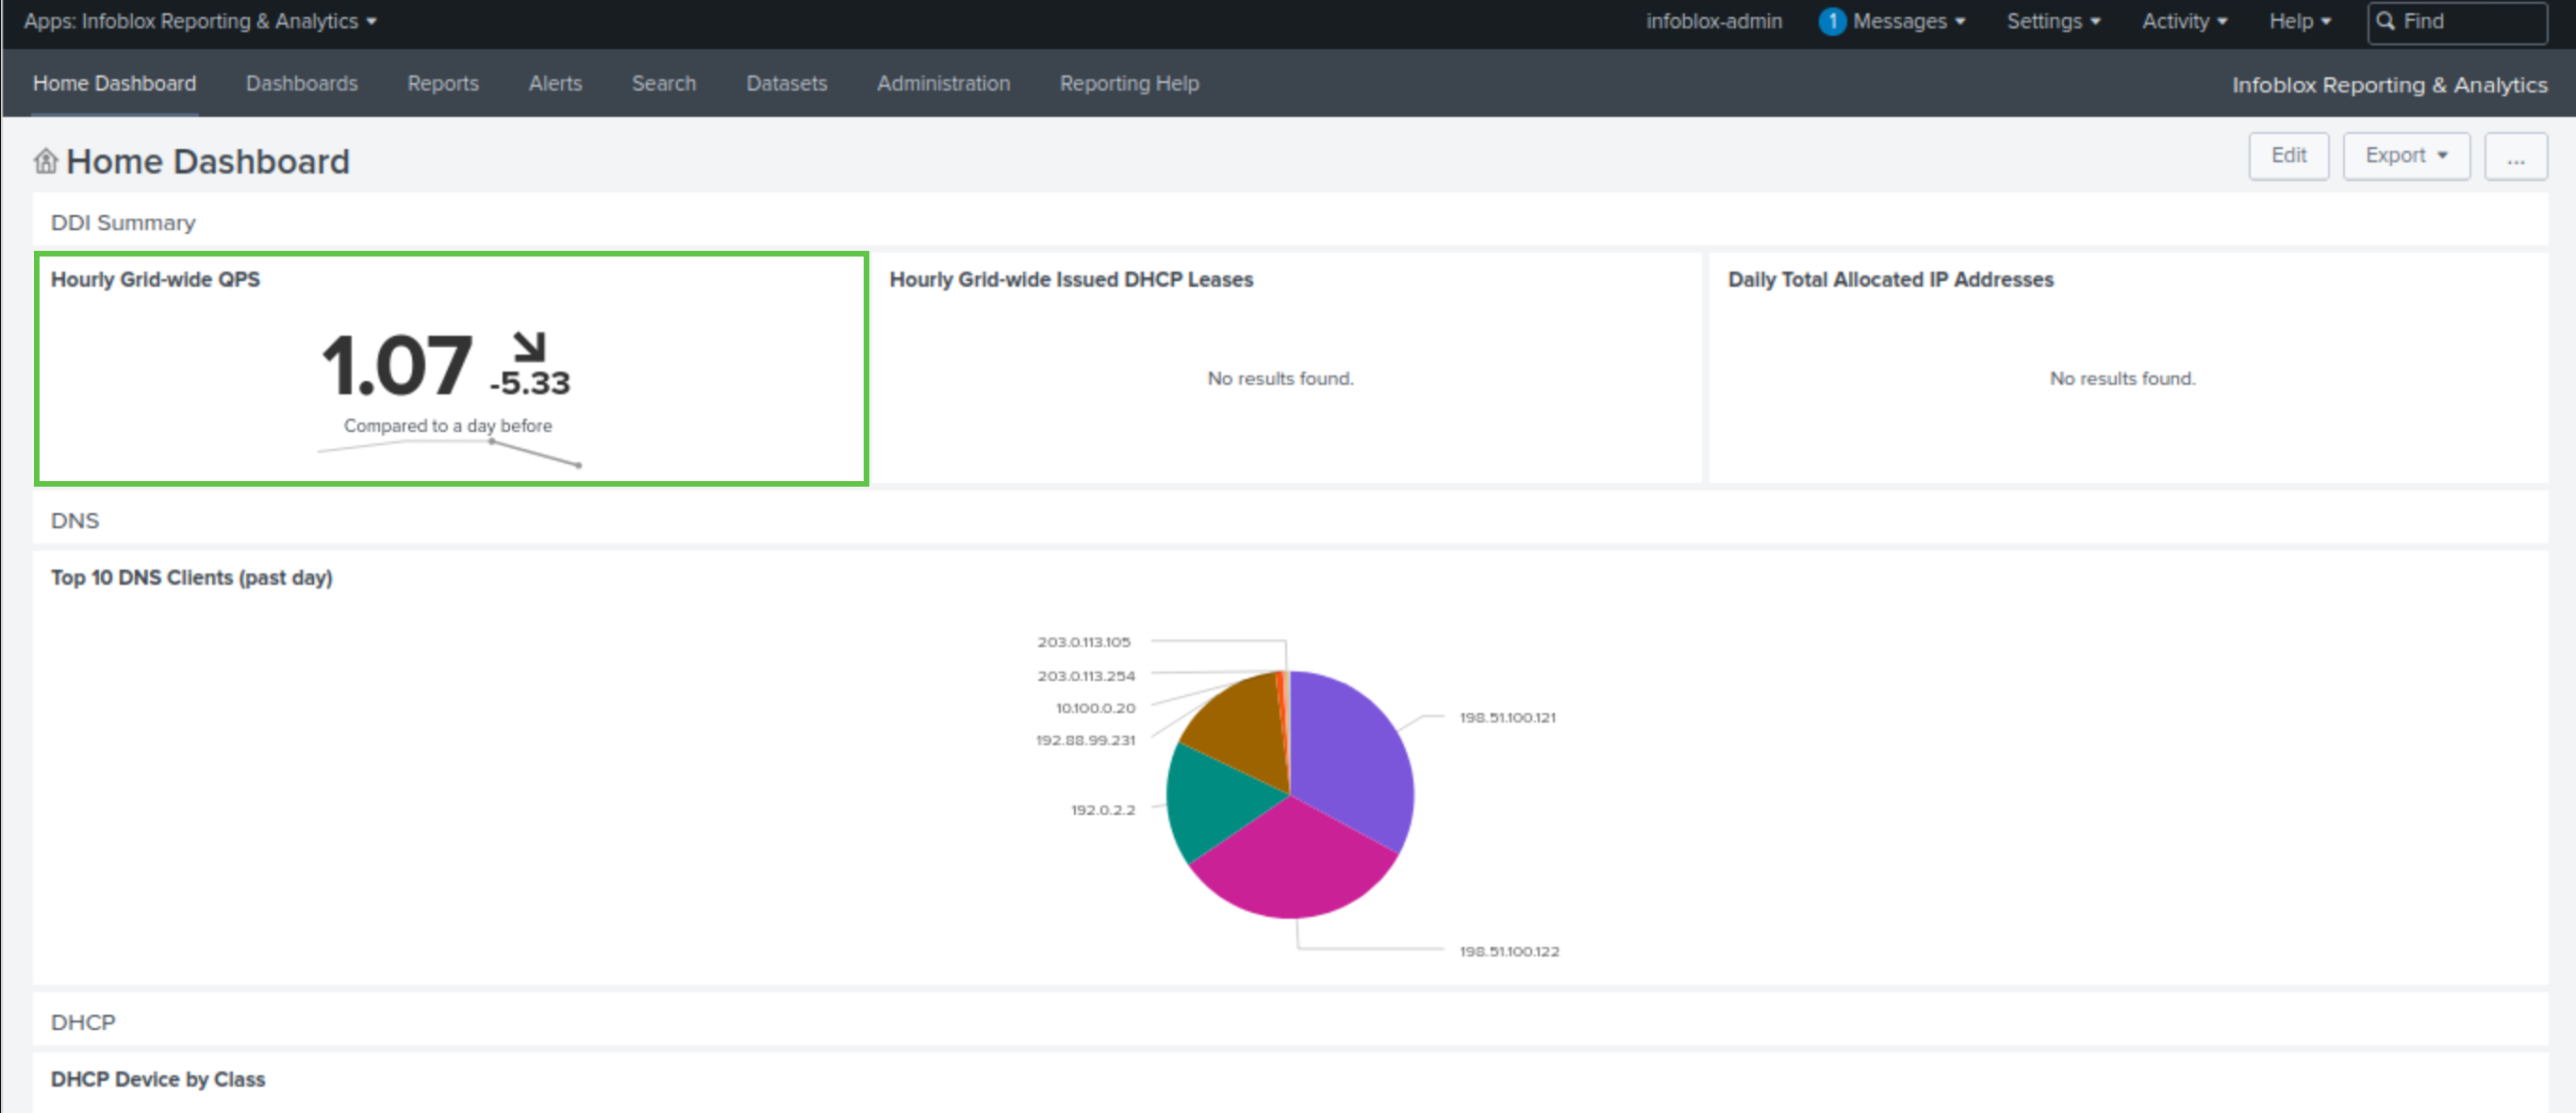
Navigate to Reporting → Home Dashboard
-
Click on the Hourly Grid-wide QPS widget, which will take us to the DNS Query Rate By Member dashboard.
-
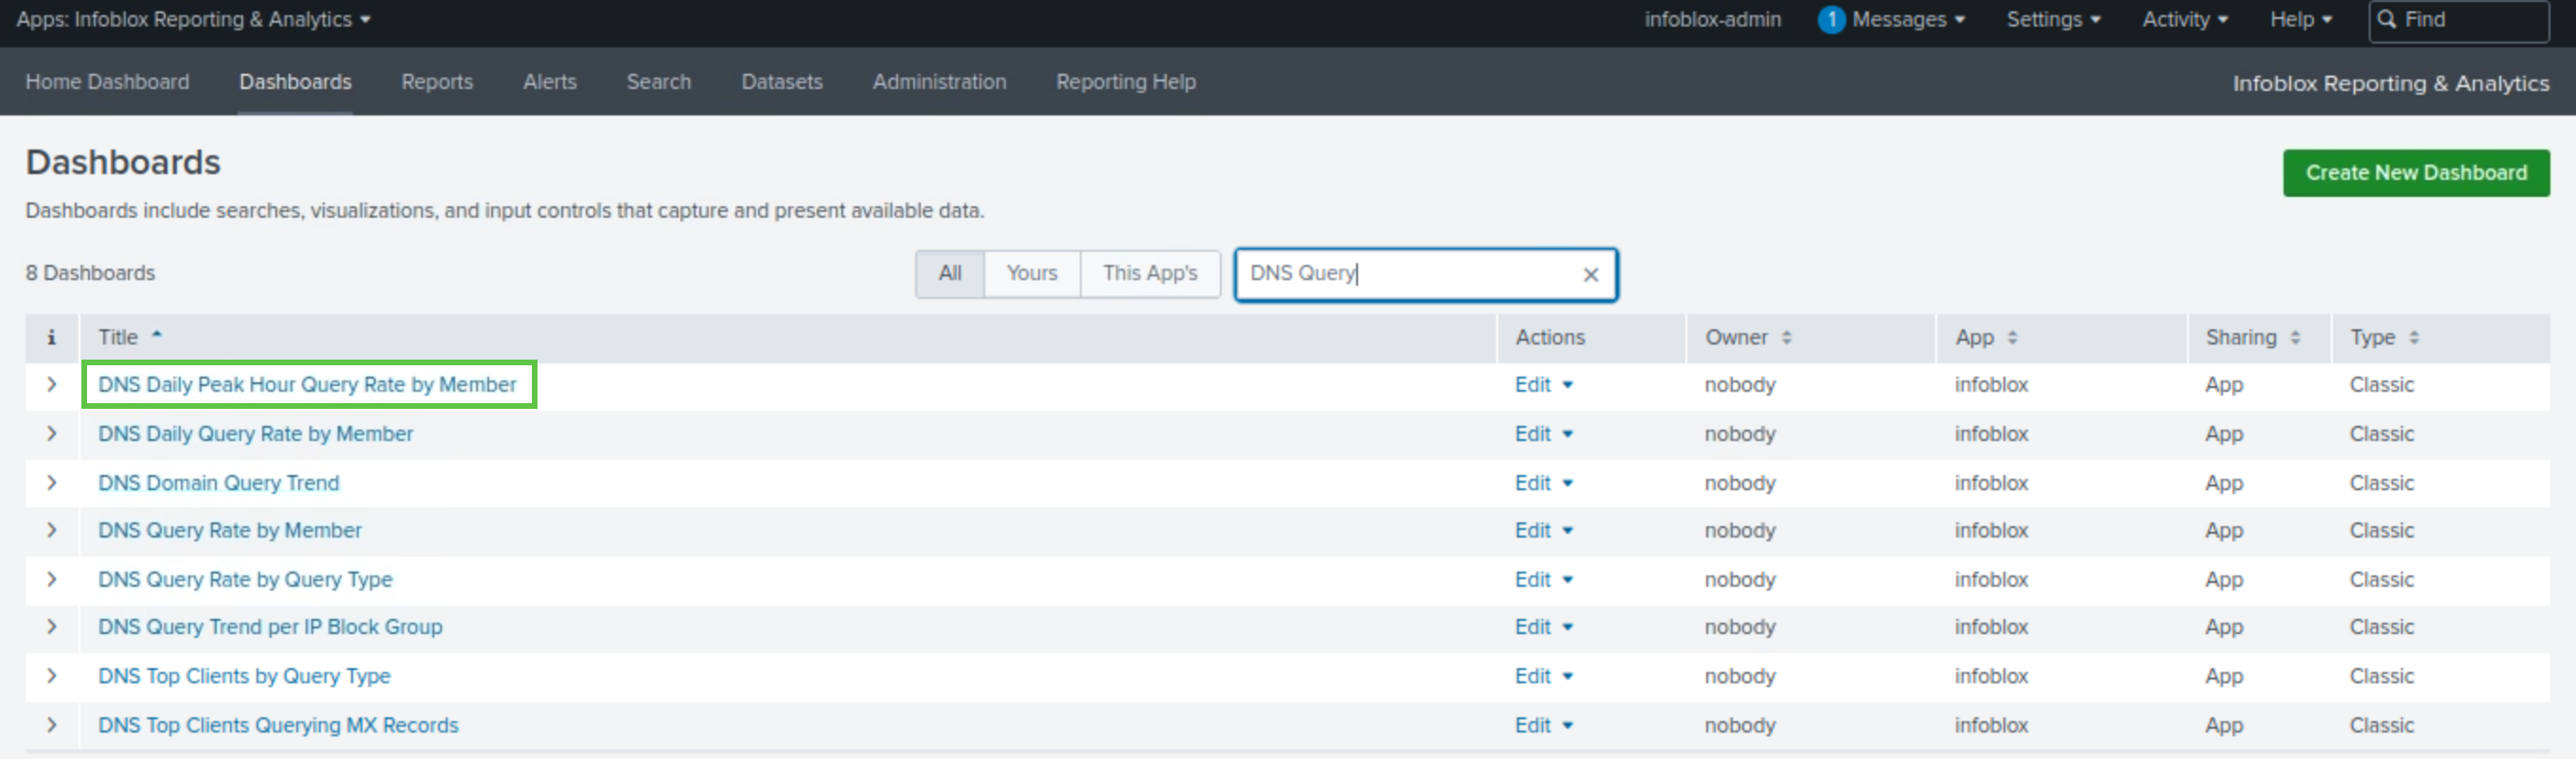
Alternatively, you can navigate to Reporting → Dashboards
-
Type DNS Query Rate By Member in the search bar.
-
Select the DNS Query Rate By Member dashboard.
-
The graph shows the trend in our DNS Queries Per Second over the past 24 hours.
-
The graph will display the average query rate for all DNS-enabled Grid members in a stacked area format. Our system includes two DNS-enabled members: ibns1.techblue.net and extibns.techblue.net. However, only extibns.techblue.net offers DNS Infrastructure Protection services, so we will focus on its average DNS Queries Per Second value.
-
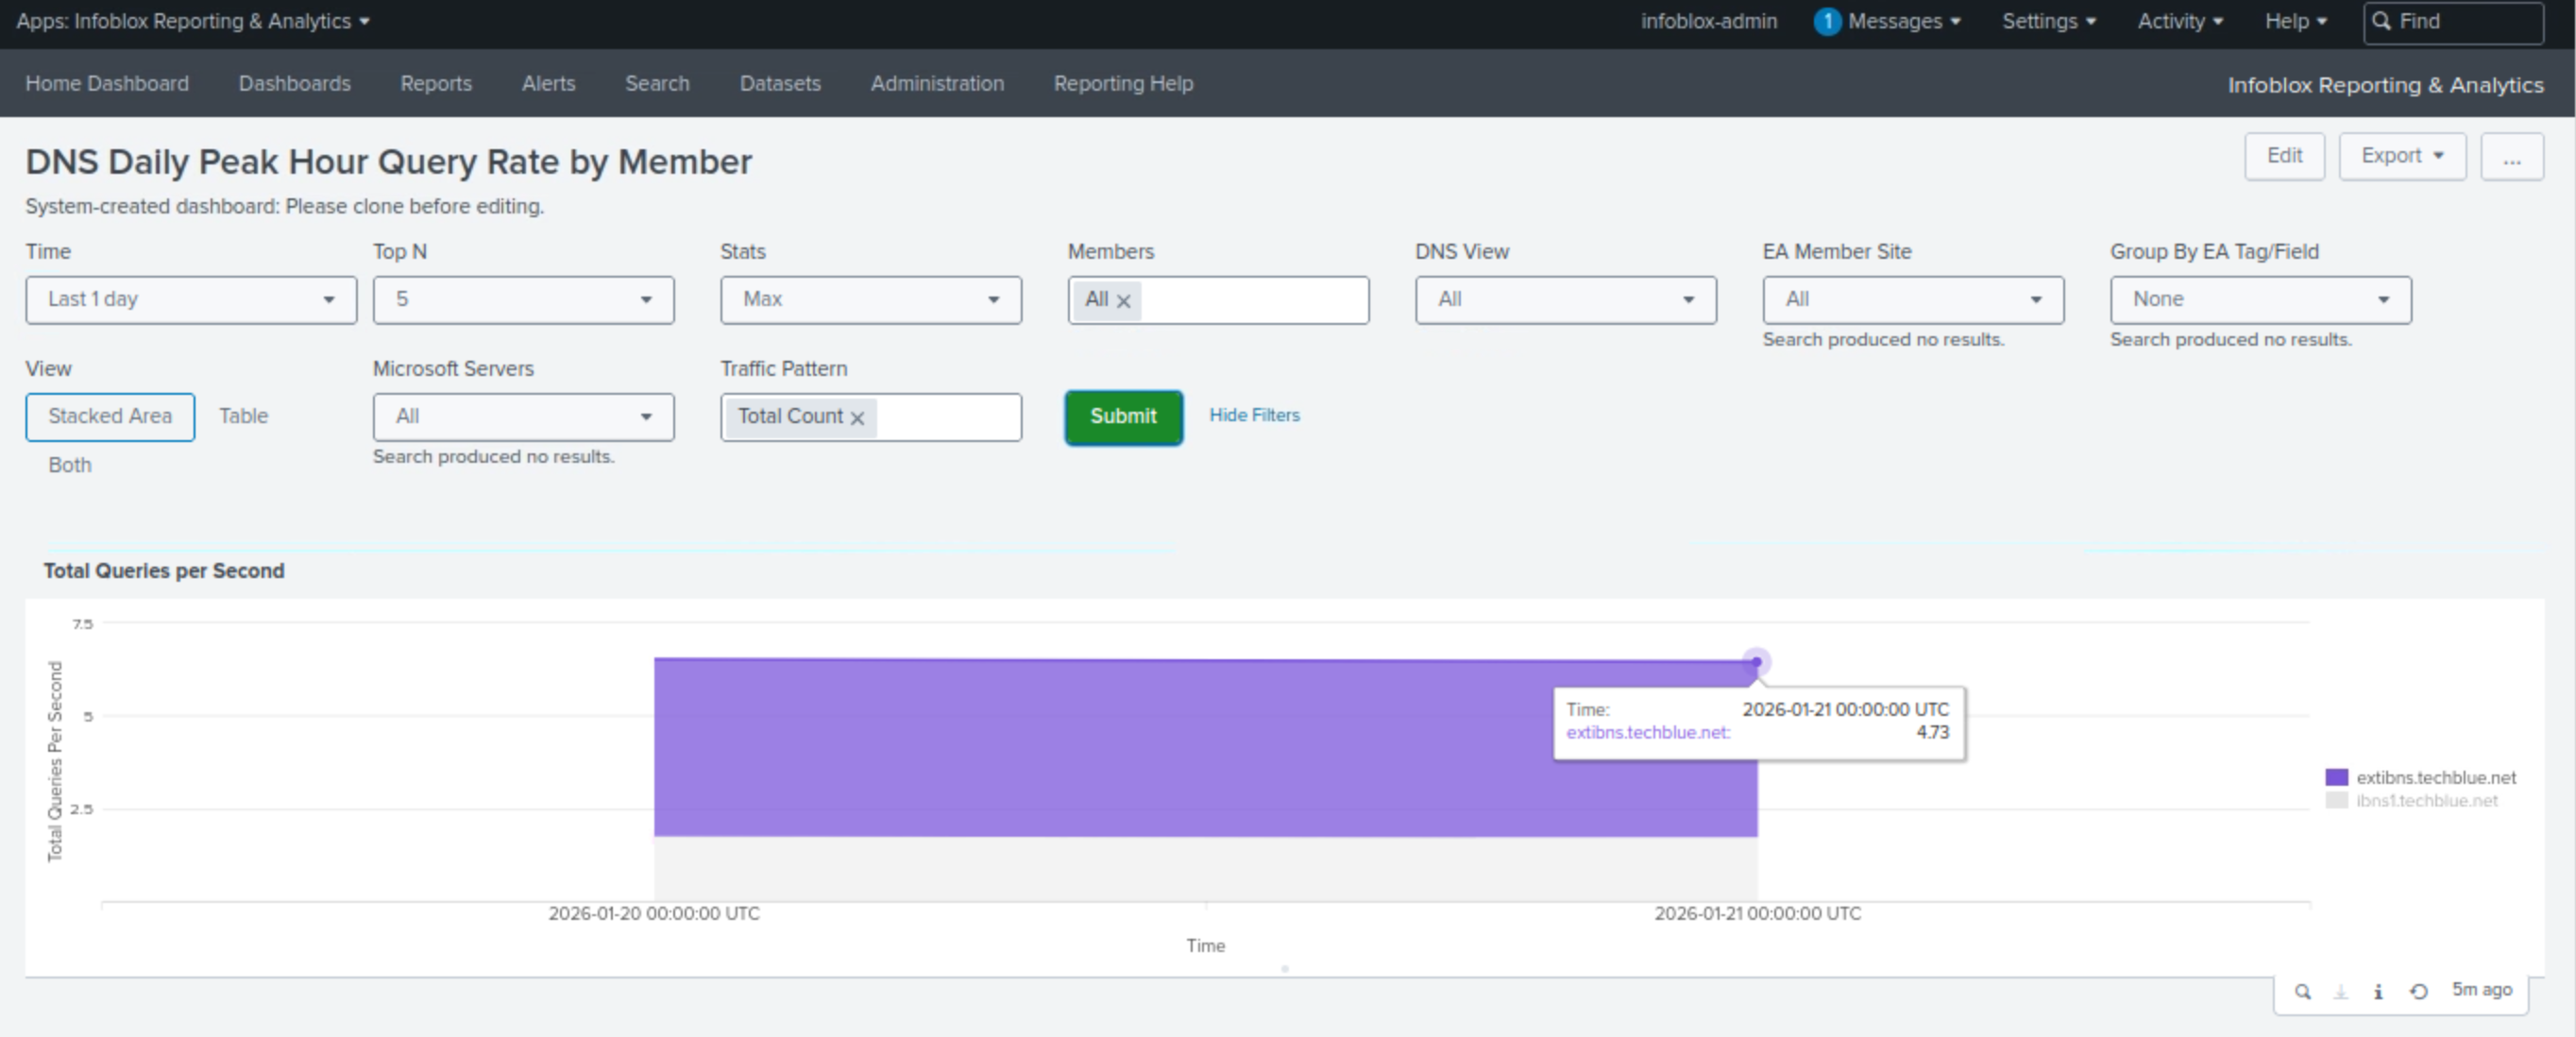
By analysing the graph, we can conclude that:
-
extibns.techblue.net’s average QPS for the past 24 hours is approximately 4.7 queries per second.
-
As this is a lab environment, this value is very low. Infoblox DNS servers can easily handle thousands of queries per second. For the purposes of this lab and testing, we will use higher values so you can see what happens when rules are triggered.
-
If you are unsure about how to tune your production DNS Infrastructure Protection-enabled appliances, we recommend engaging Infoblox Professional Services.
-
-
Task 5 Solution: Create a Profile for Tuned Rulesets
In this task, we will create an additional profile named Authoritative - Tuned and assign it to extibns.techblue.net. The new profile is used to customize and tune the DNS Infrastructure Protection service provided by extibns.techblue.net.
It is recommended to use profiles when tuning DNS Infrastructure Protection, as they simplify grouping and tuning NIOS grid members that perform similar functions.
The Authoritative - Initial Config profile we created in the previous lab will be left alone just as a precaution, in case we need to quickly rollback extibns.techblue.net to a profile with a base ruleset at any time now or in the future.
-
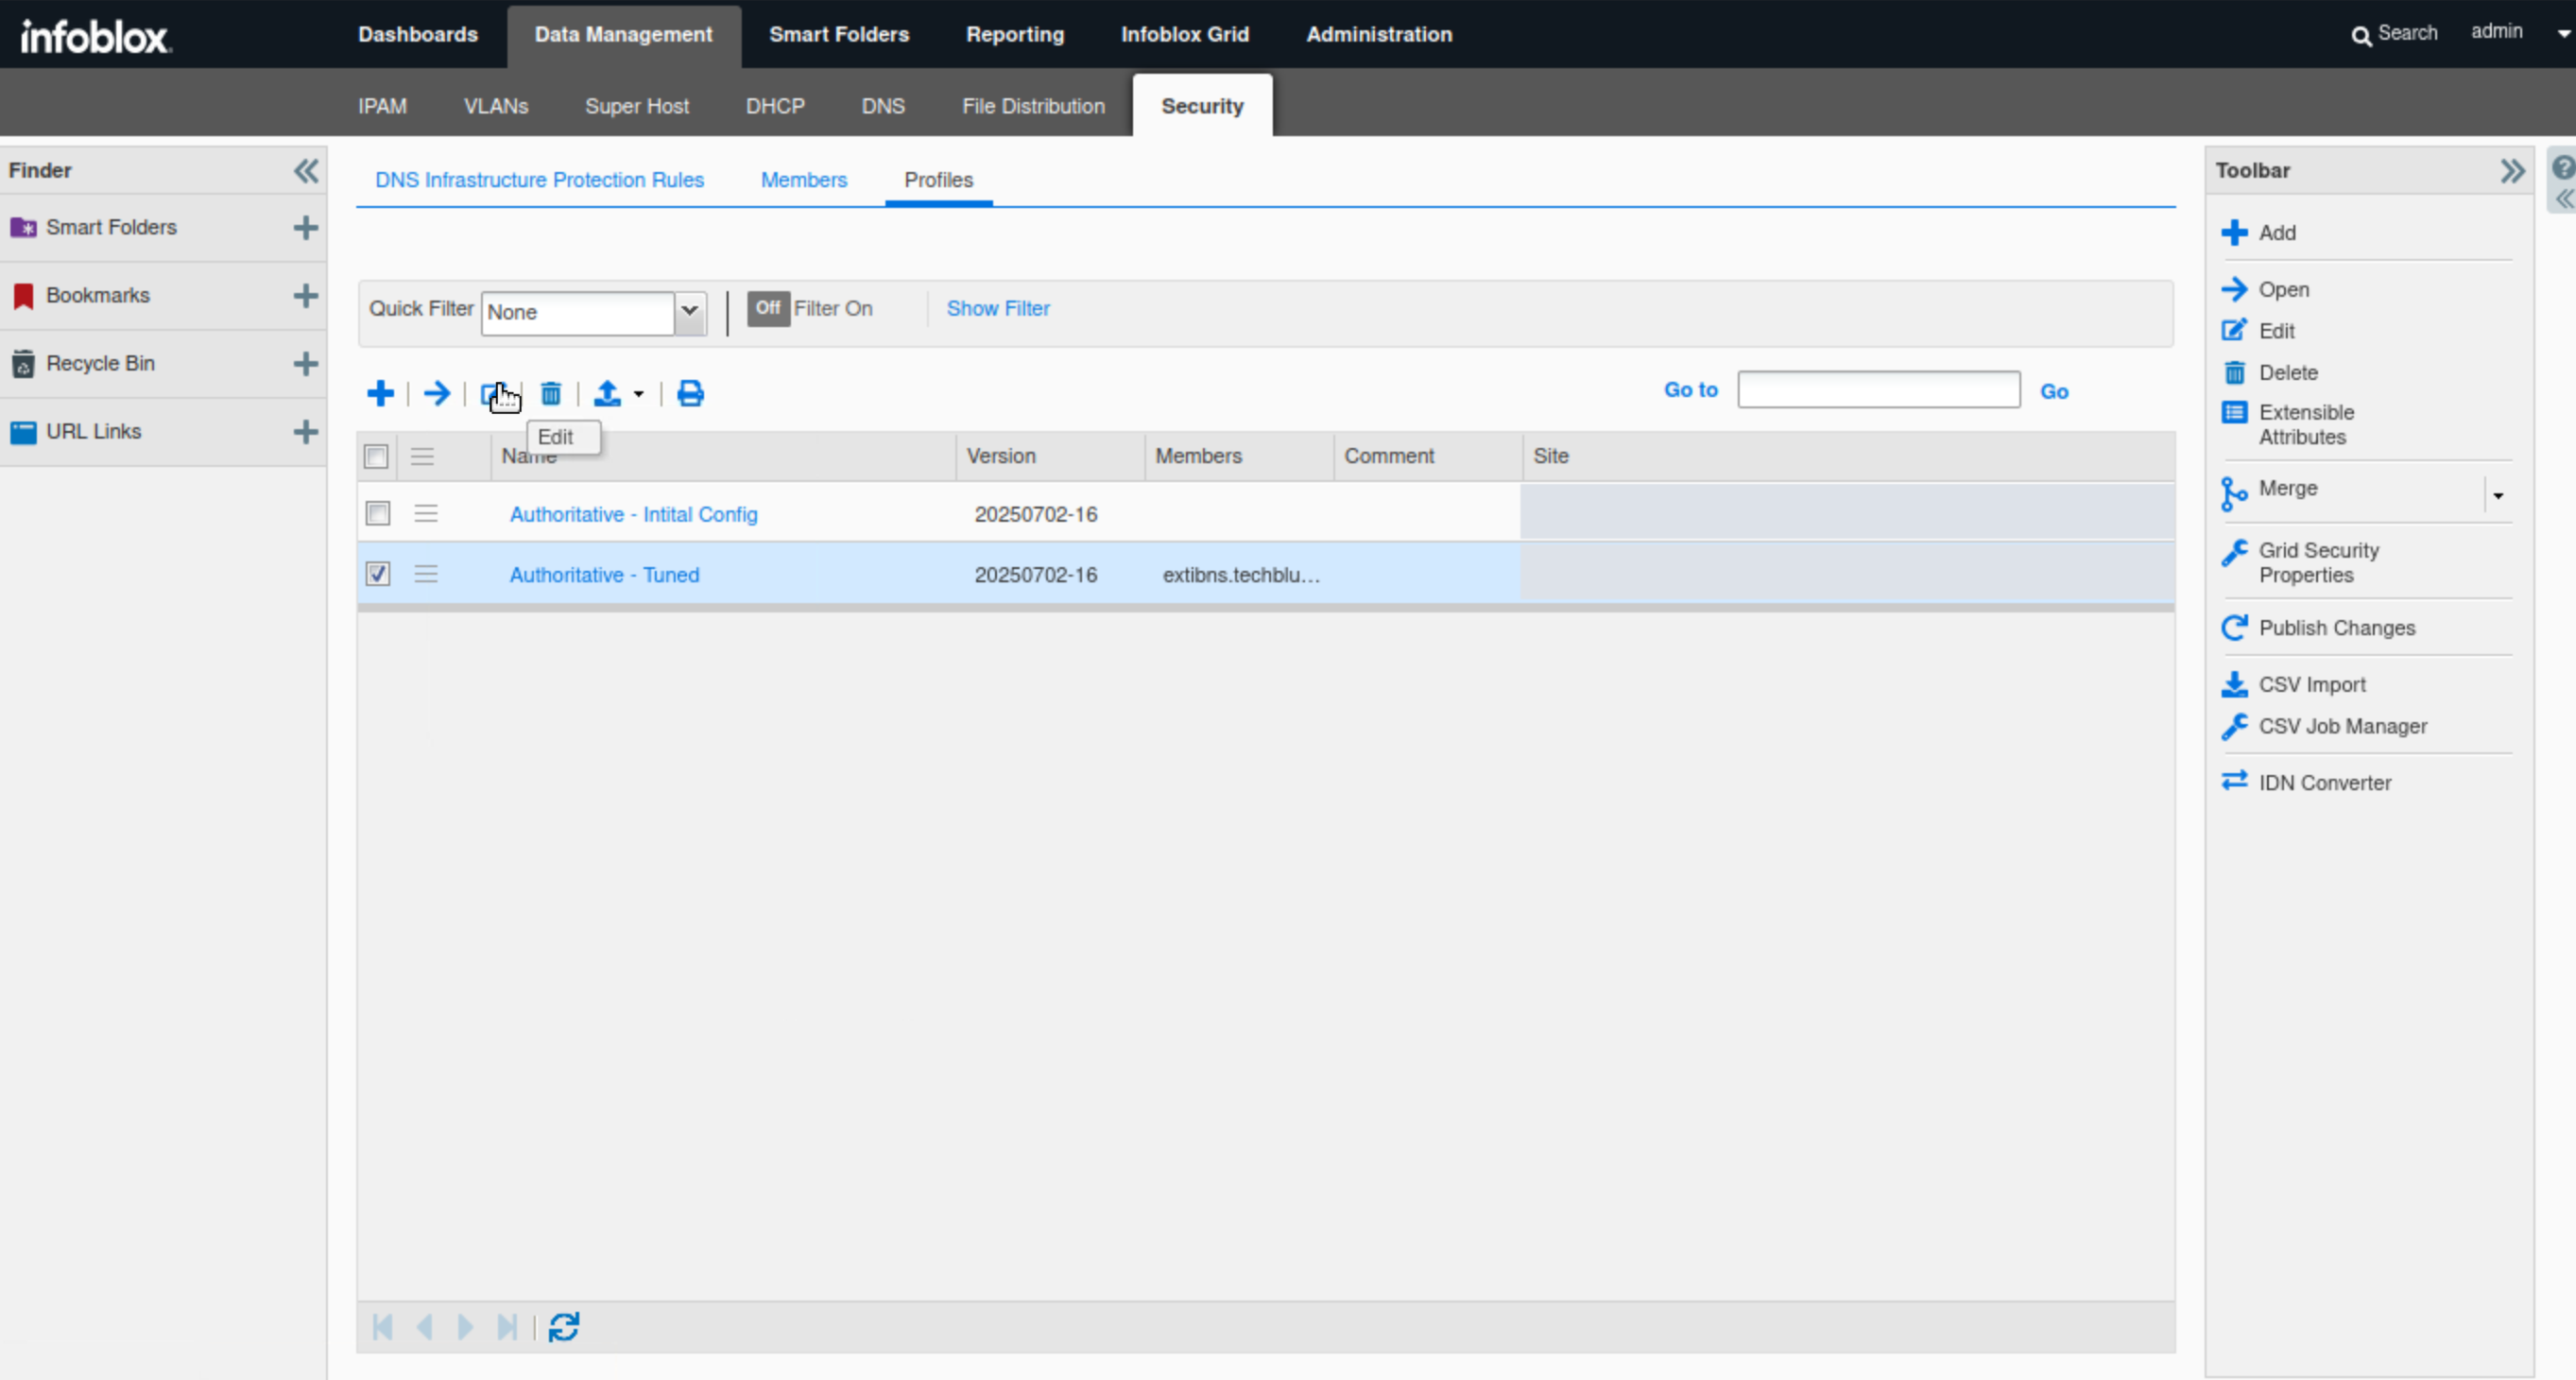
Navigate to Data Management → Security → Profiles.
-
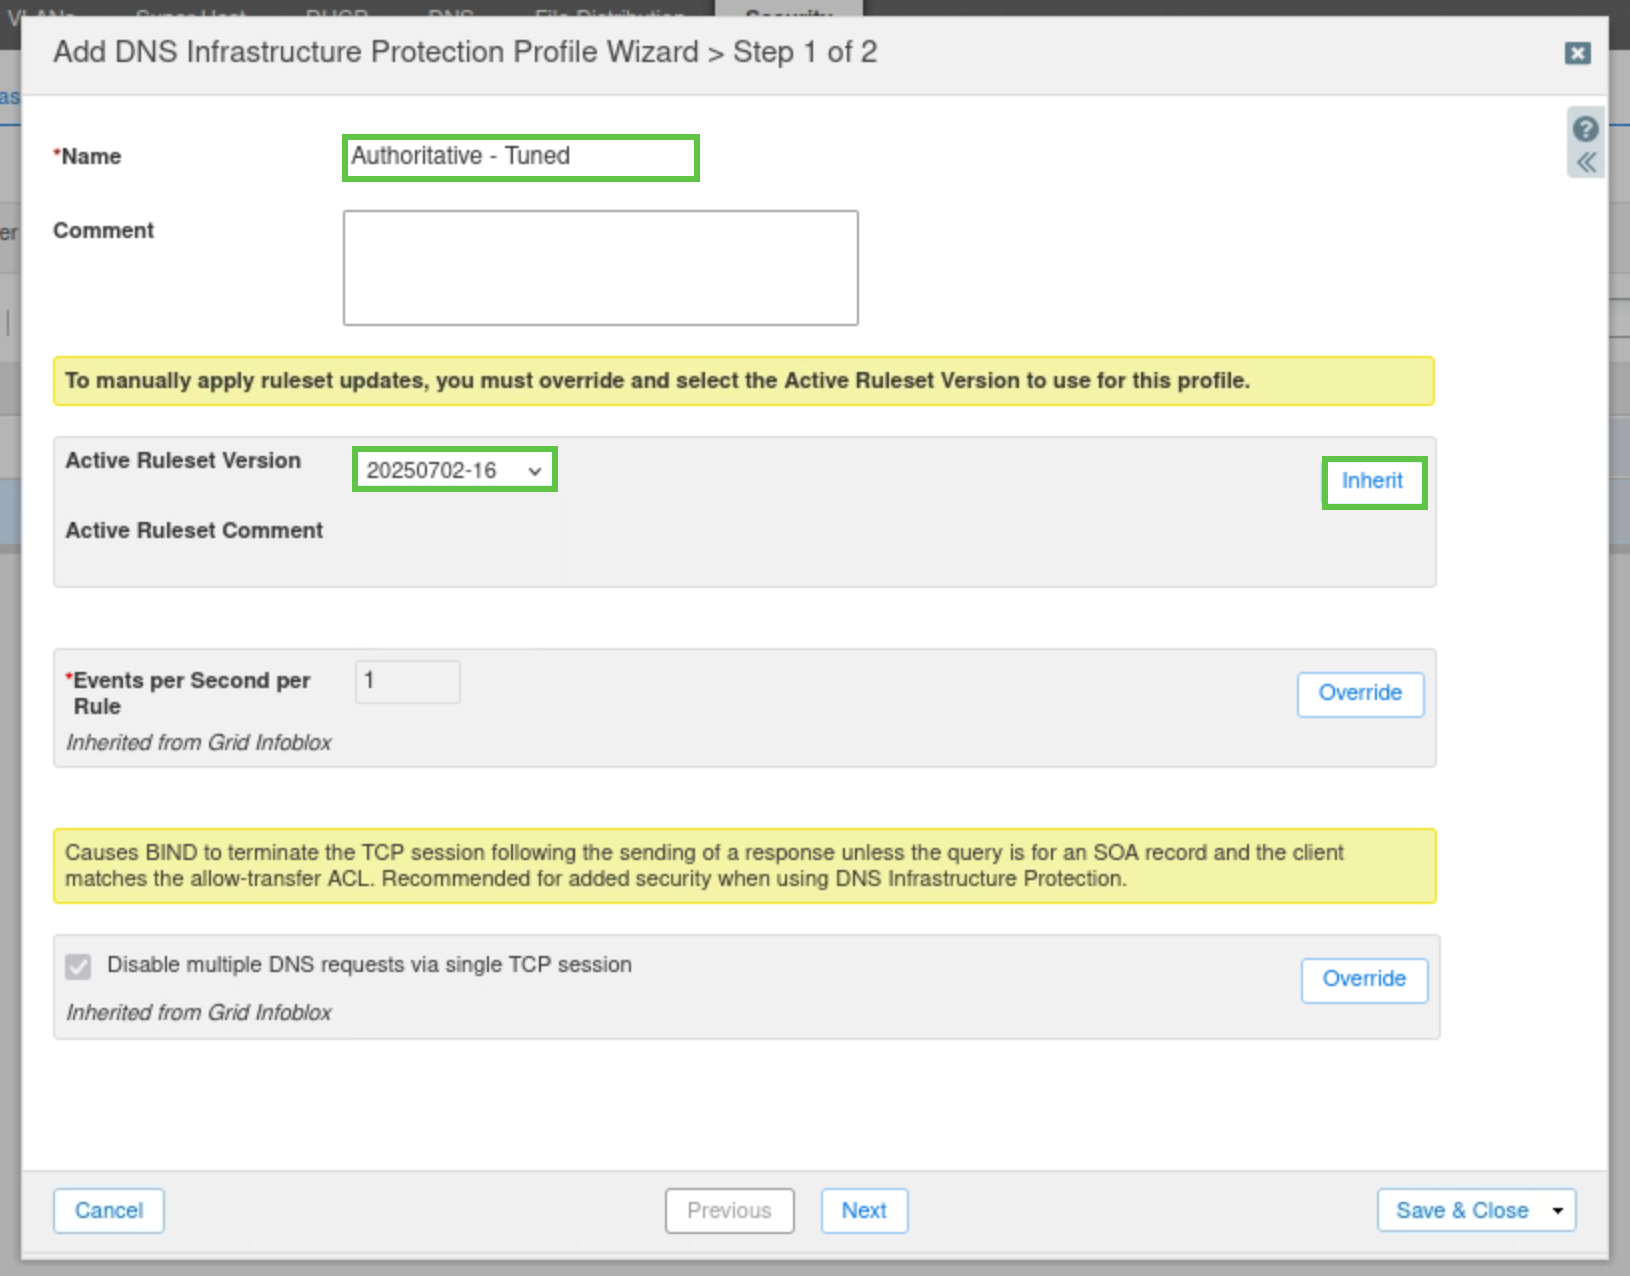
Click the Add button to create a new profile.
-
Use Authoritative - Tuned as the name.
-
Click Override for the Active Ruleset section.
-
Select the 20250702-16 ruleset.
-
Click Save & Close.
-
Select the checkbox for the new profile we created
-
Click Edit.
-
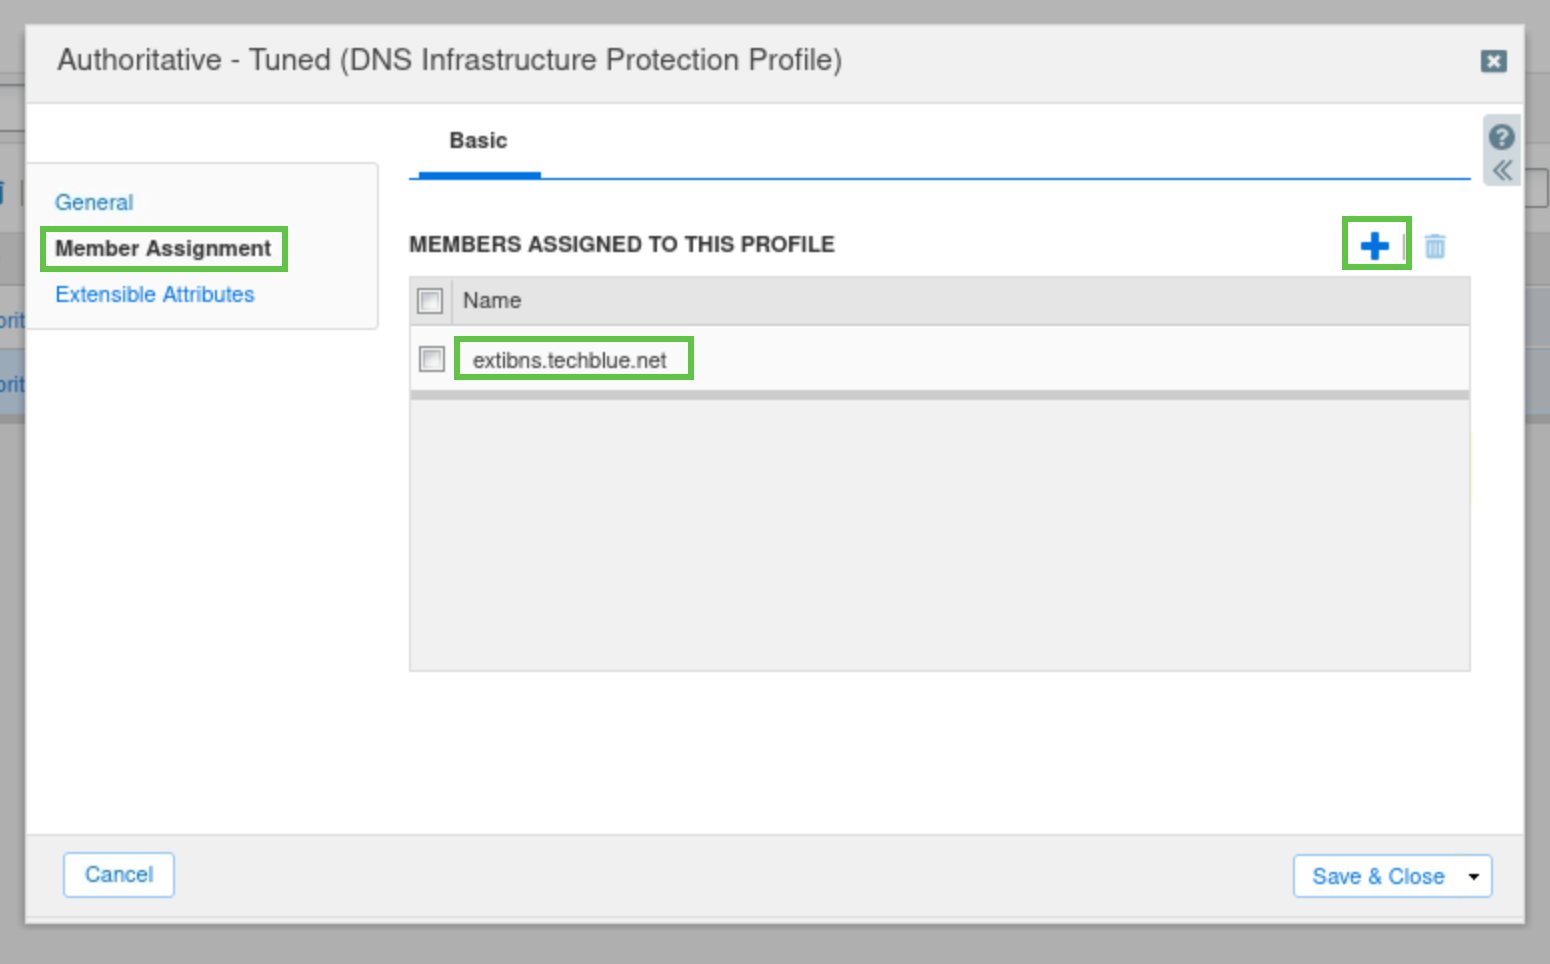
Navigate to the Member Assignment tab.
-
Click the + icon to assign the profile to extibns.techblue.net.
-
Click Save & Close.
-
DO NOT click Publish yet. We will have more changes to make before we publish this change.
Task 6 Solution: Manage Rule Categories
Since extibns.techblue.net is an authoritative-only DNS server. Certain rule categories are not required. No DNS traffic is recursed by the server. Disabling unnecessary categories and rules prevents the DNS Infrastructure Protection engine from having to interrogate against rules that aren’t applicable.
For this reason, we will be disabling the following rule categories:
-
DNS Malware
-
DNS DDoS
-
DNS Tunneling
-
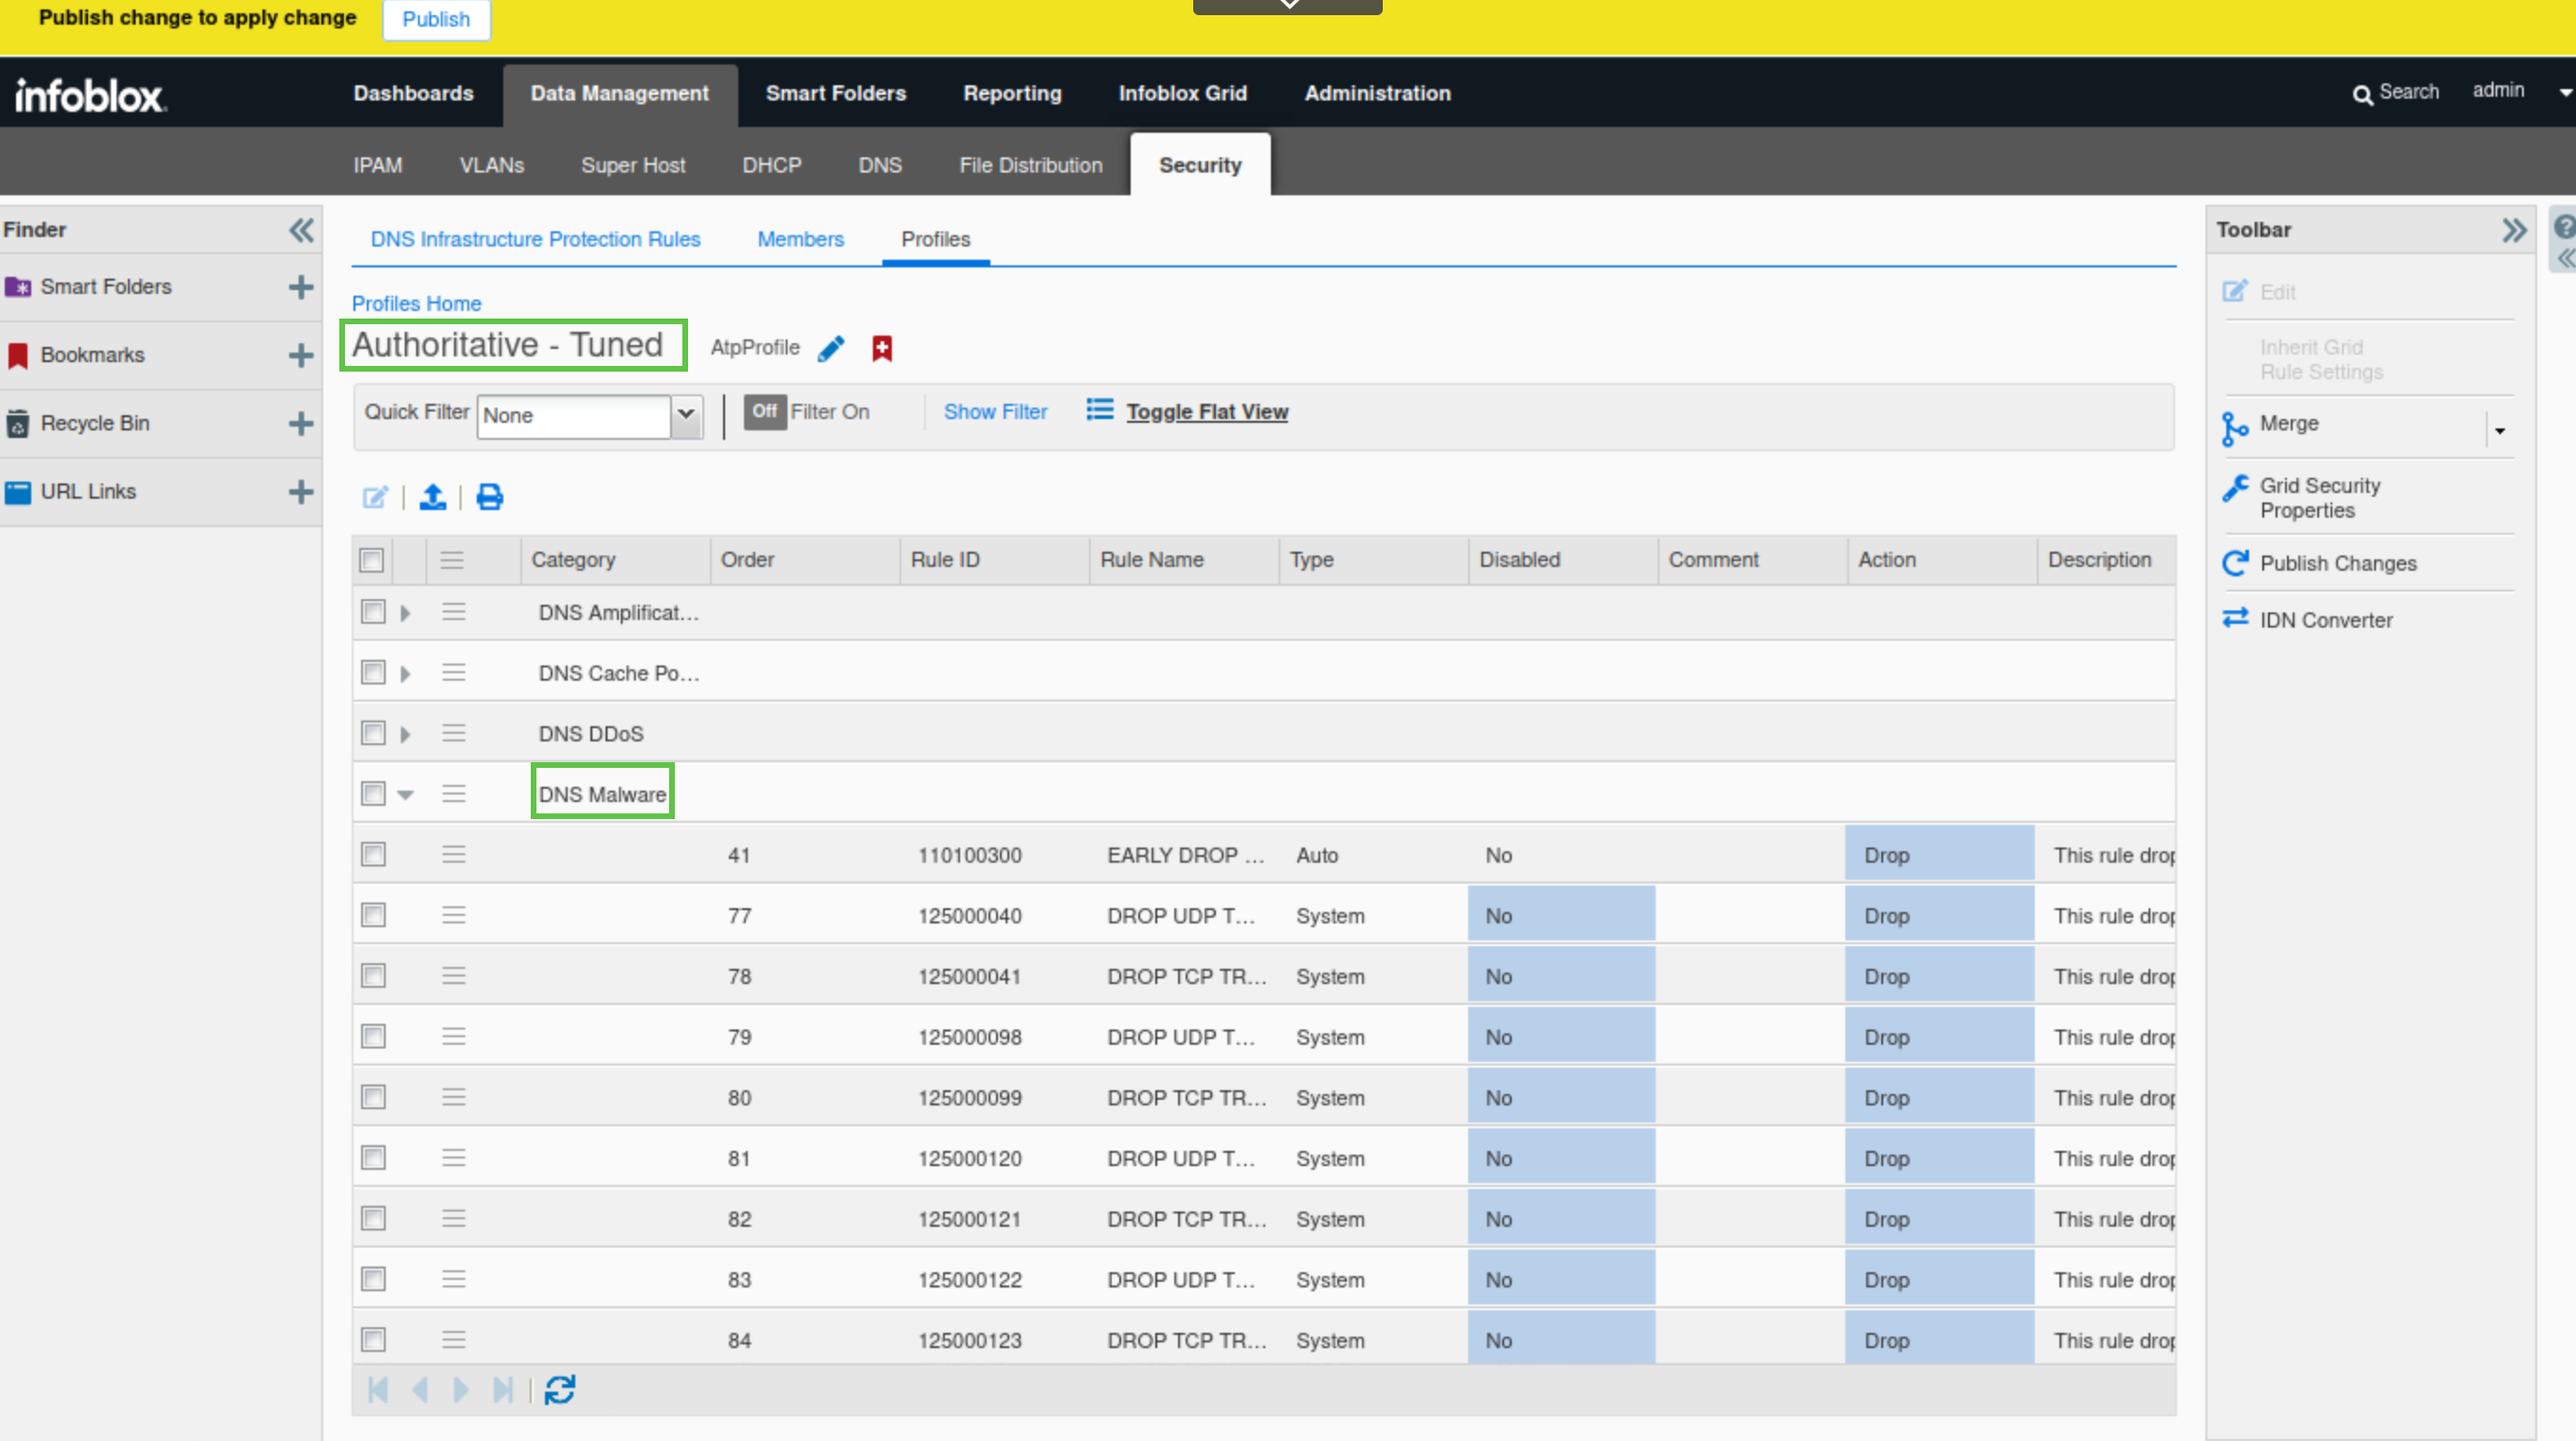
Navigate to Data Management → Security → Profiles.
-
Click on the link to the Authoritative - Tuned profile.
-
Scroll down to the DNS Malware category.
-
Click the arrow to view the rules in the category.
-
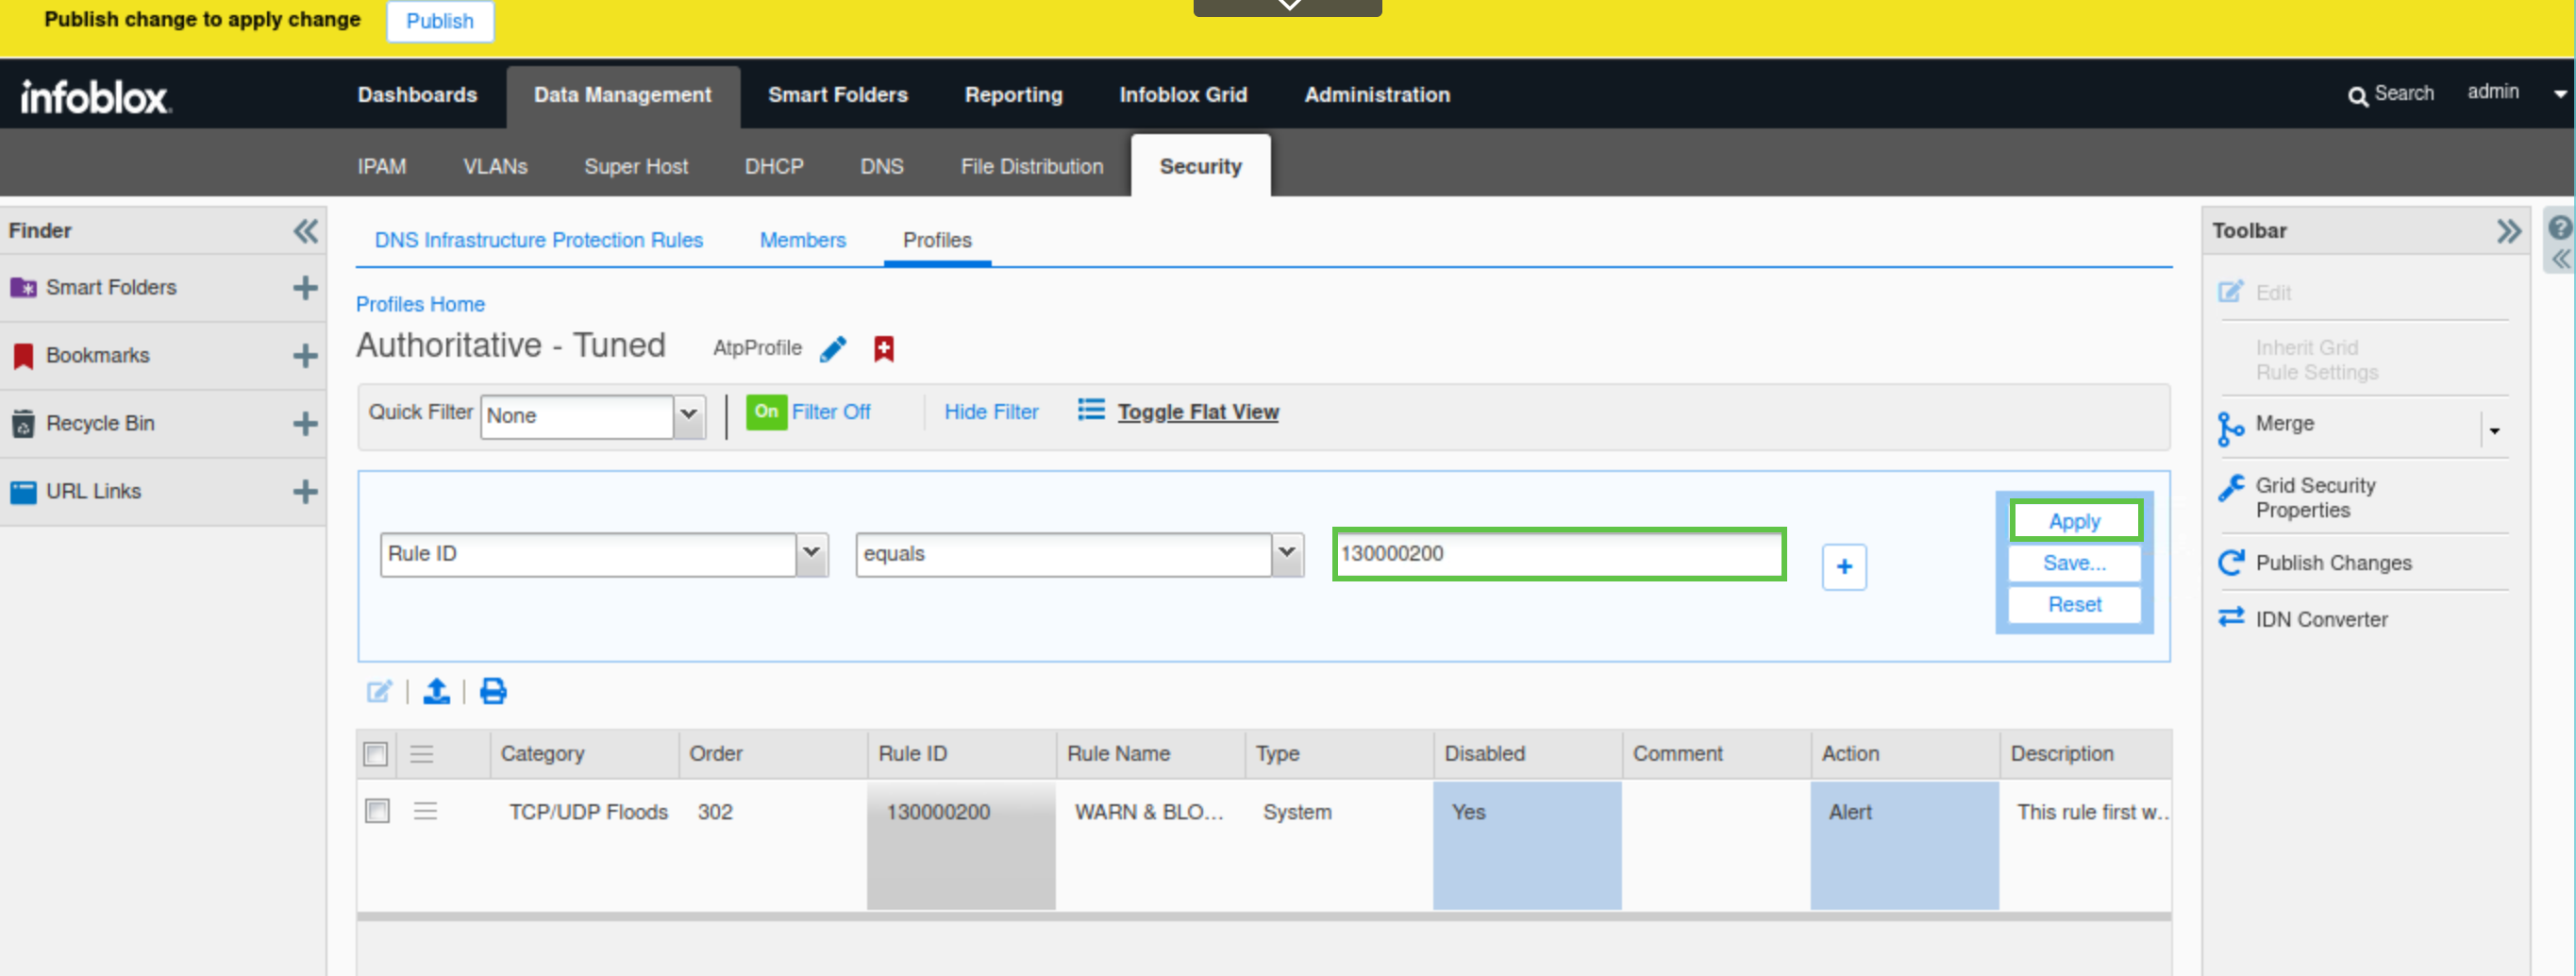
You can see that the rules are enabled; Disabled rules will have a gray highlight over the Rule ID field.
-
-
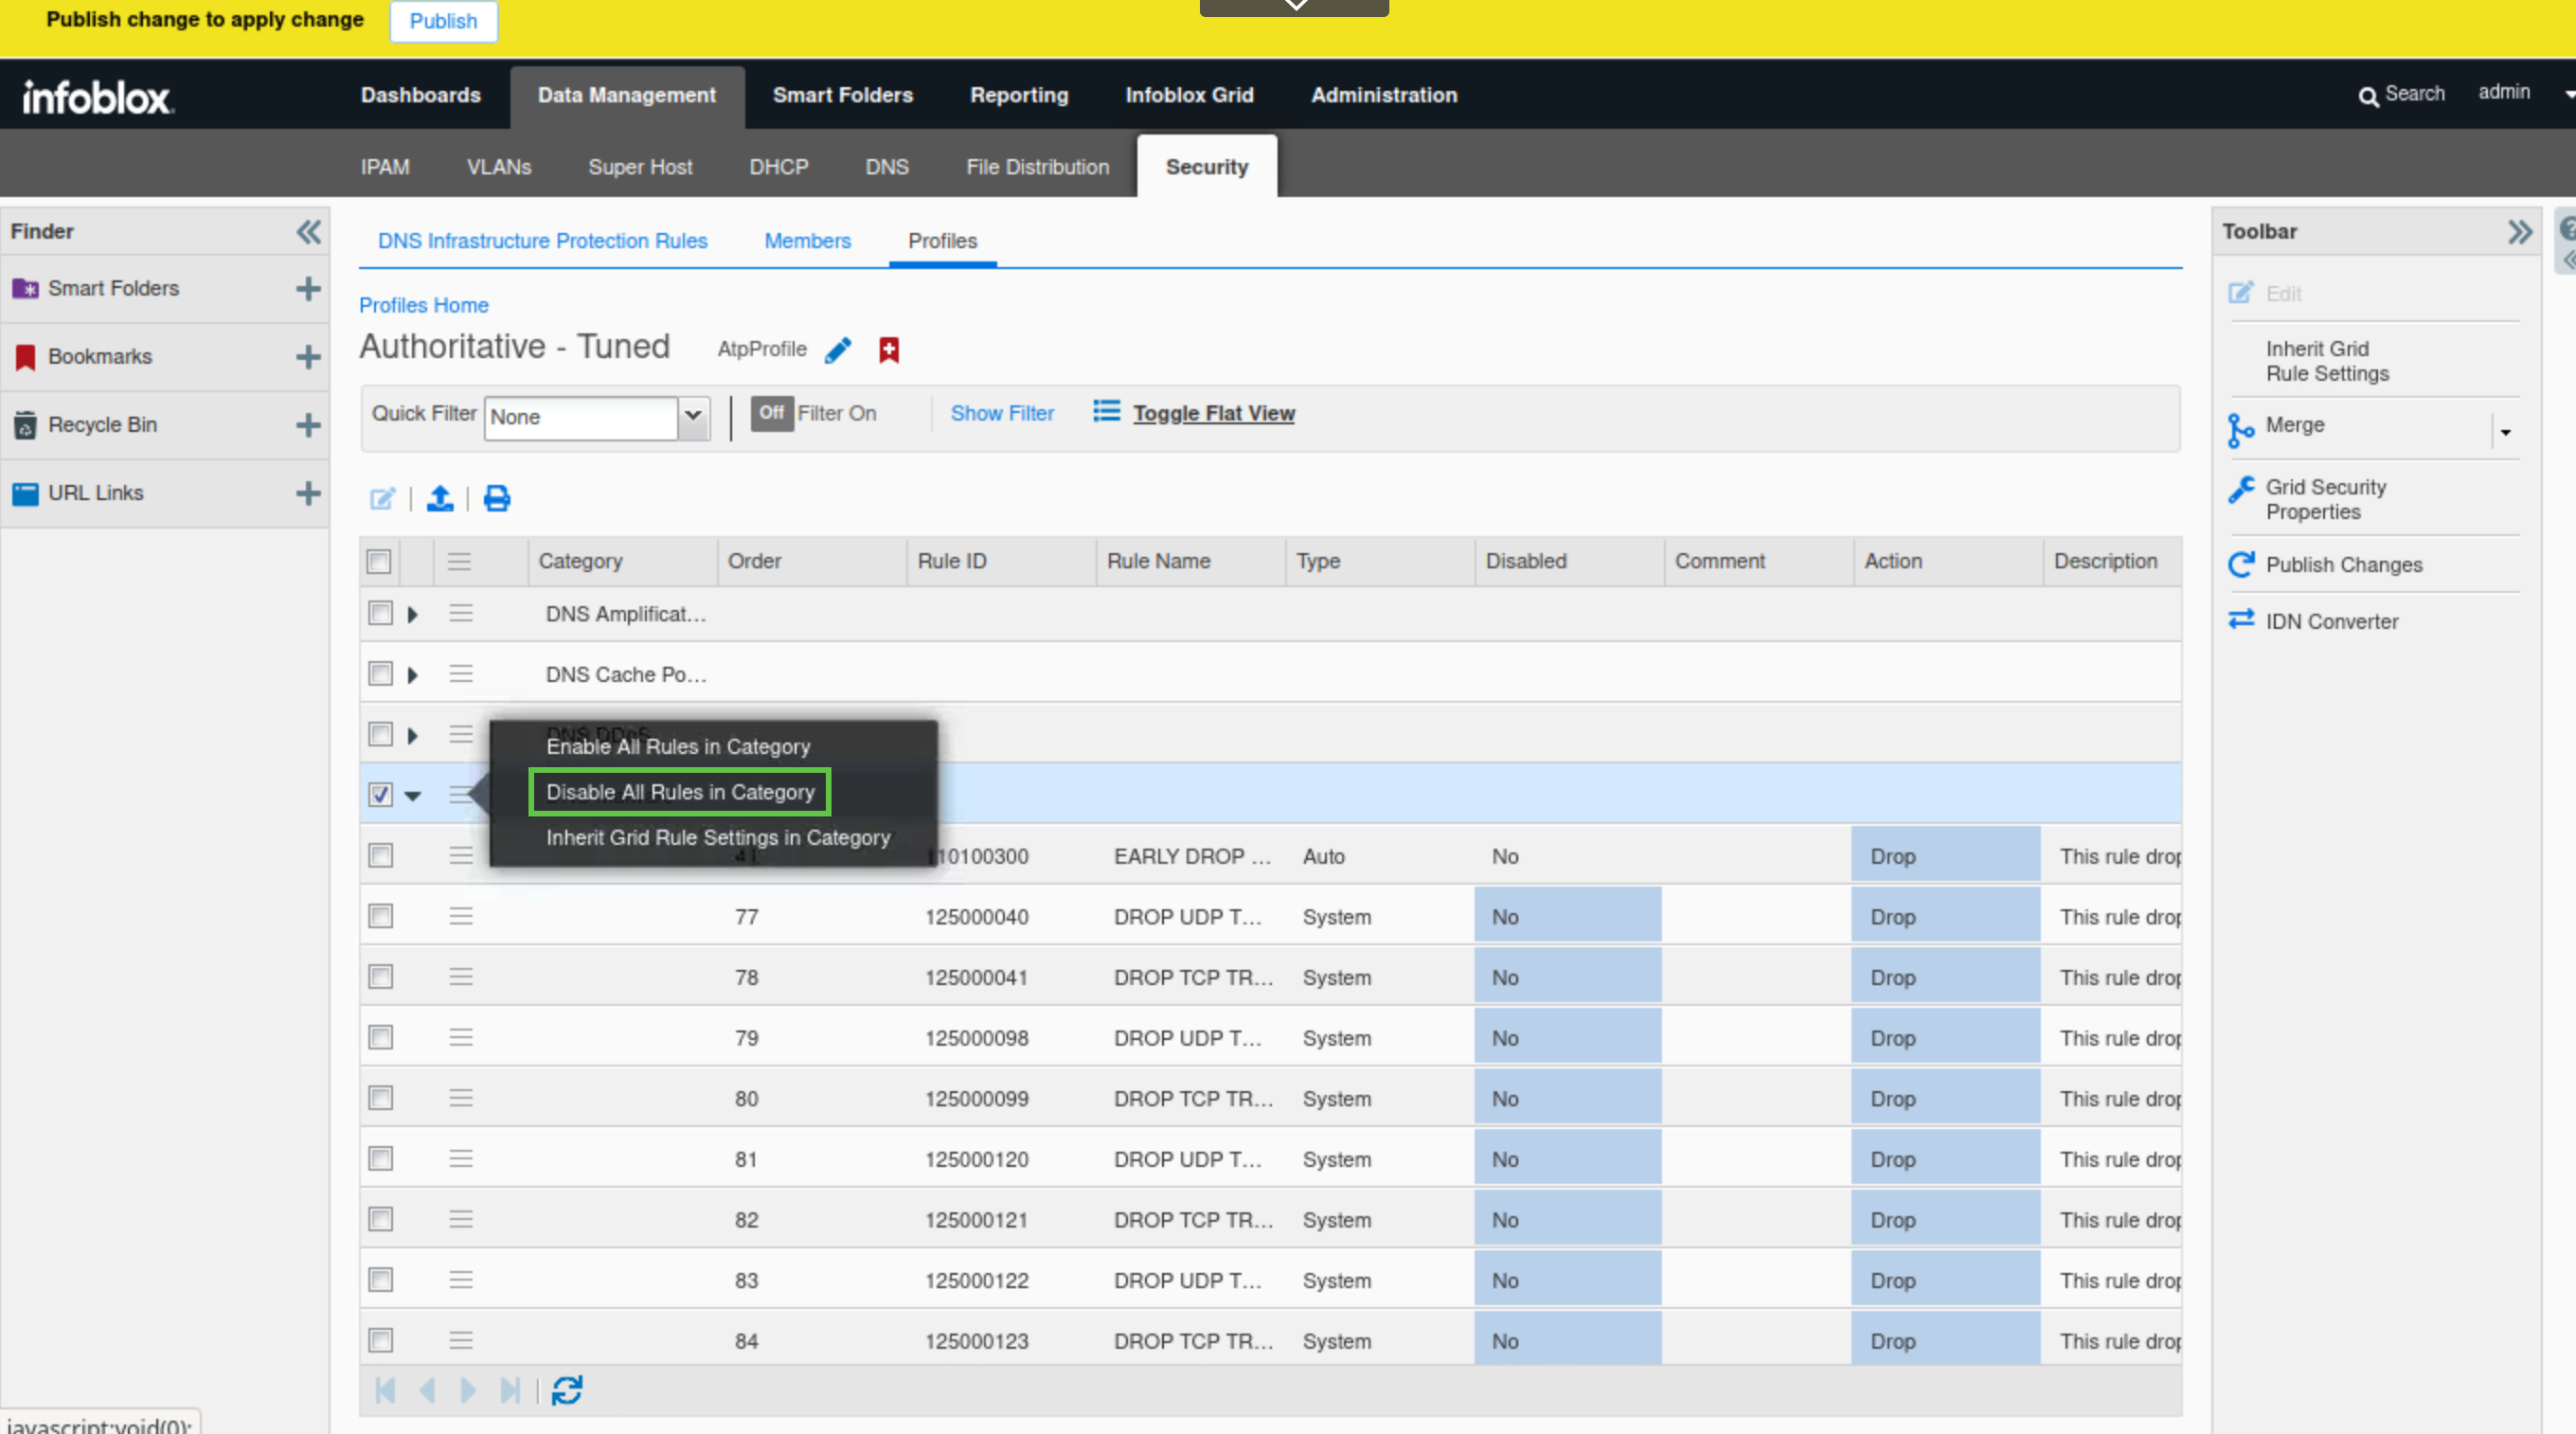
Click the hamburger icon for the DNS Malware category.
-
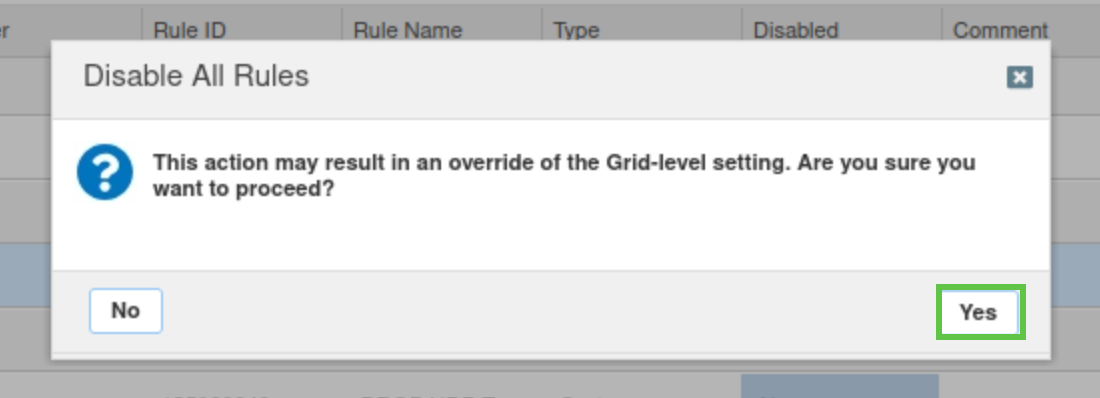
Select the Disable all Rules in Category option.
-
Click Yes to proceed.
-
Disable the DNS DDoS and DNS Tunneling categories in the profile by repeating the same steps (steps 3 through 7) for each category.
-
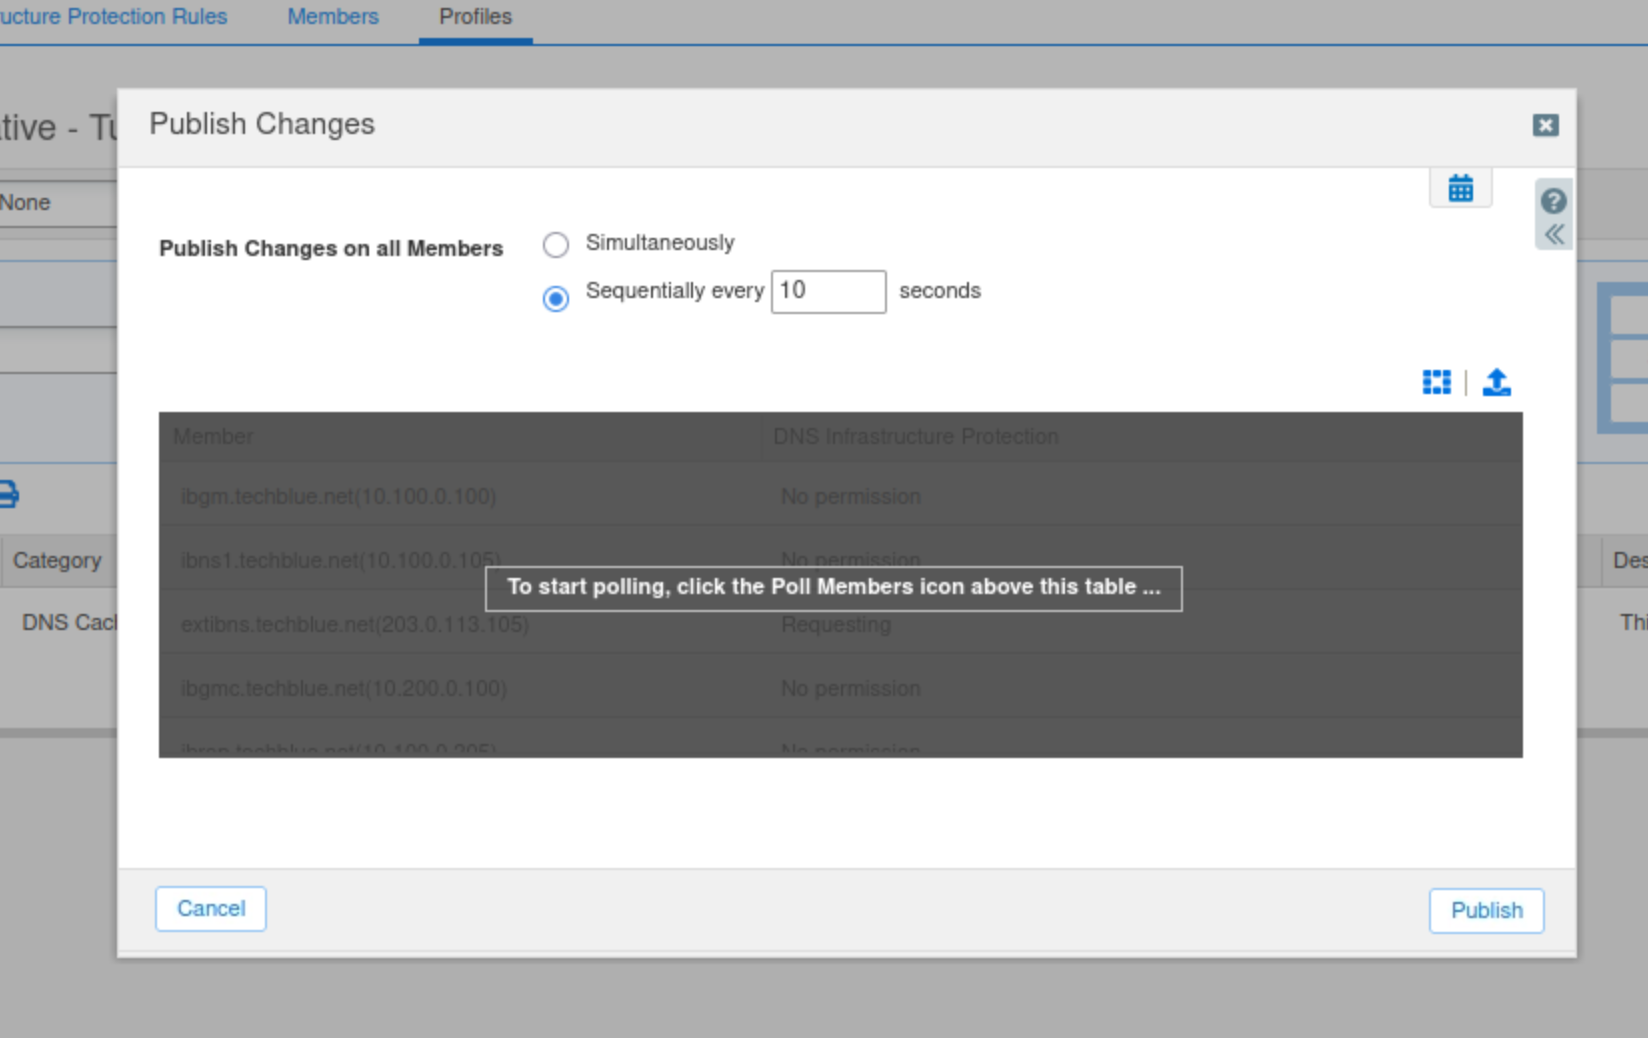
Publish the changes when finished.
Task 7 Solution: Tune Default Rules in the Authoritative - Tuned Profile
The values used in this task are specific to the lab and do not reflect the values you should use in a production environment
In this task, you will tune three rules: rule ID 130000100 (WARN about high rate inbound UDP DNS queries), rule ID 130000200 (WARN & BLOCK about high rate inbound UDP DNS queries), and rule ID 100000100 (EARLY PASS UDP response traffic) to suit your current lab environment. These rules are intended to protect against TCP and UDP flood attacks.
TCP and UDP flood attacks are volumetric attacks that send massive numbers of packets, consuming network bandwidth and resources. They exploit TCP and UDP.
As you remember from an earlier task, our lab system’s DNS Query Rate Per Second for extibns.techblue.net was approximately 4.7 QPS, which is very low. For testing purposes, we will use higher values so you can see what happens when rules are triggered.
-
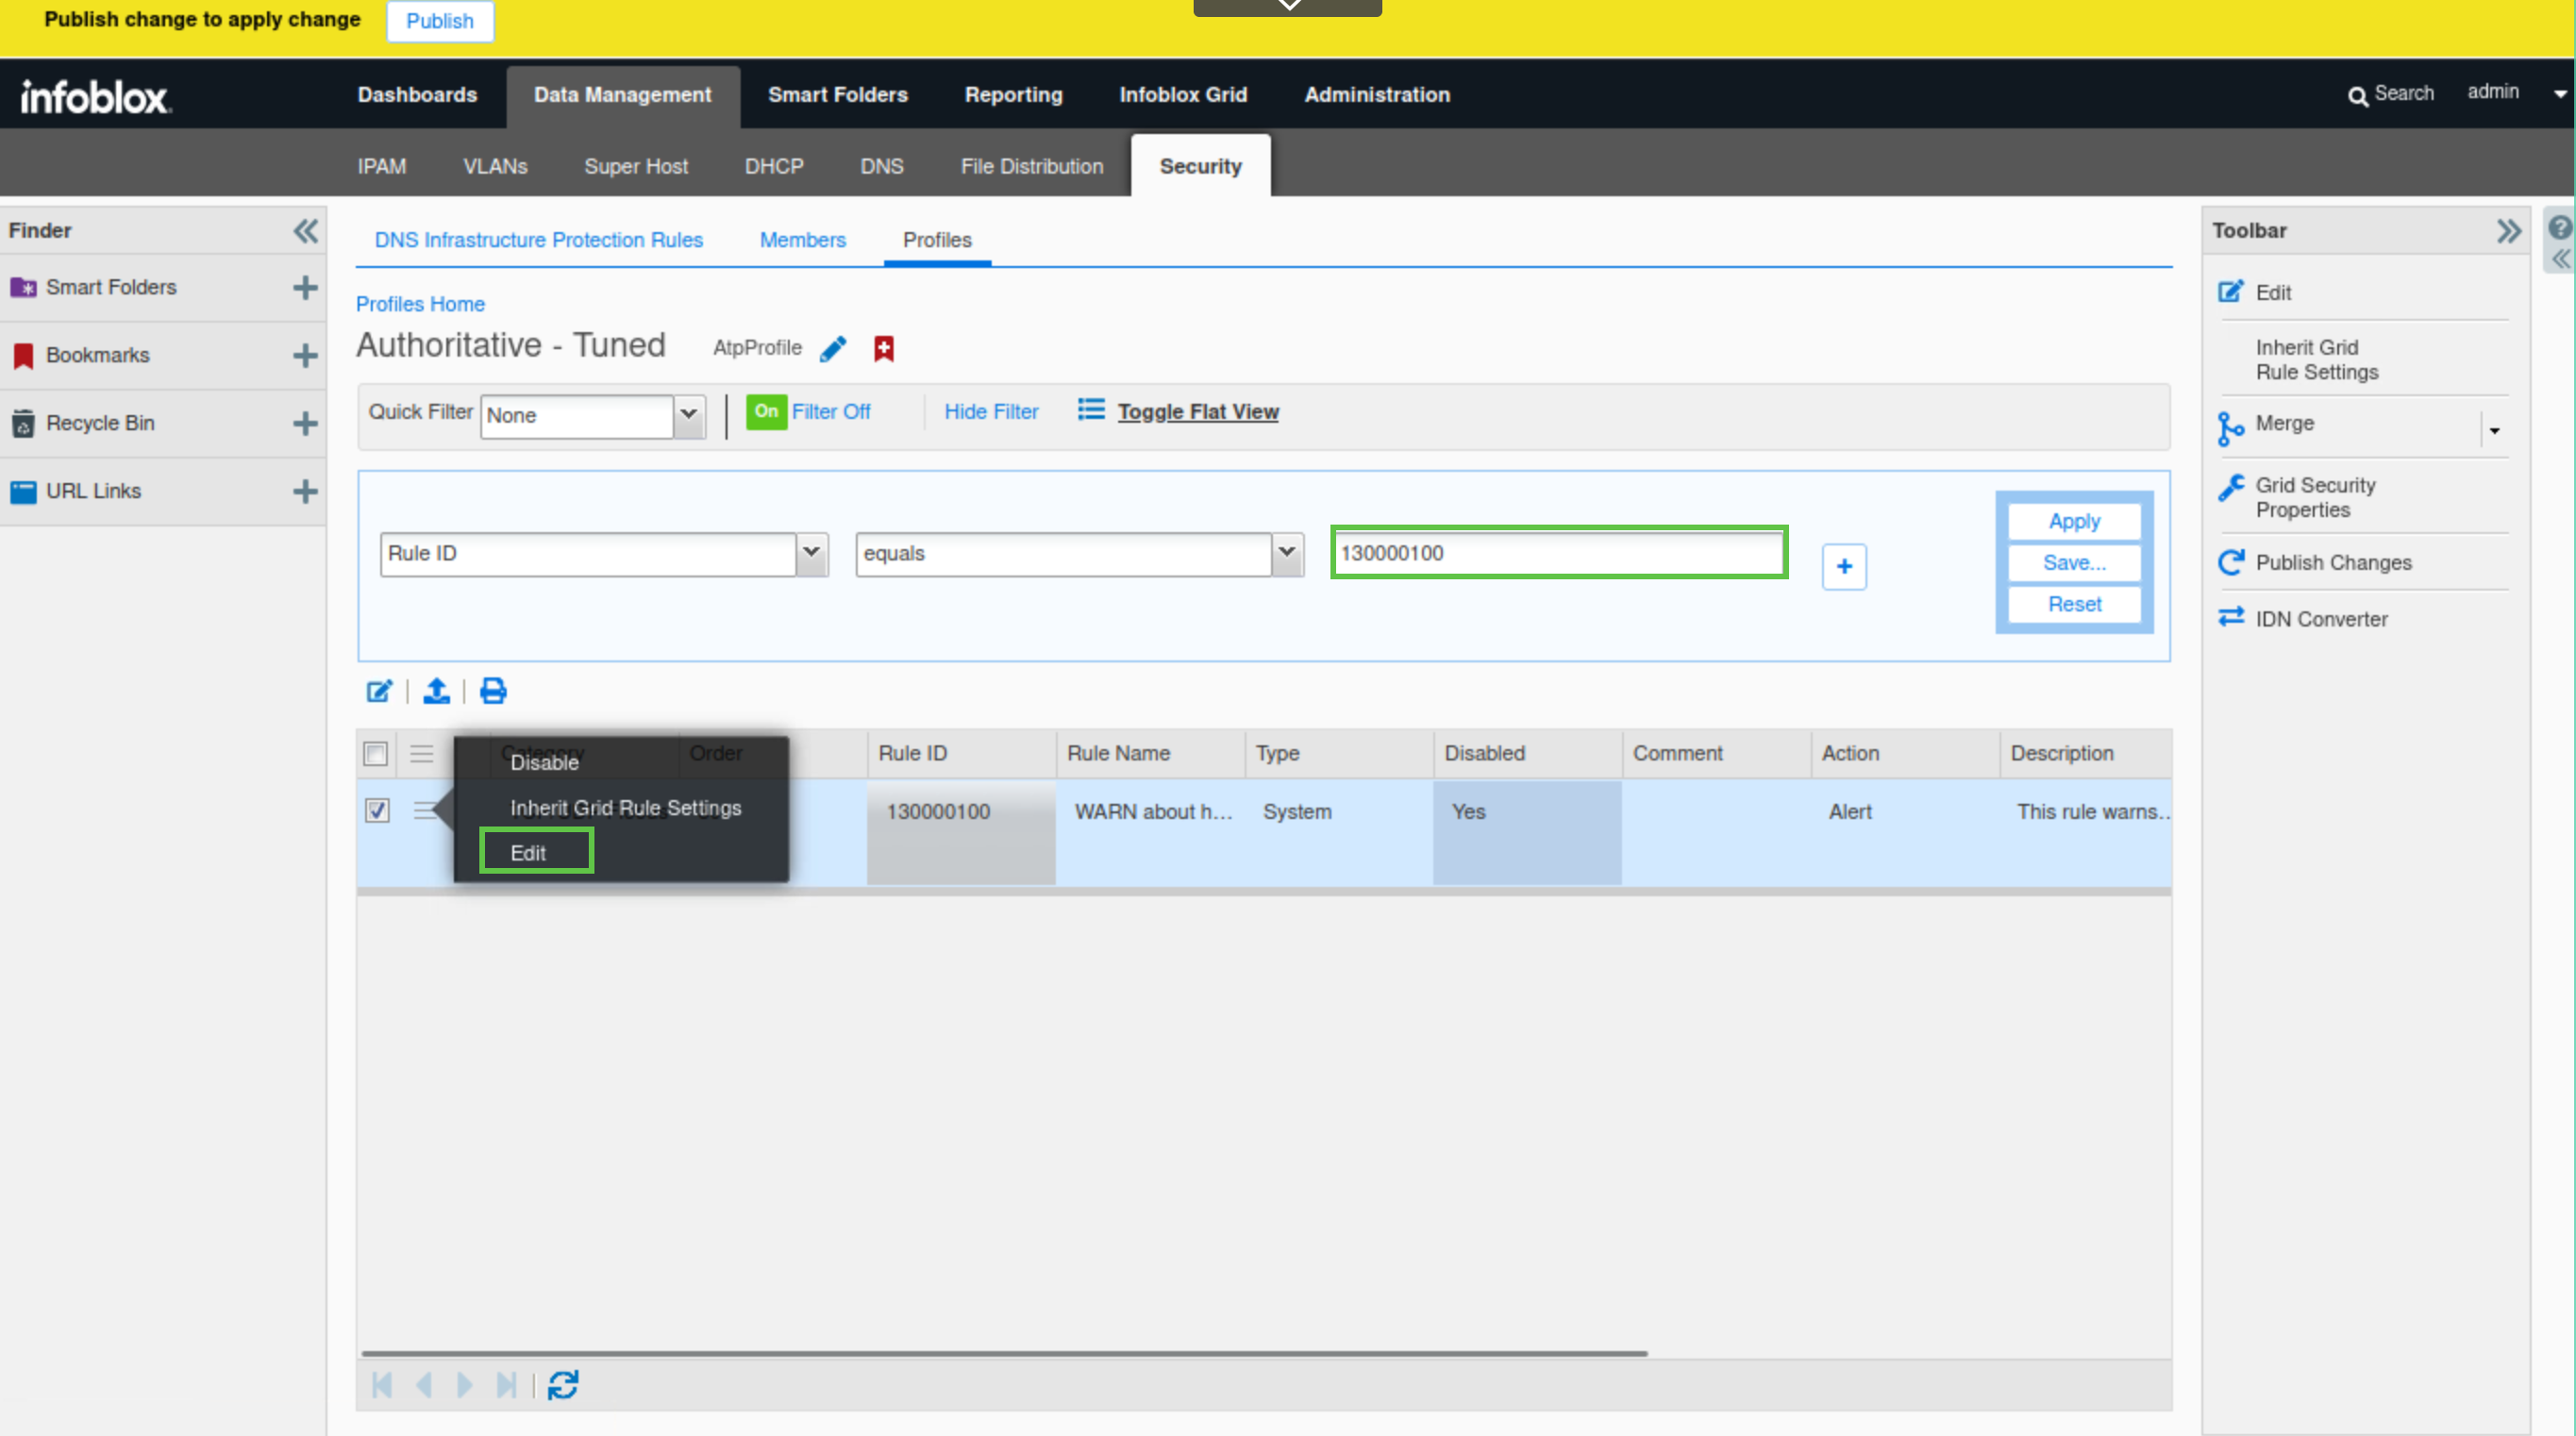
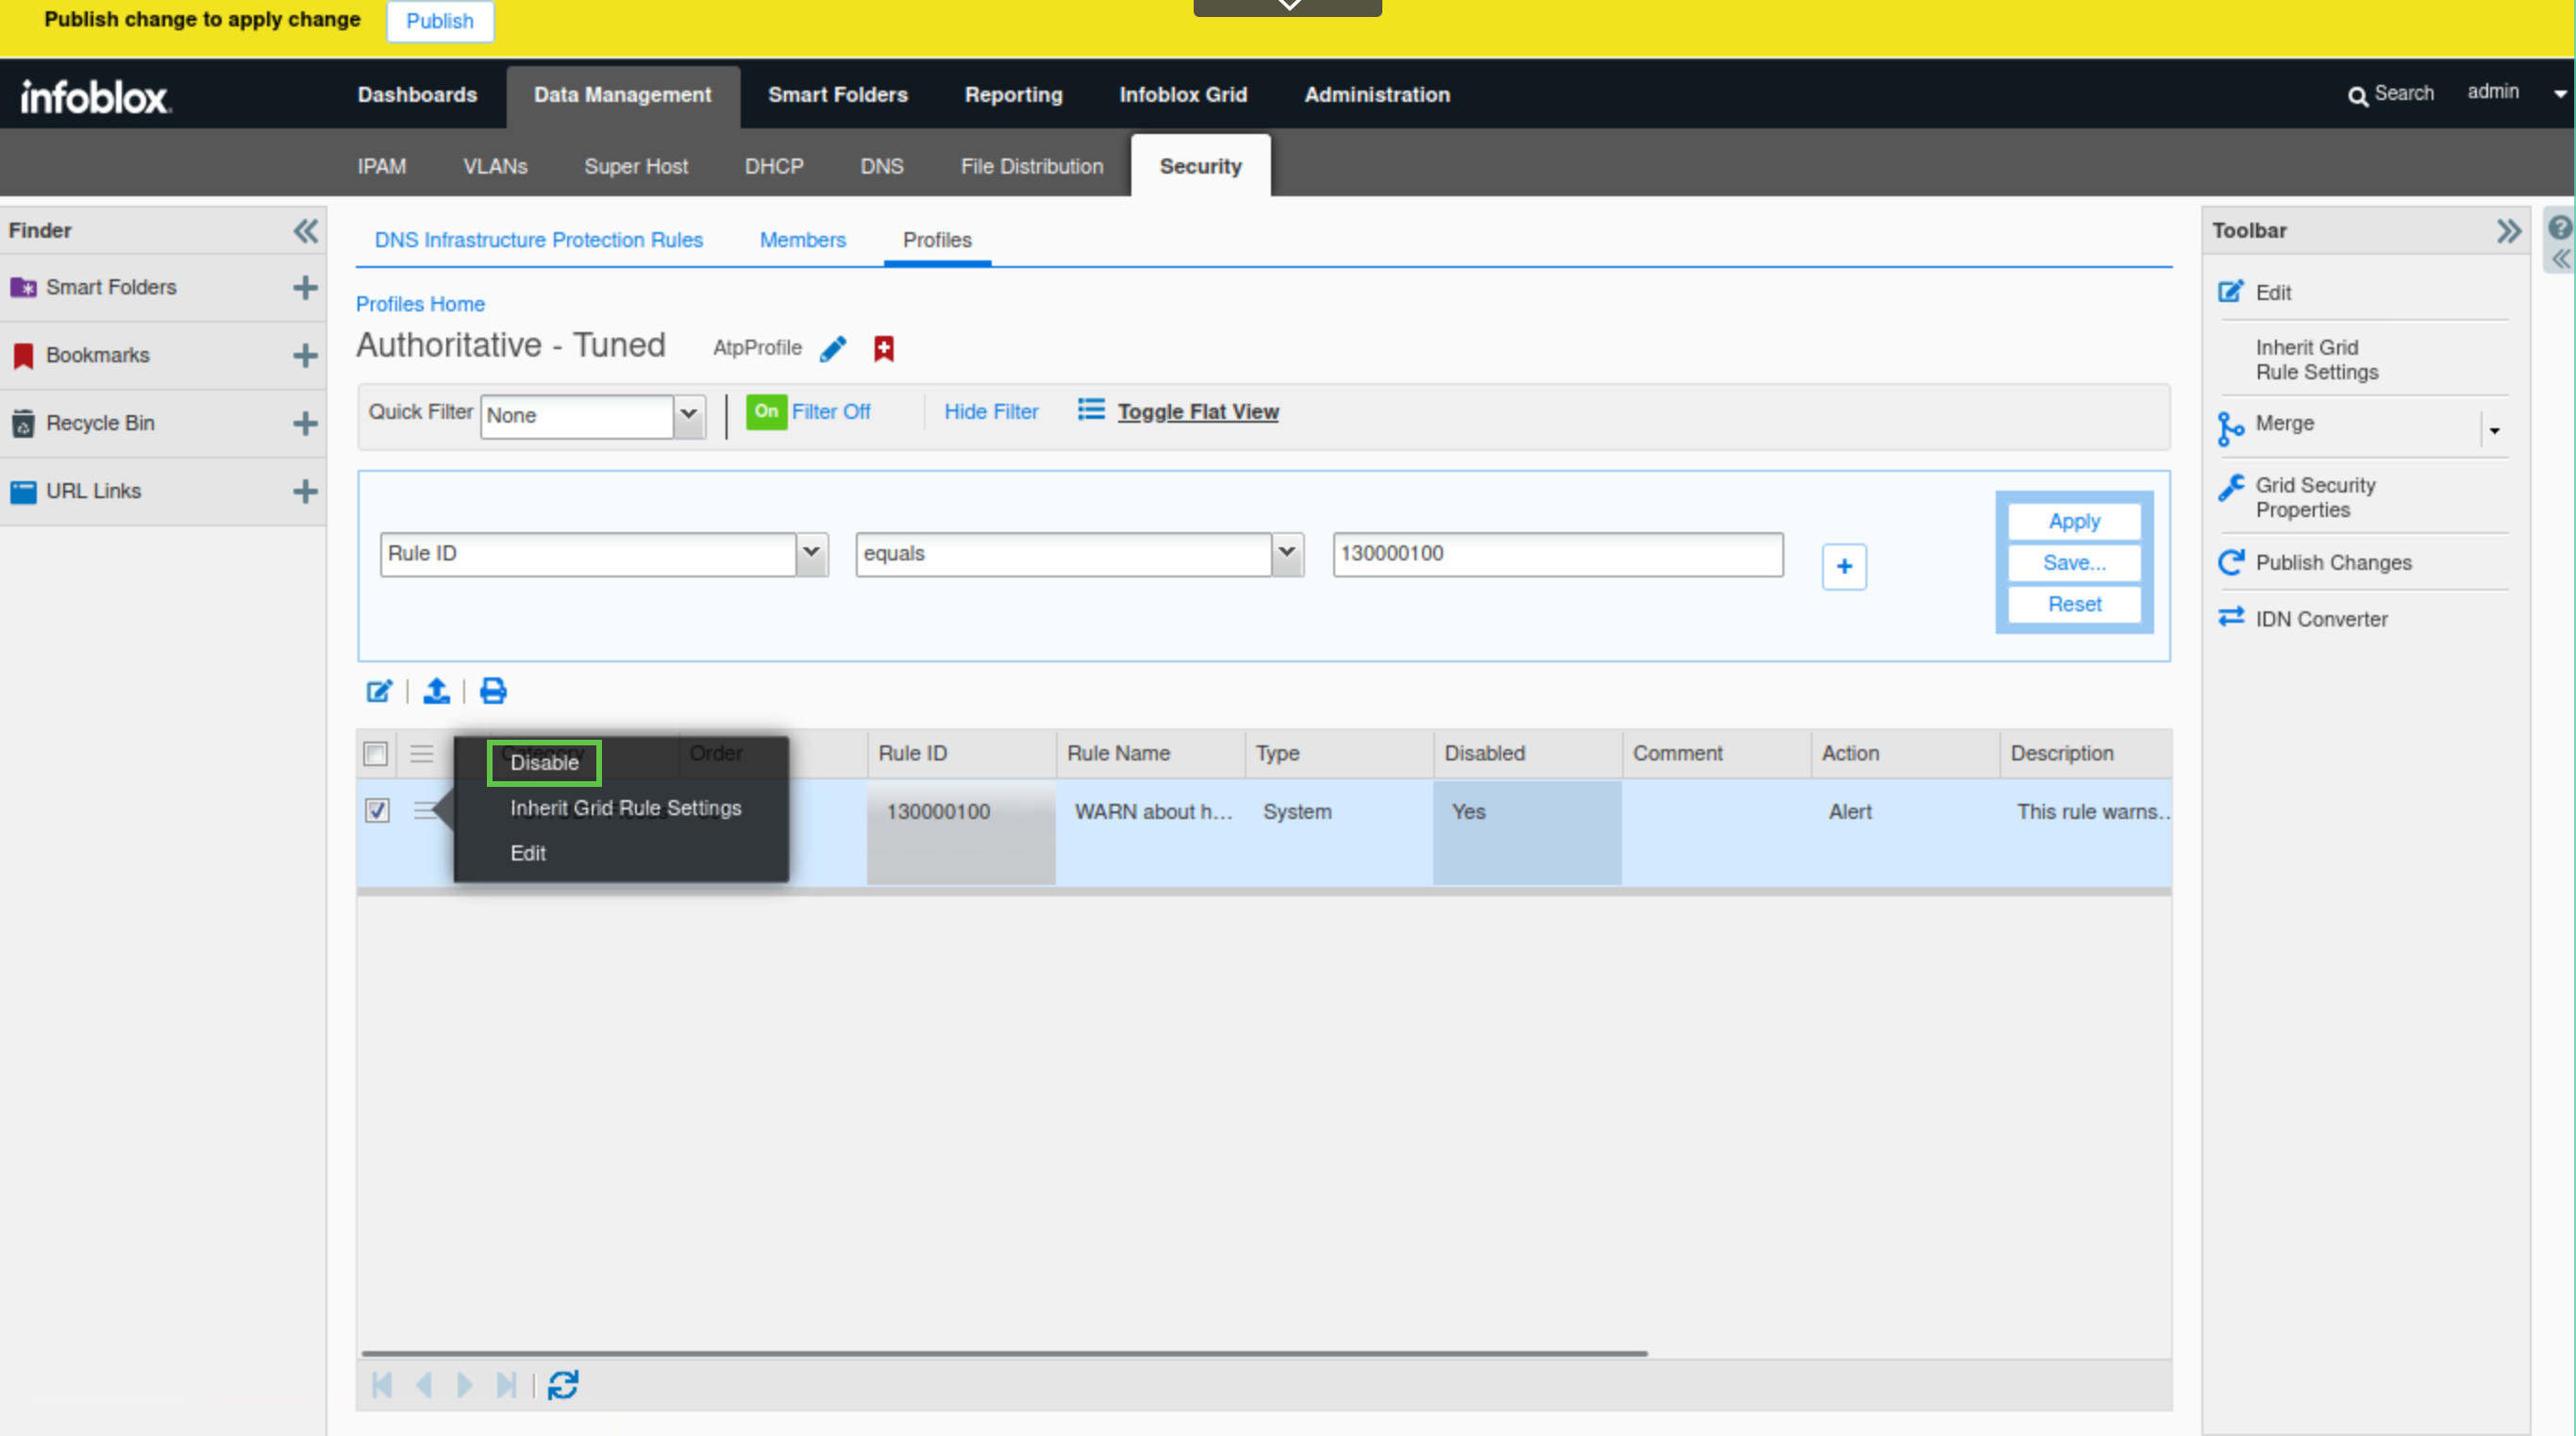
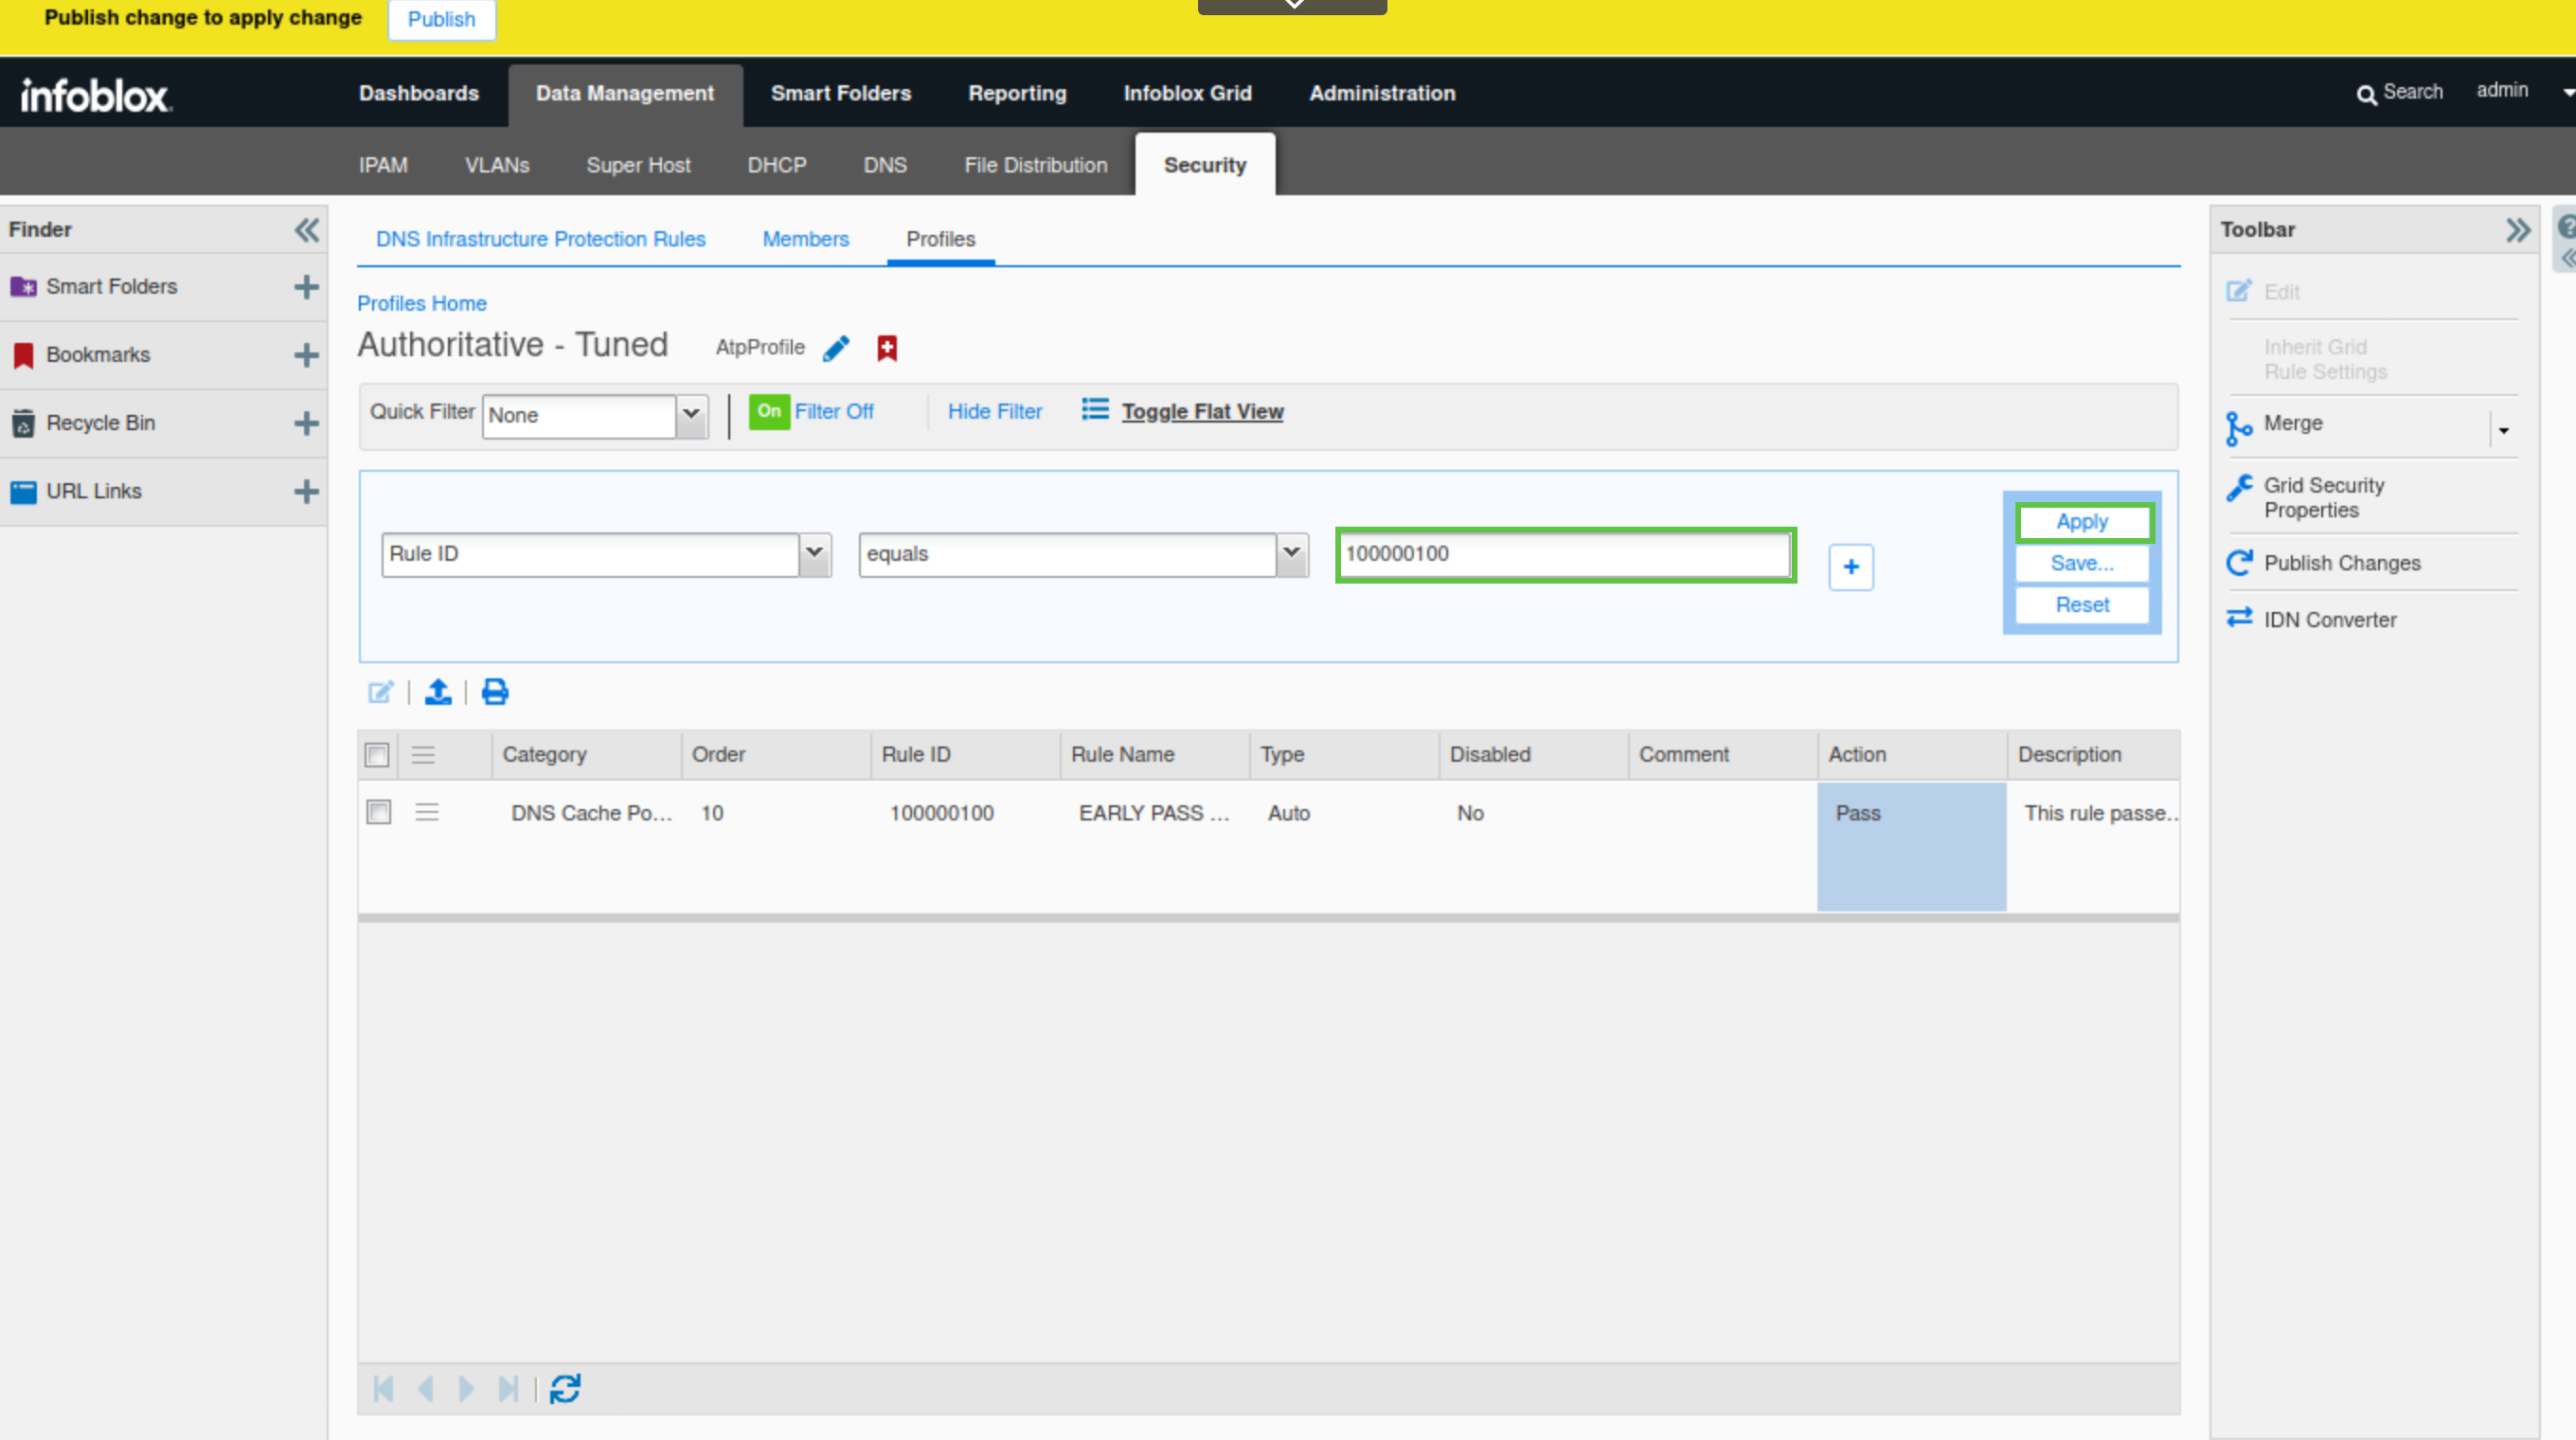
Click Show filter.
-
Choose Rule ID as the filter.
-
Set the operator to equals.
-
Enter the rule ID 130000100 in the last field
-
Click Apply.
-
Check the Rule and click Edit.
-
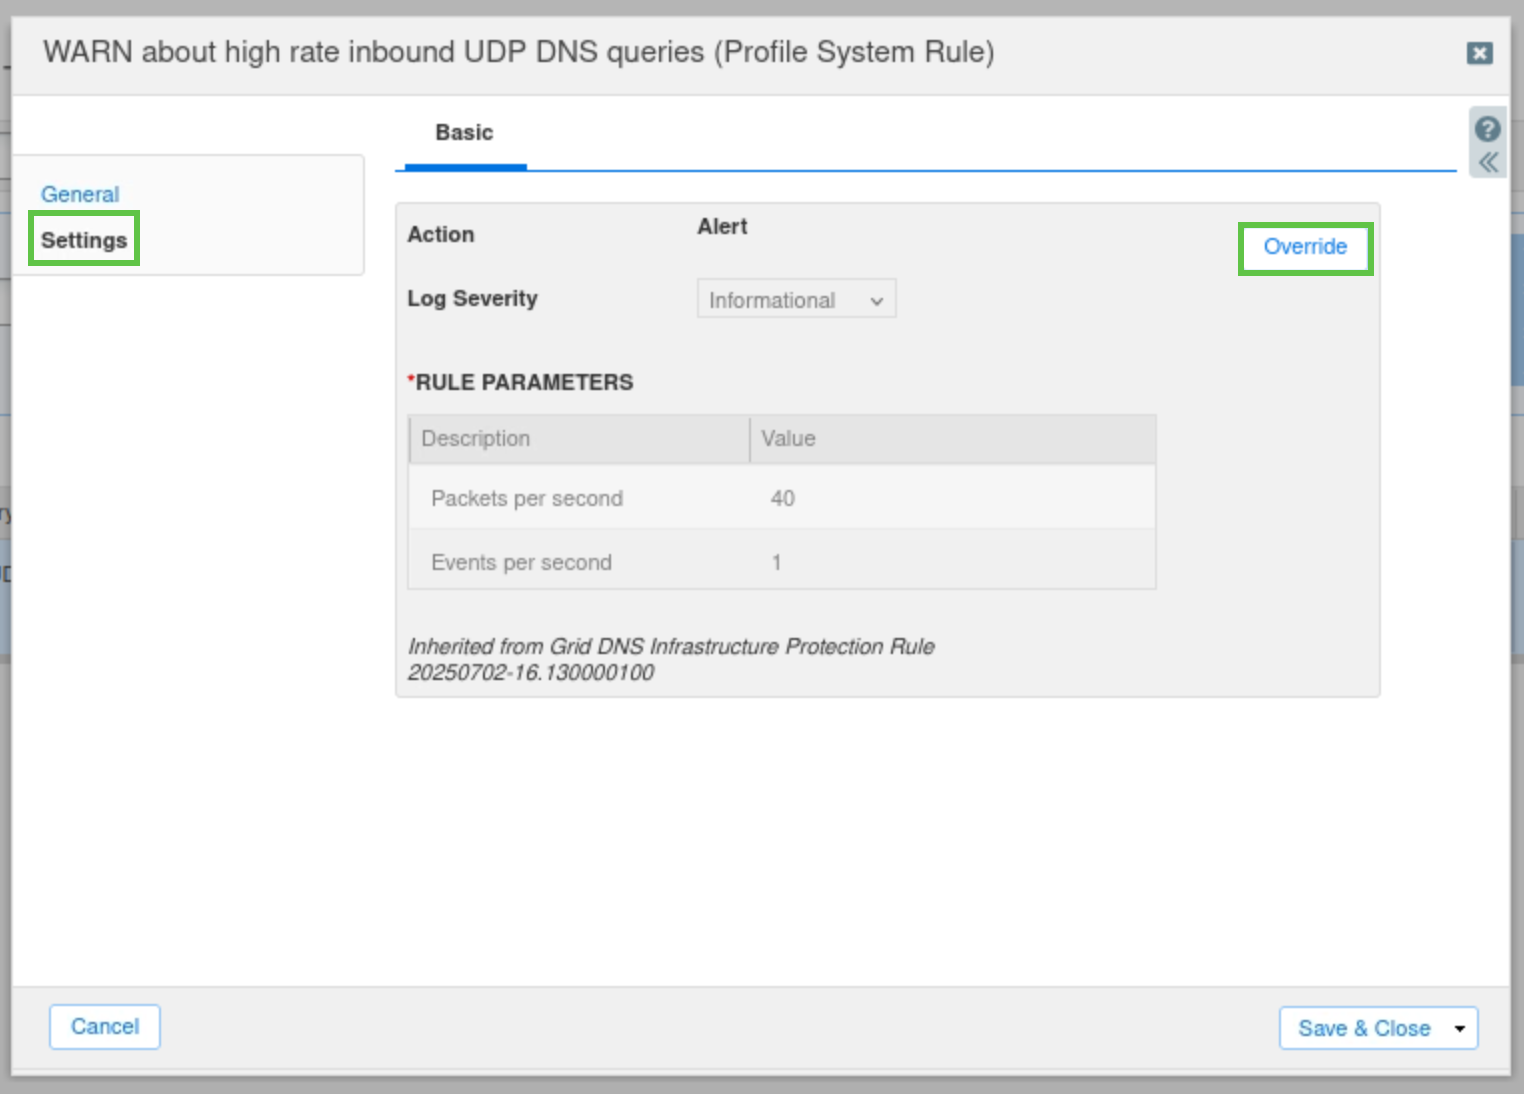
Select the Settings tab and click Override.
-
Change the Log Severity level to Warning.
-
Change the Packets per Second value to 250.
-
Click Save & Close.
-
Click the hamburger icon next to the rule and select Disable.
-
This will toggle the disable option on.
-
Don't publish yet.
-
-
In the filter value field, enter the rule ID 130000200.
-
Click Apply.
-
Check the Rule and click Edit.
-
Select the Settings tab and click Override.
-
Change the Log Severity to Critical.
-
Change the Packets per second value to 500.
-
Click the hamburger icon next to the rule and select Disable.
-
This will toggle the disable option on.
-
Don't publish yet.

-
-
In the filter value field, enter the rule ID 100000100.
-
Click Apply.
-
Check the Rule and click Edit.
-
Select the Settings tab and click Override.
-
Change the Log Severity to Critical.
-
Change the Packets per second value to 15000.
-
This rule should already be enabled.
-
-
Publish the changes when you’re done.

Task 8 Solution: Test the new Configuration with monitor-mode Enabled
In this task, we test our tuned rules under the Authoritative - Tuned Profile. We tuned three rules: rule ID 130000100 (WARN about high rate inbound UDP DNS queries), rule ID 130000200 (WARN & BLOCK about high rate inbound UDP DNS queries), and rule ID 100000100 (EARLY PASS UDP response traffic) to protect against TCP and UDP flood attacks.
We have not yet disabled monitor-mode, so none of our tests should result in packet drops. We will start our tests in monitor-mode as an extra precaution, and to visualize the difference between having monitor-mode enabled and disabled.
A monitoring tool called bmon is installed on the support-server. The tool is used to monitor traffic on the 203.0.113.0 network, which simulates an interface connected to the outside world.
Another tool, queryperf, installed on the support server, sends DNS queries to the extibns.techblue.net DNS server at the rate we specify, simulating the behavior of bad actors.
-
Switch to the support-server virtual machine and log in using the credentials: training/infoblox.
-
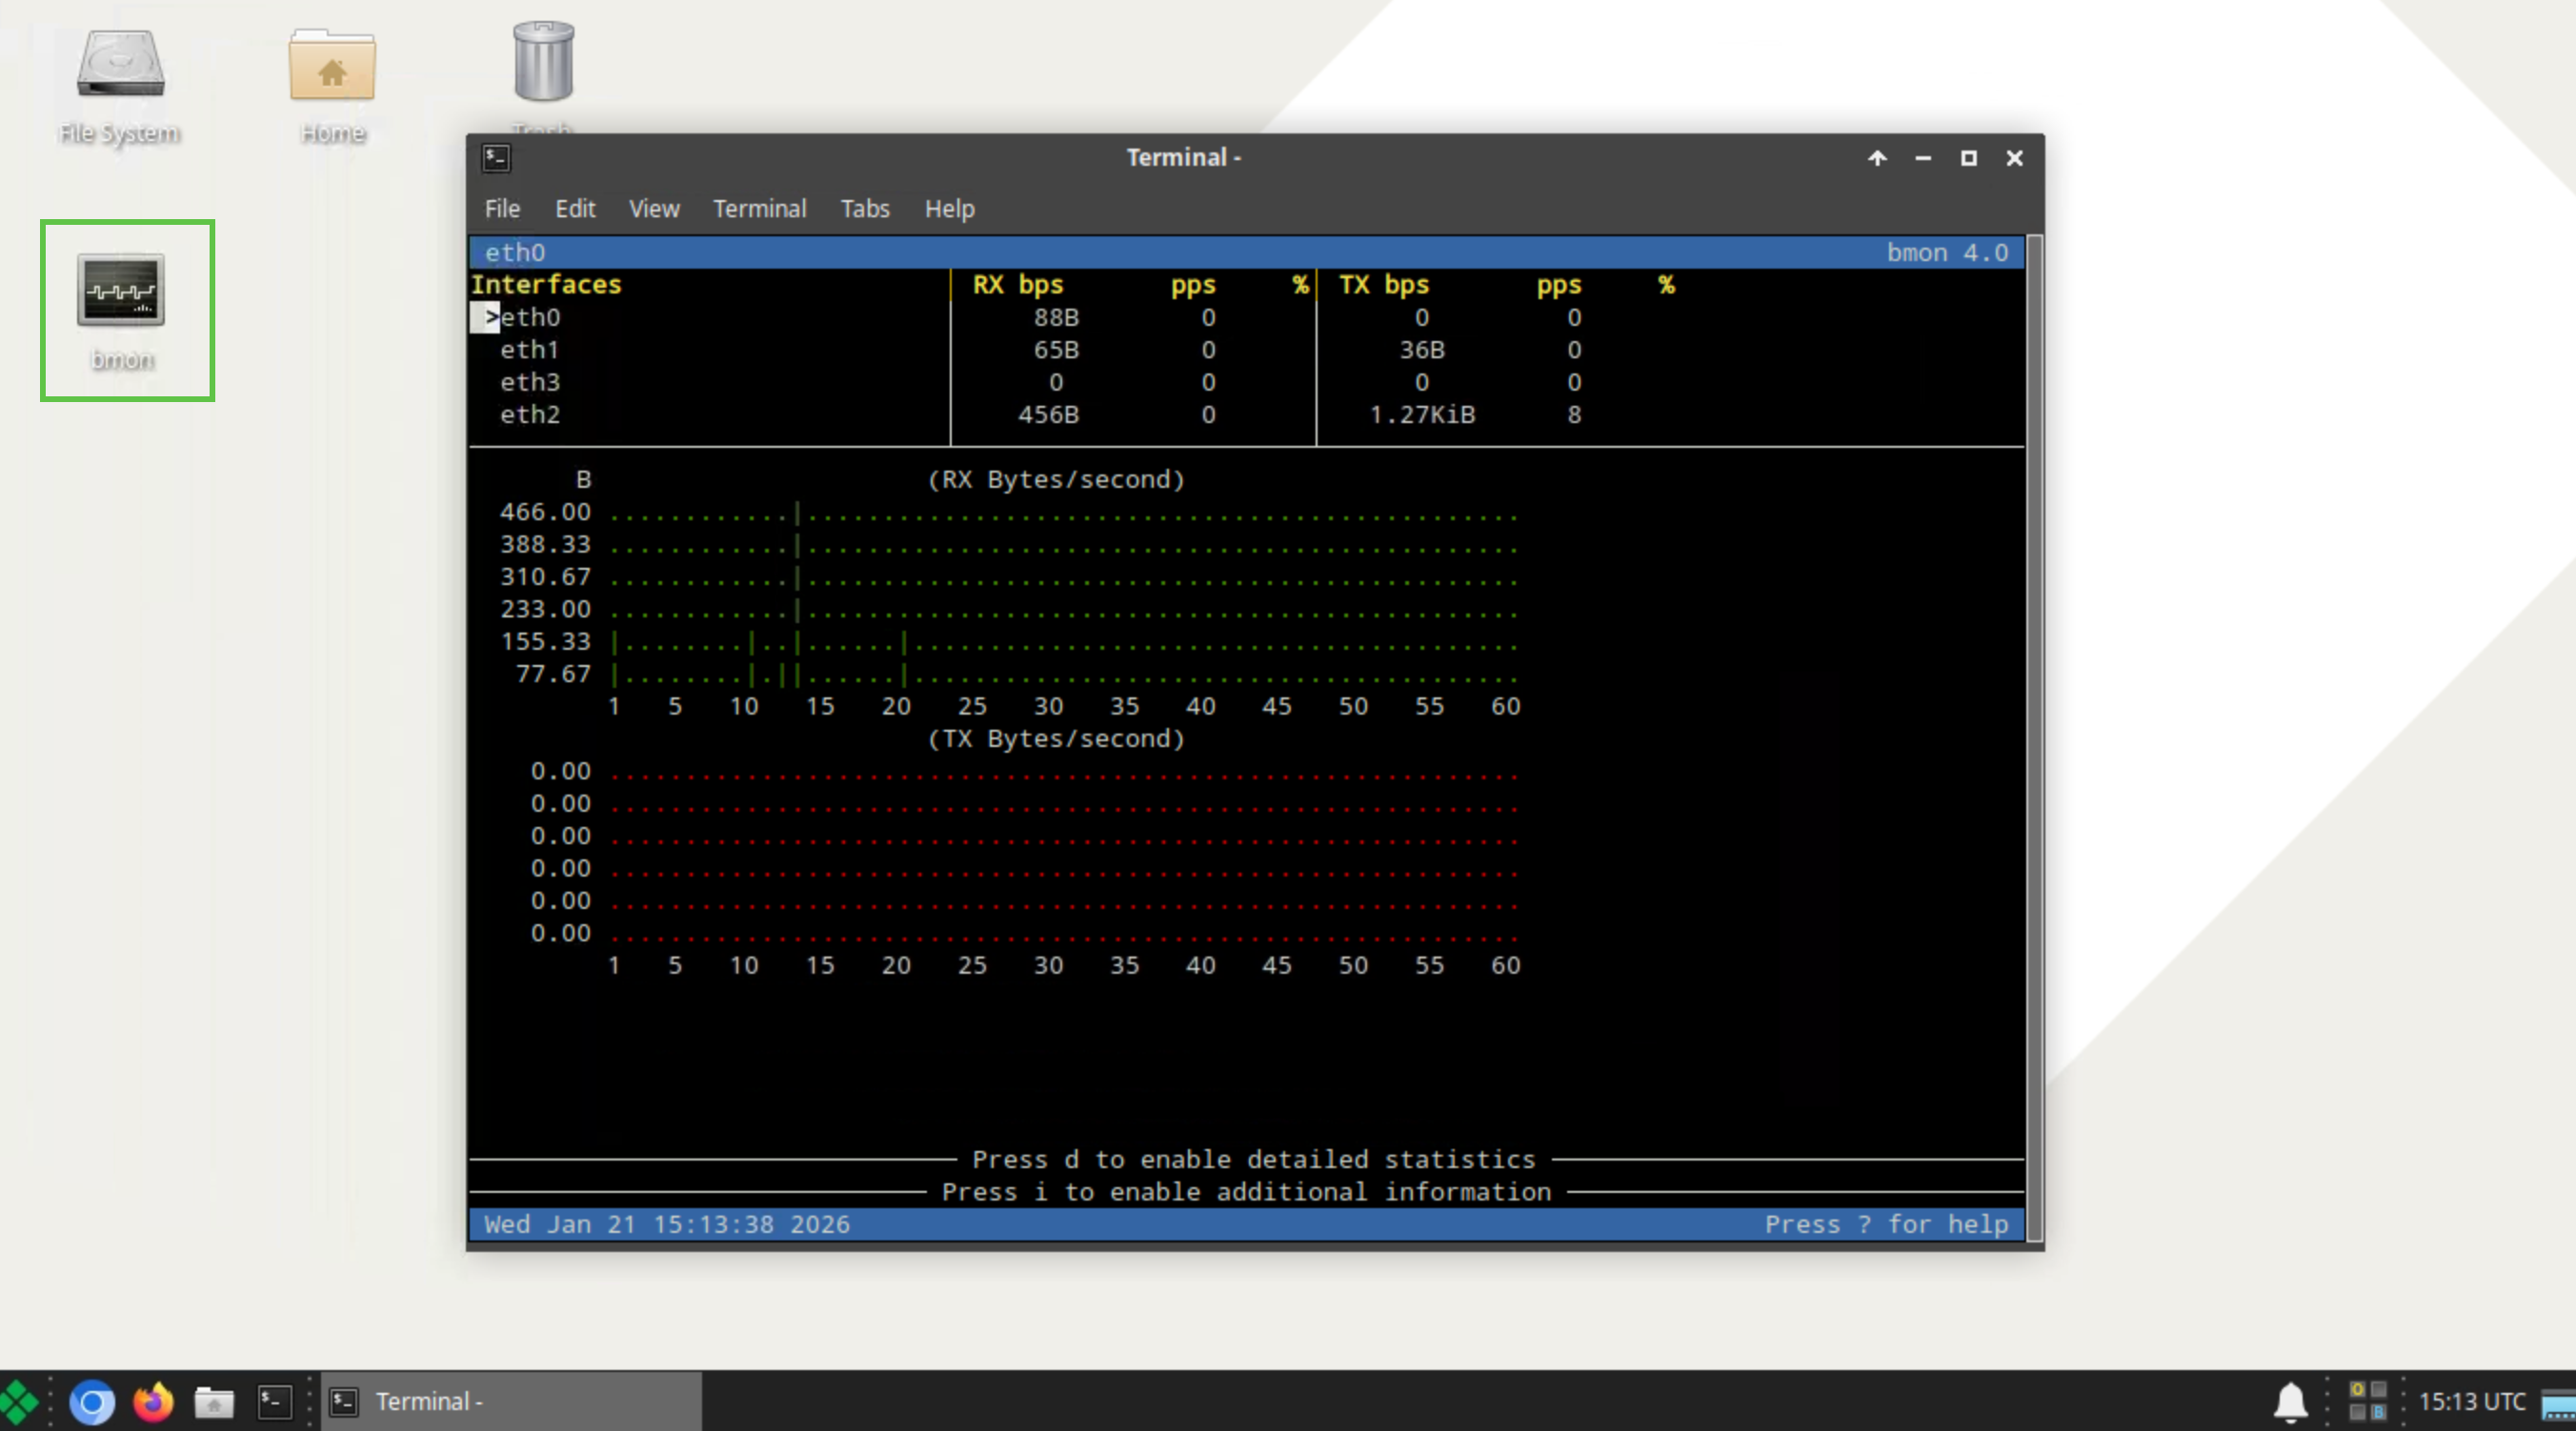
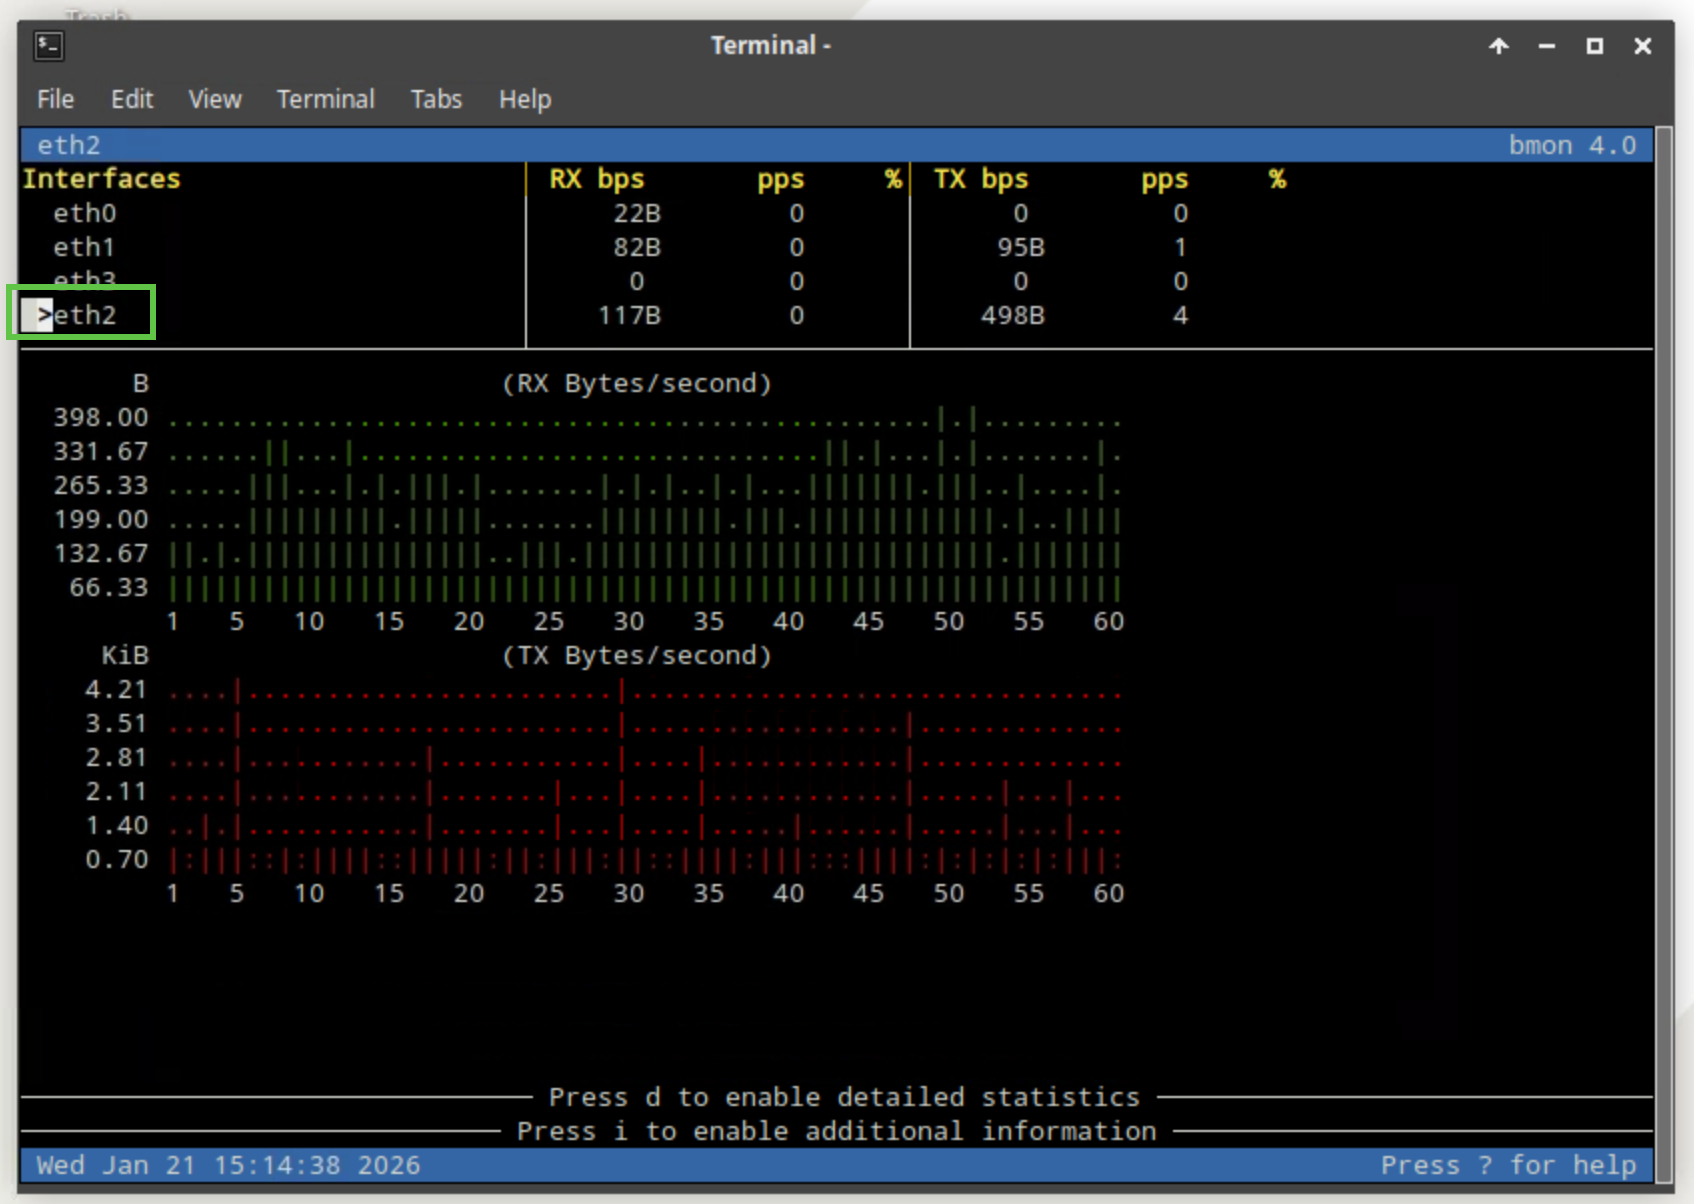
Open the bmon tool.
-
Expand the terminal window so you can see the colored charts that visualize DNS traffic flow during our tests.
-
-
Press the down arrow key on your keyboard to select the eth2 interface.
-
This indicates that you are monitoring traffic on the eth2 interface, which is connected to the 203.0.113.0 network.
-
-
Open another terminal window.
-
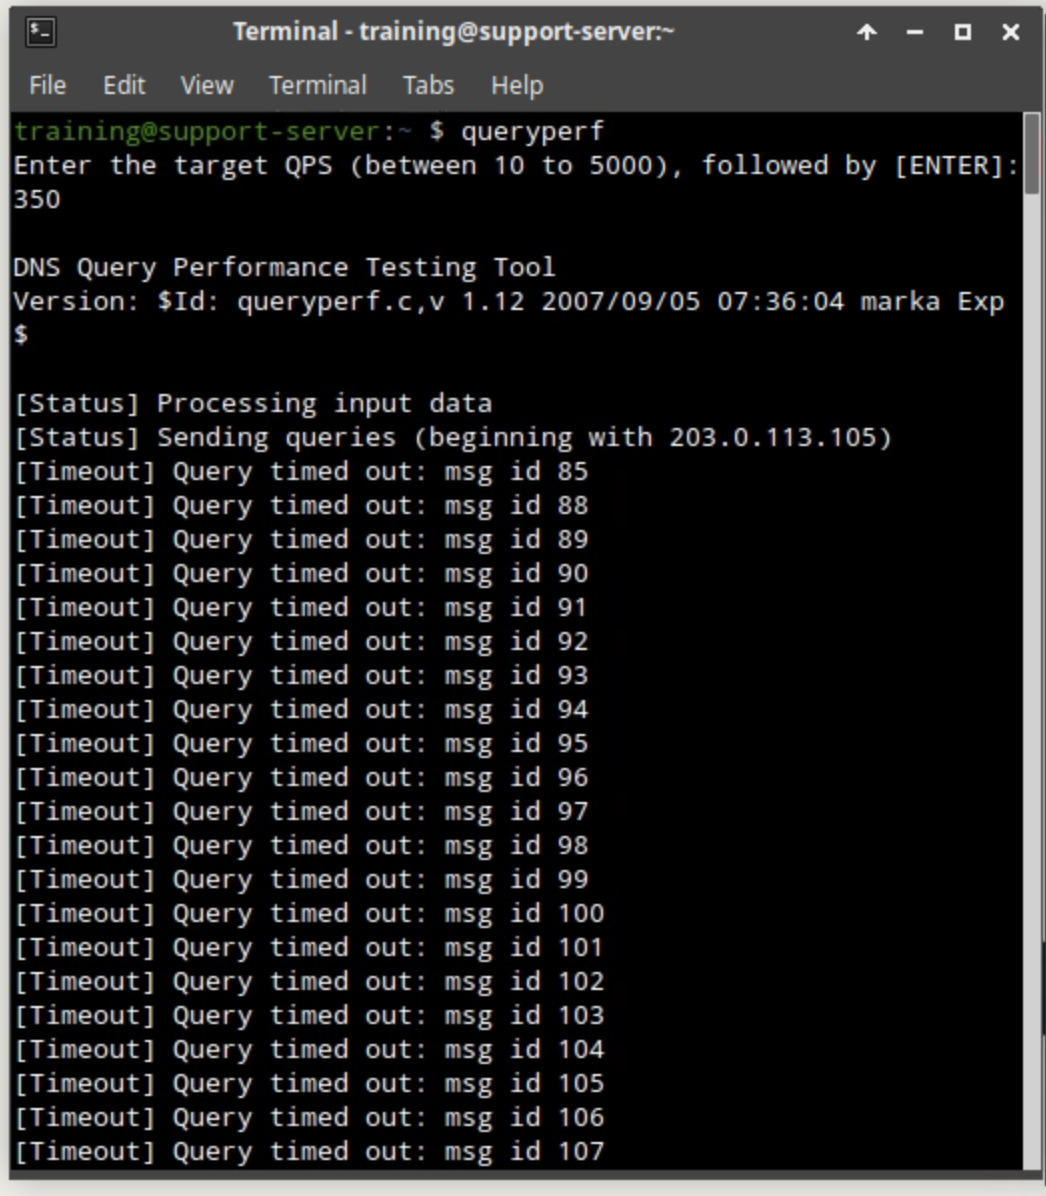
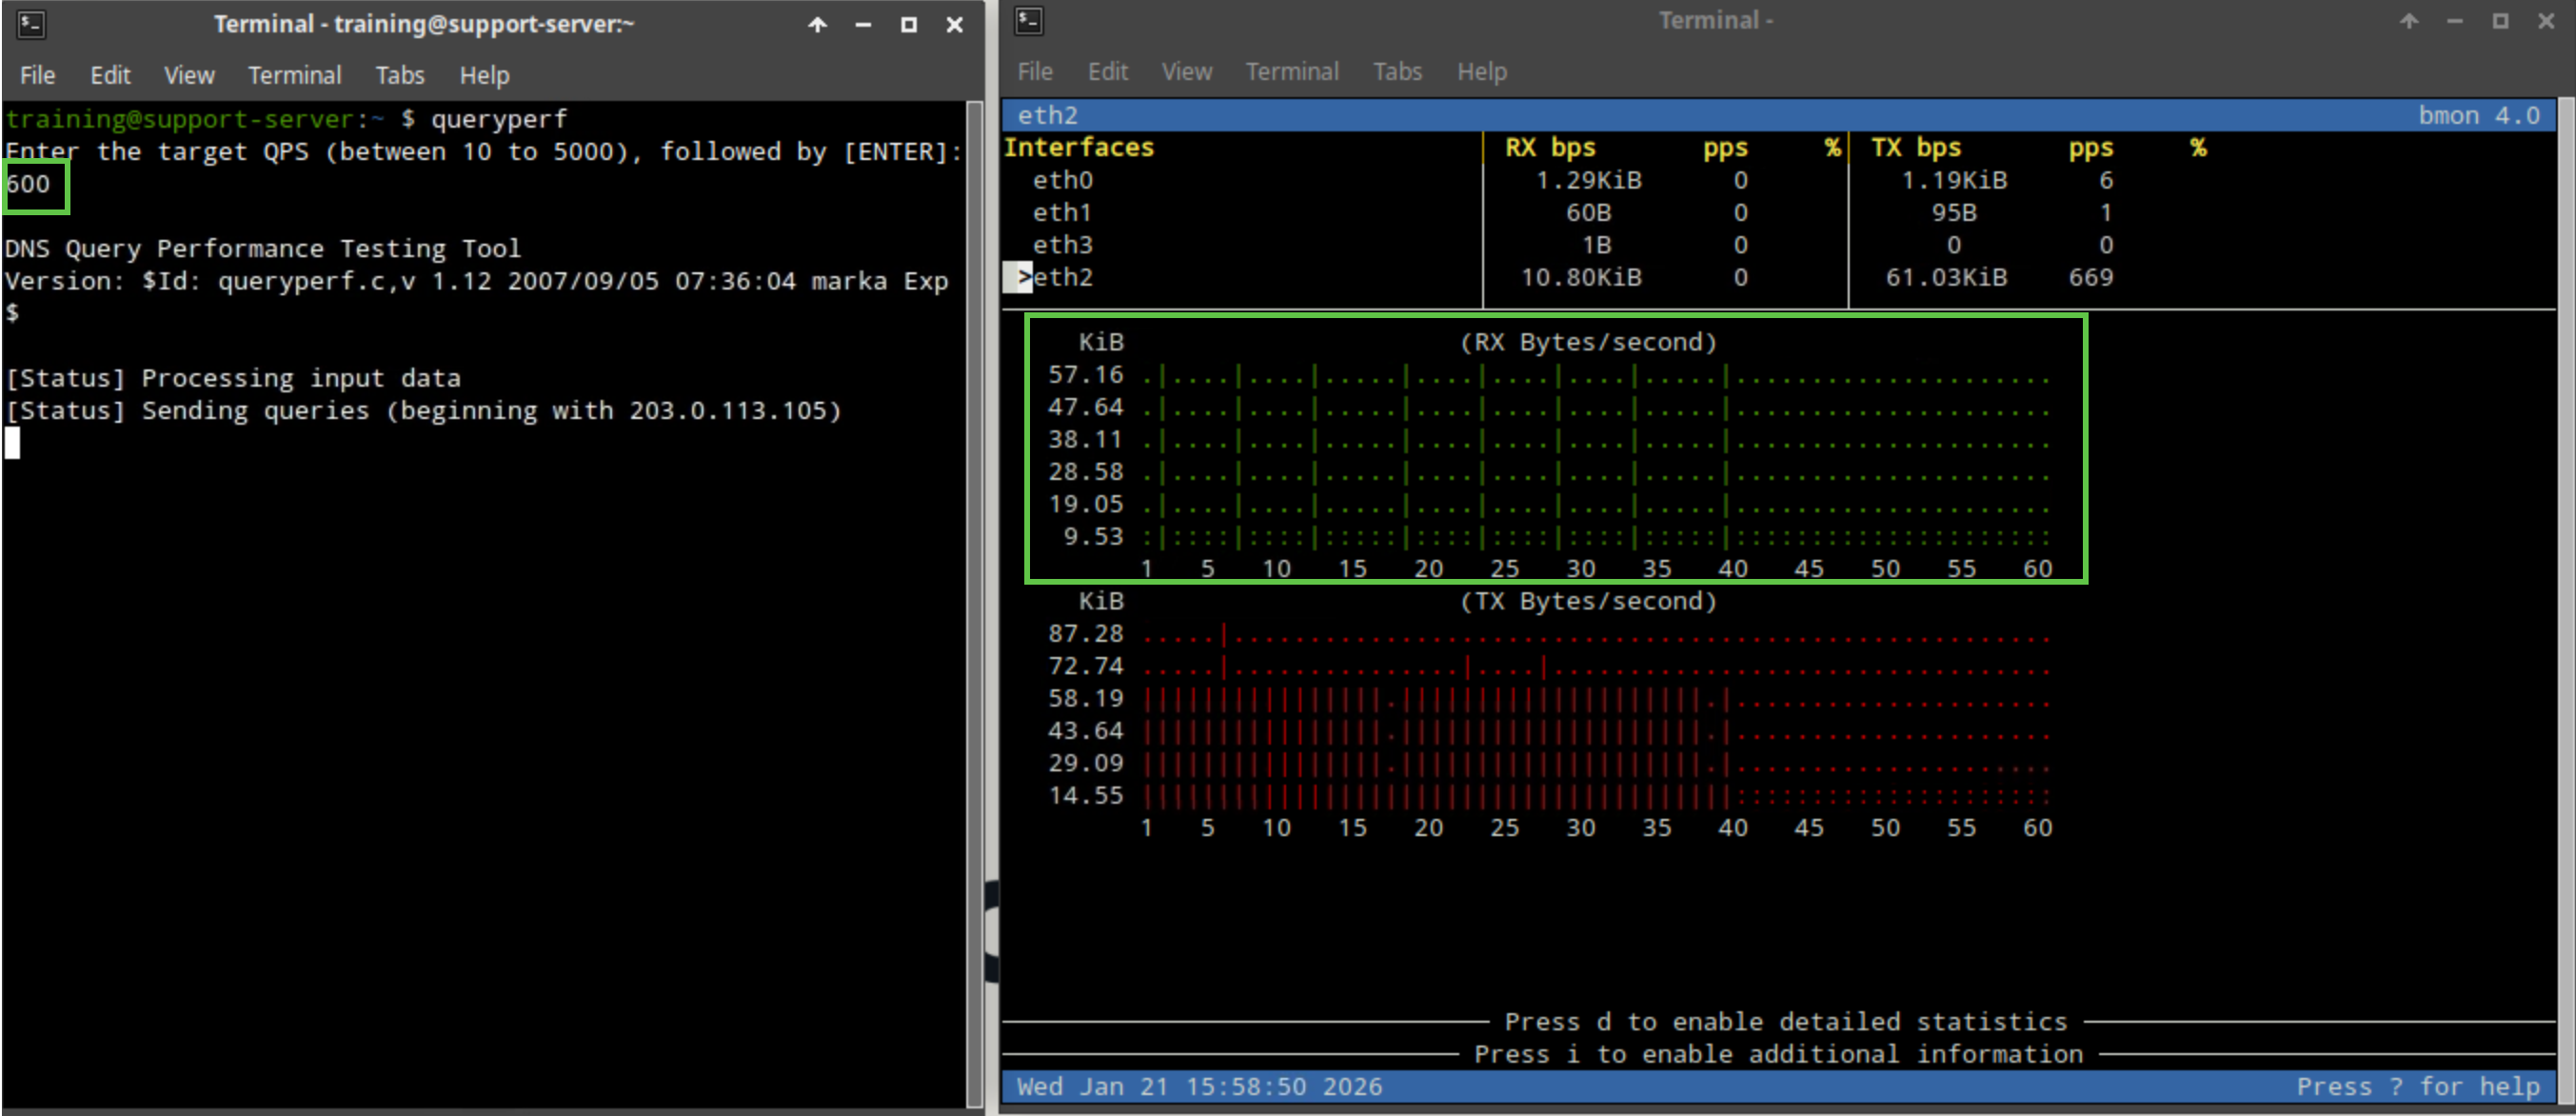
Type the command queryperf.
-
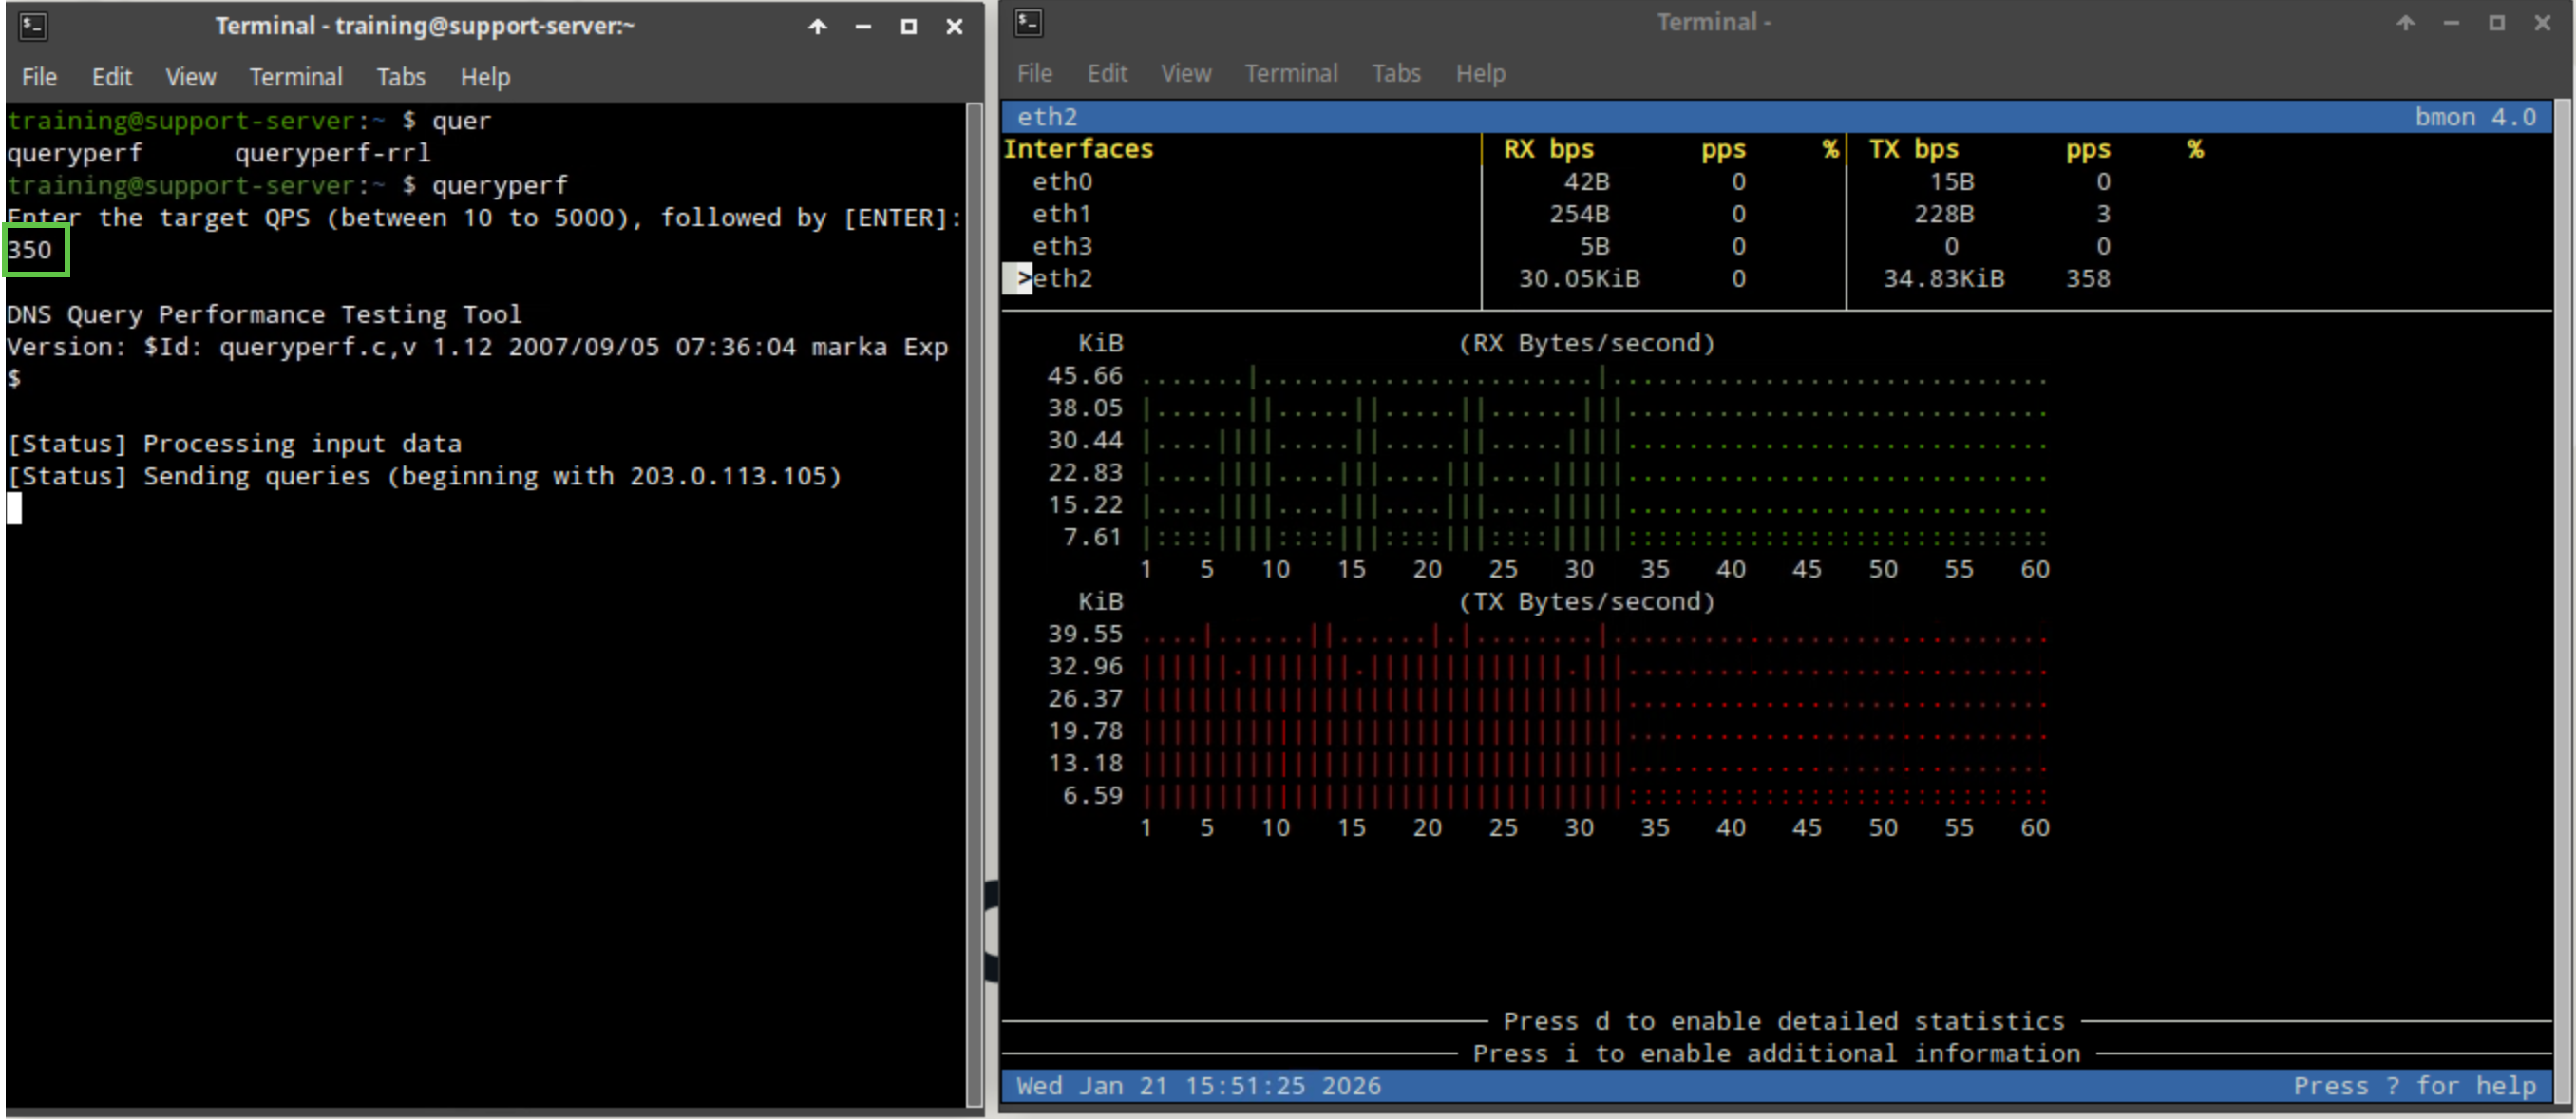
Enter a QPS value of 350.
-
The value should fall between the QPS settings for rule ID 130000100 (250) and rule ID 130000200 (500) to trigger the first rule but not the second.
-
-
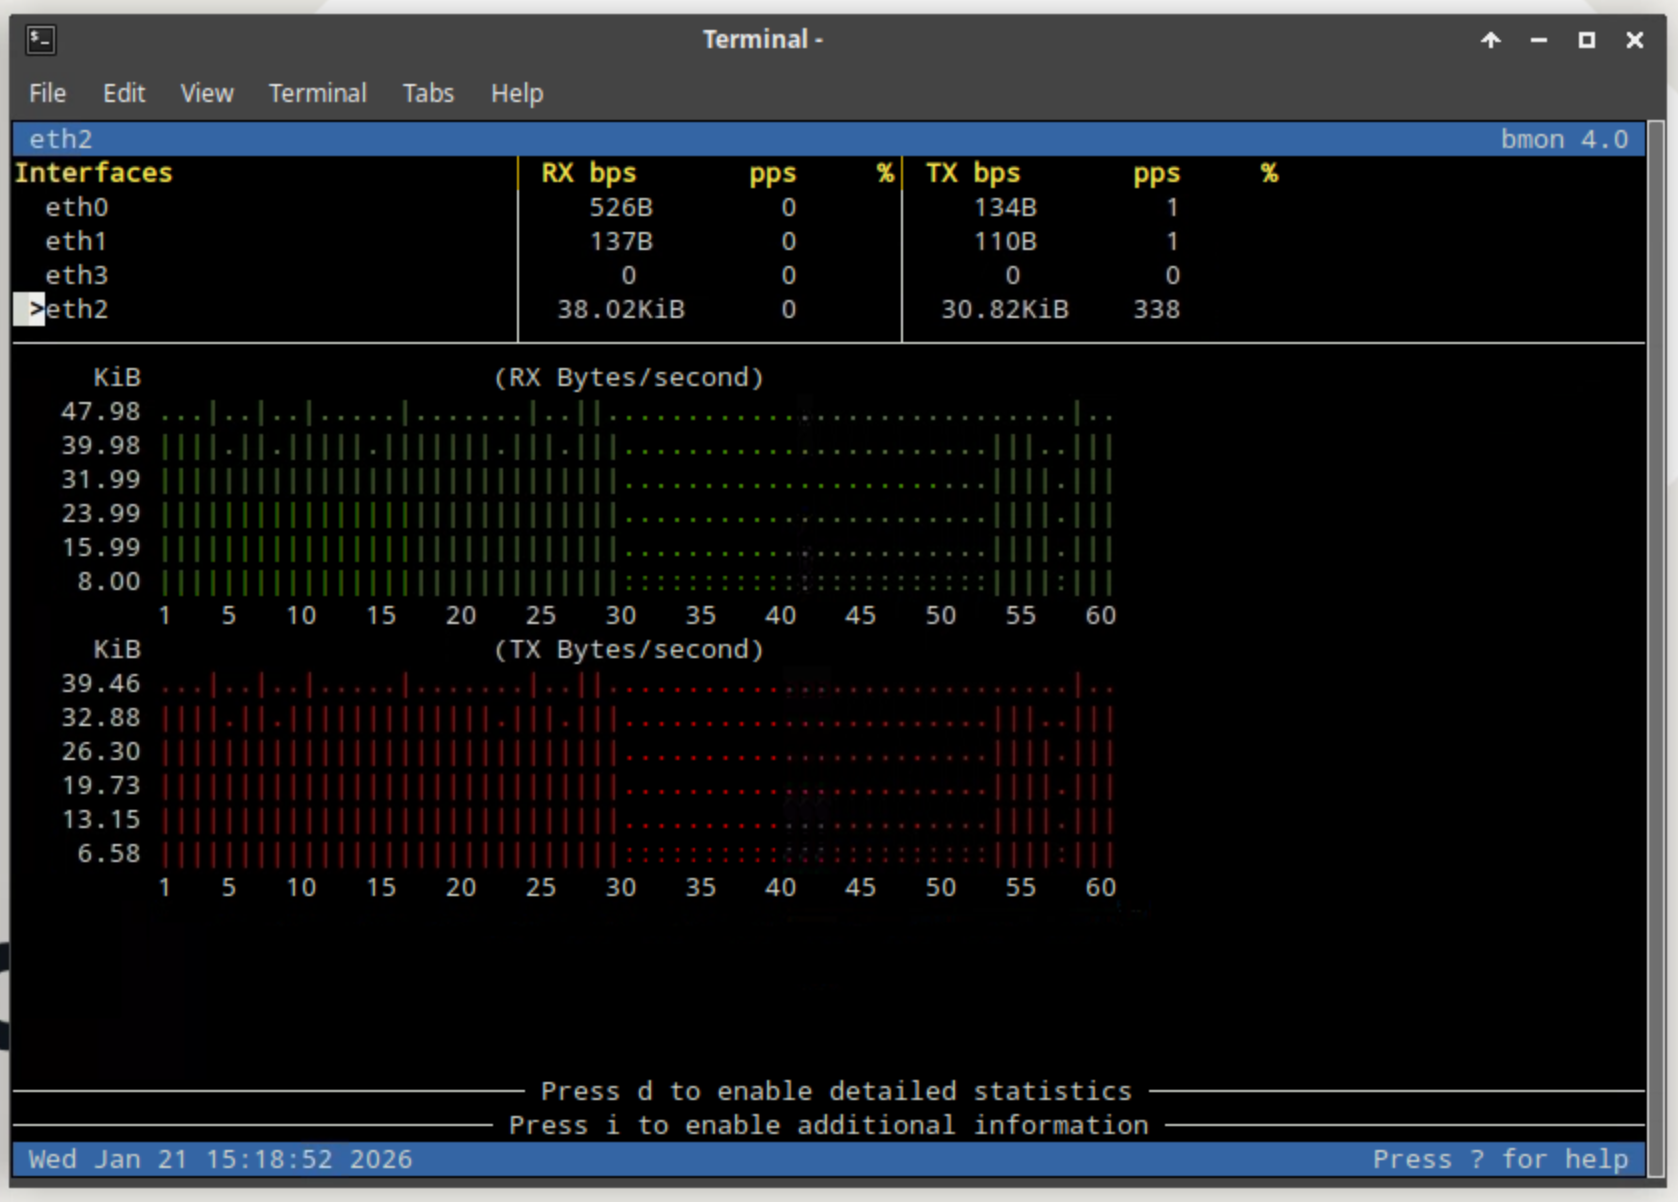
The bmon window should show a spike in RX (Bytes/second) or received traffic.
-
Navigate back to jump-desktop.
-
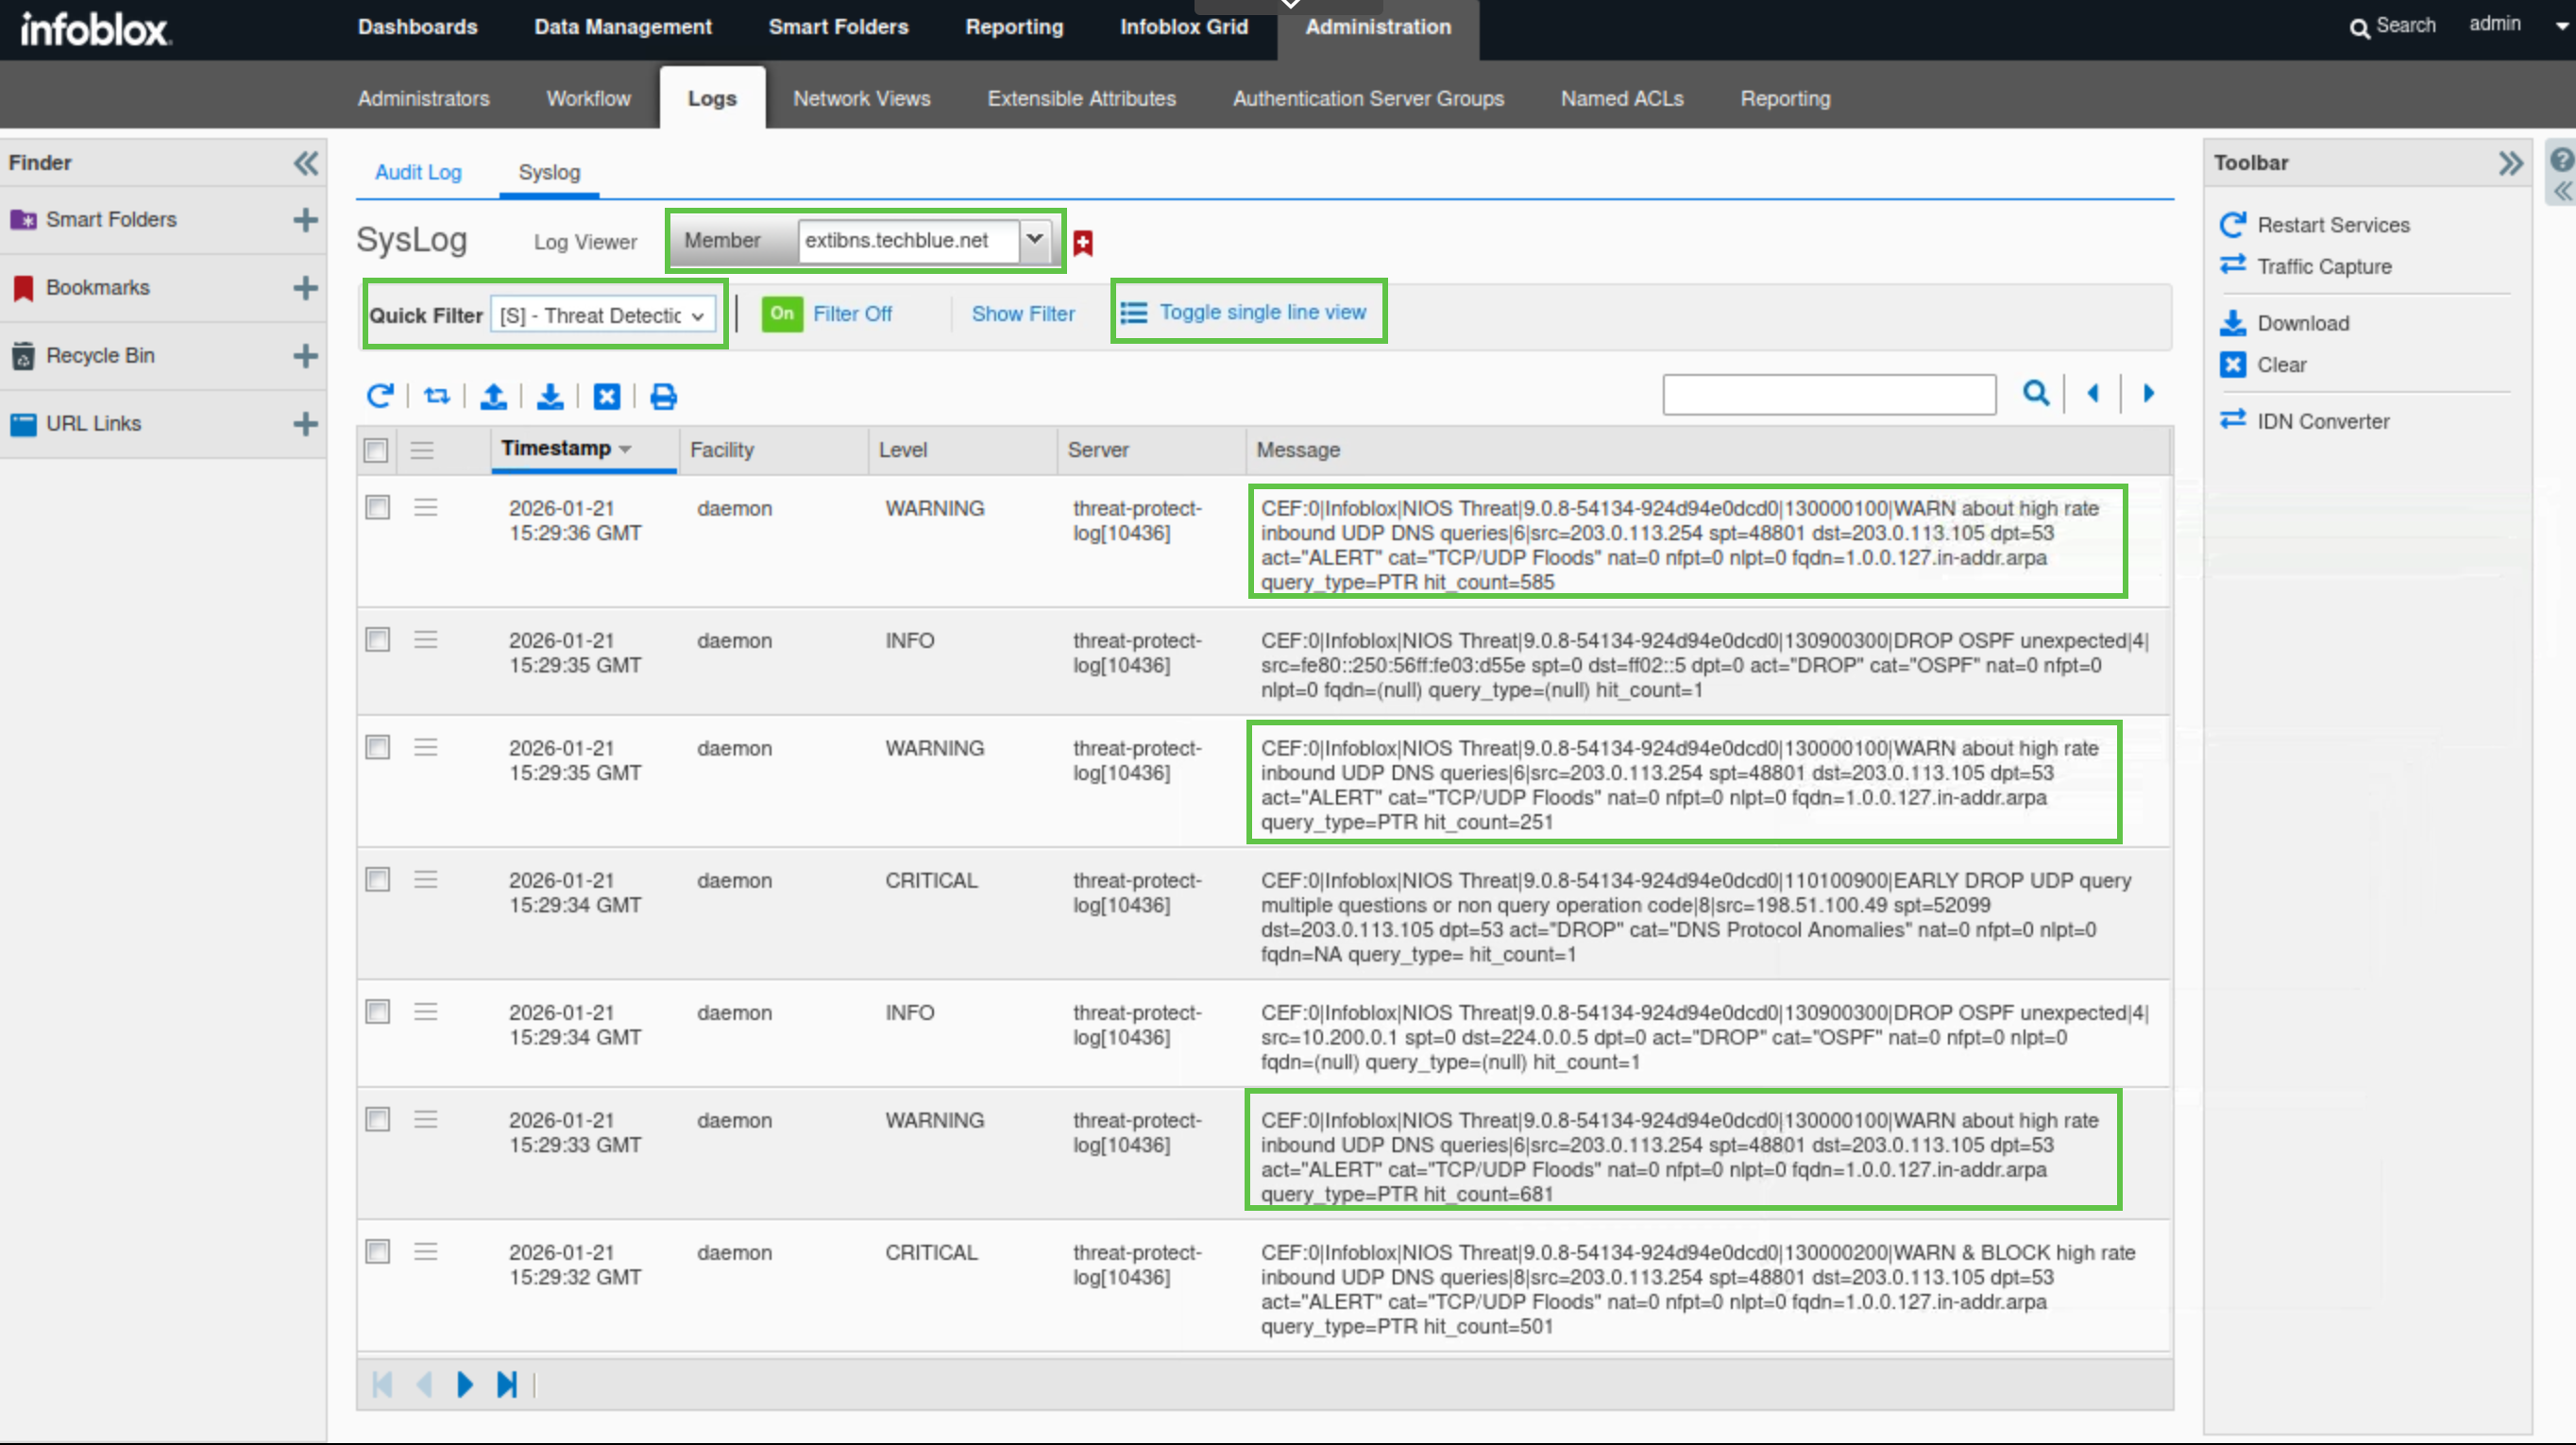
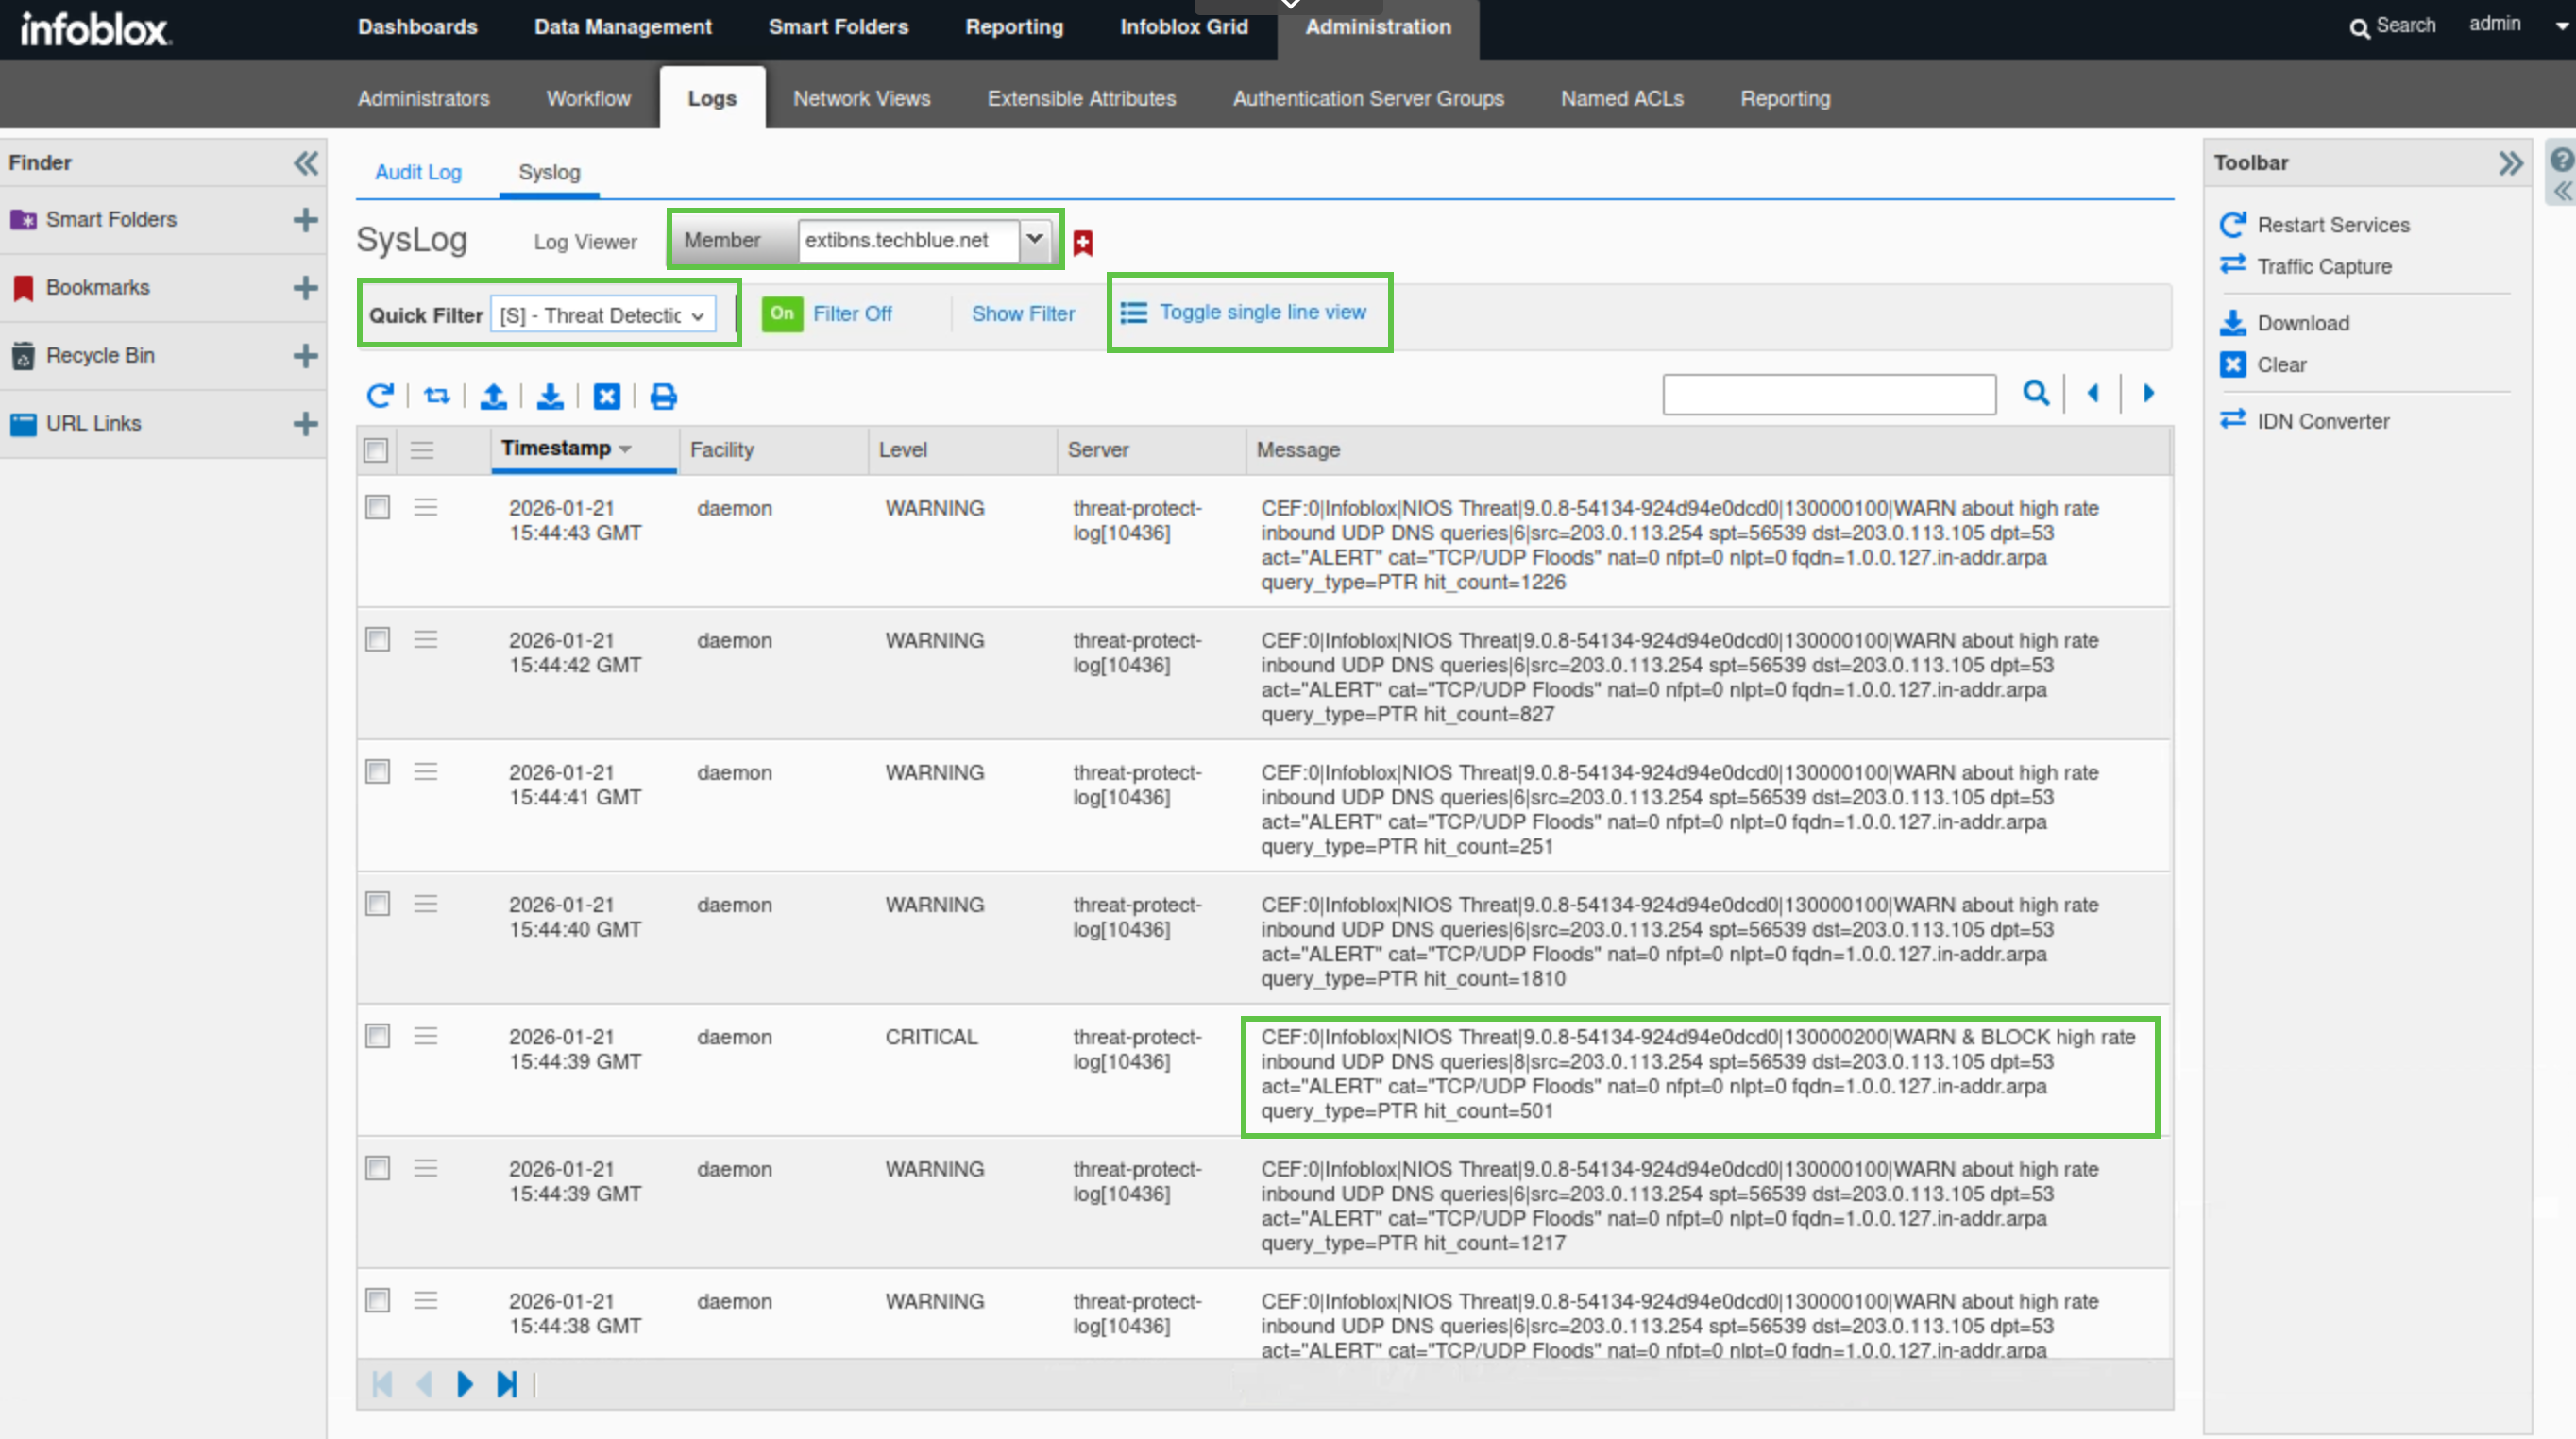
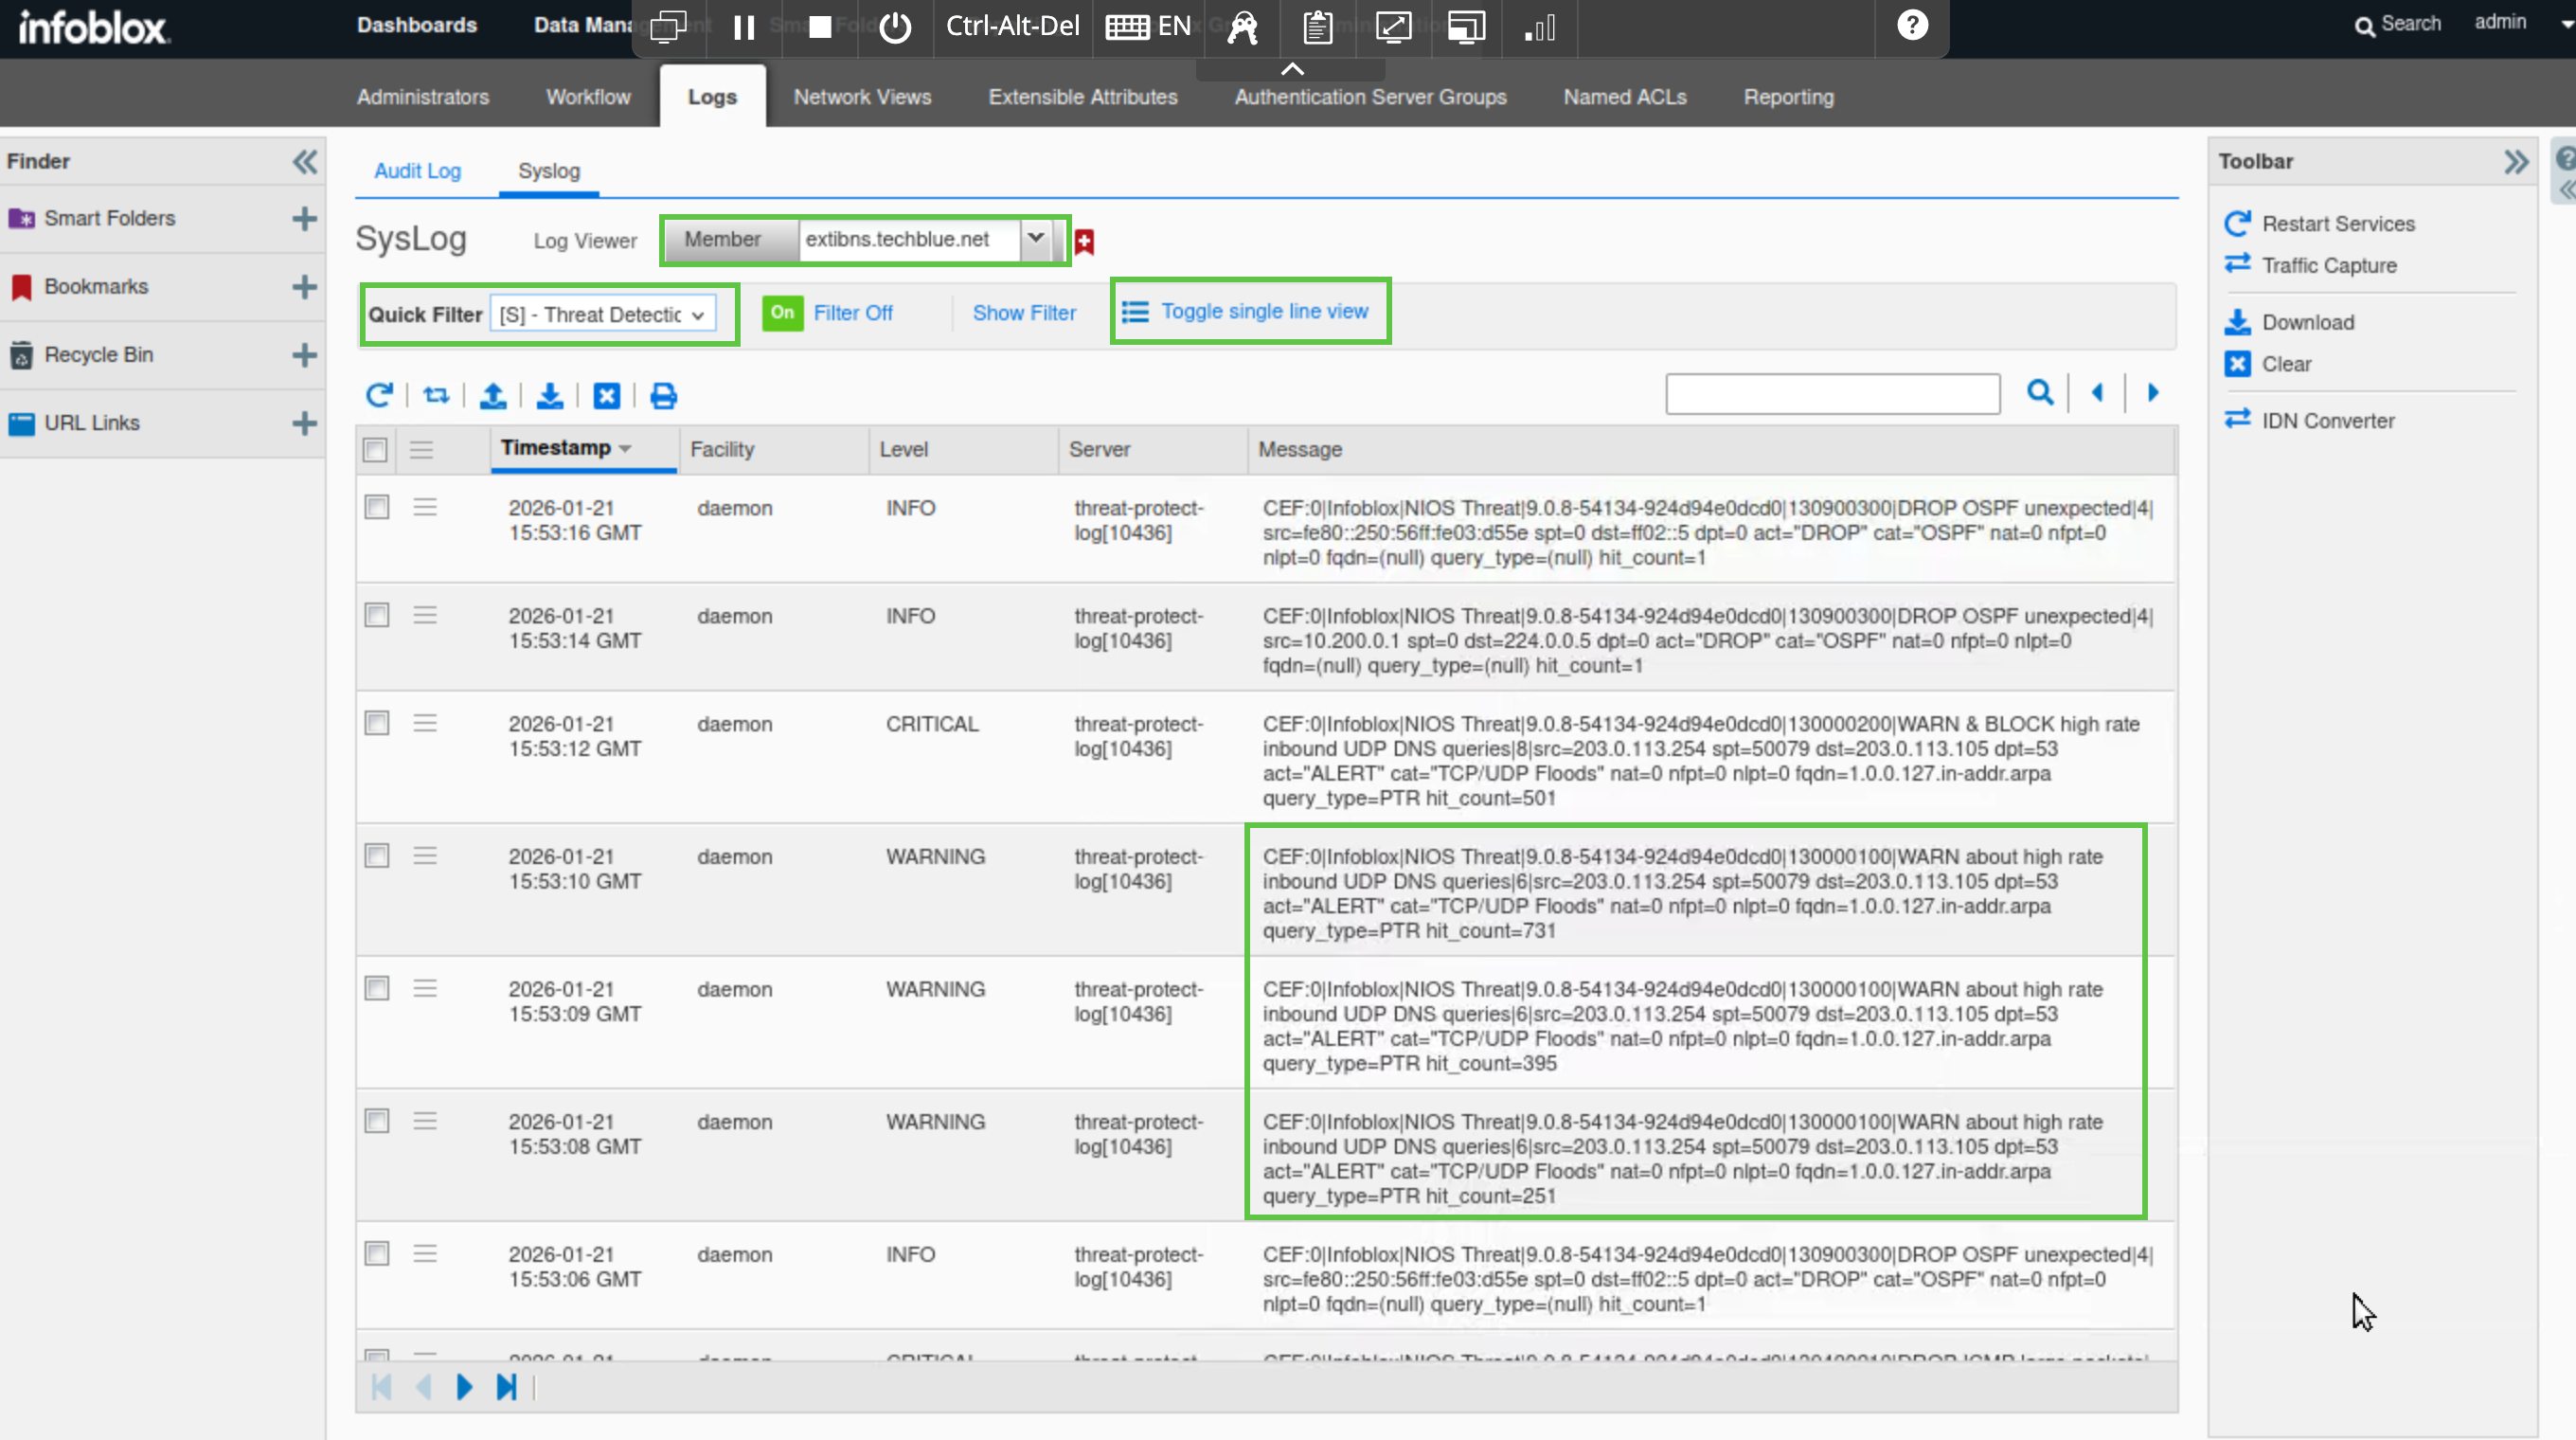
On the Grid Manager UI, navigate to Administration → Logs → Syslog
-
Choose extibns.techblue.net from the Log Viewer drop-down menu.
-
Click the Toggle multi-line view link.
-
Select Threat Detection Event Logs from the Quick Filter drop-down list.
-
You should also see syslog WARN messages for rule ID 130000100 being triggered, indicating that 203.0.113.254 is exceeding 250 QPS.
-
Switch back to support-server.
-
Rerun the queryperf command.
-
Enter the value of 600 QPS.
-
The value must be greater than the QPS setting for rule ID 130000200 (500).
-
-
The bmon window should show the spike of RX (Bytes/second) or received traffic.
-
Since we are still in monitor-mode, the packets won’t actually be dropped, which is why the bmon window shows a steady spike in traffic.
-
-
Switch back to jump-desktop.
-
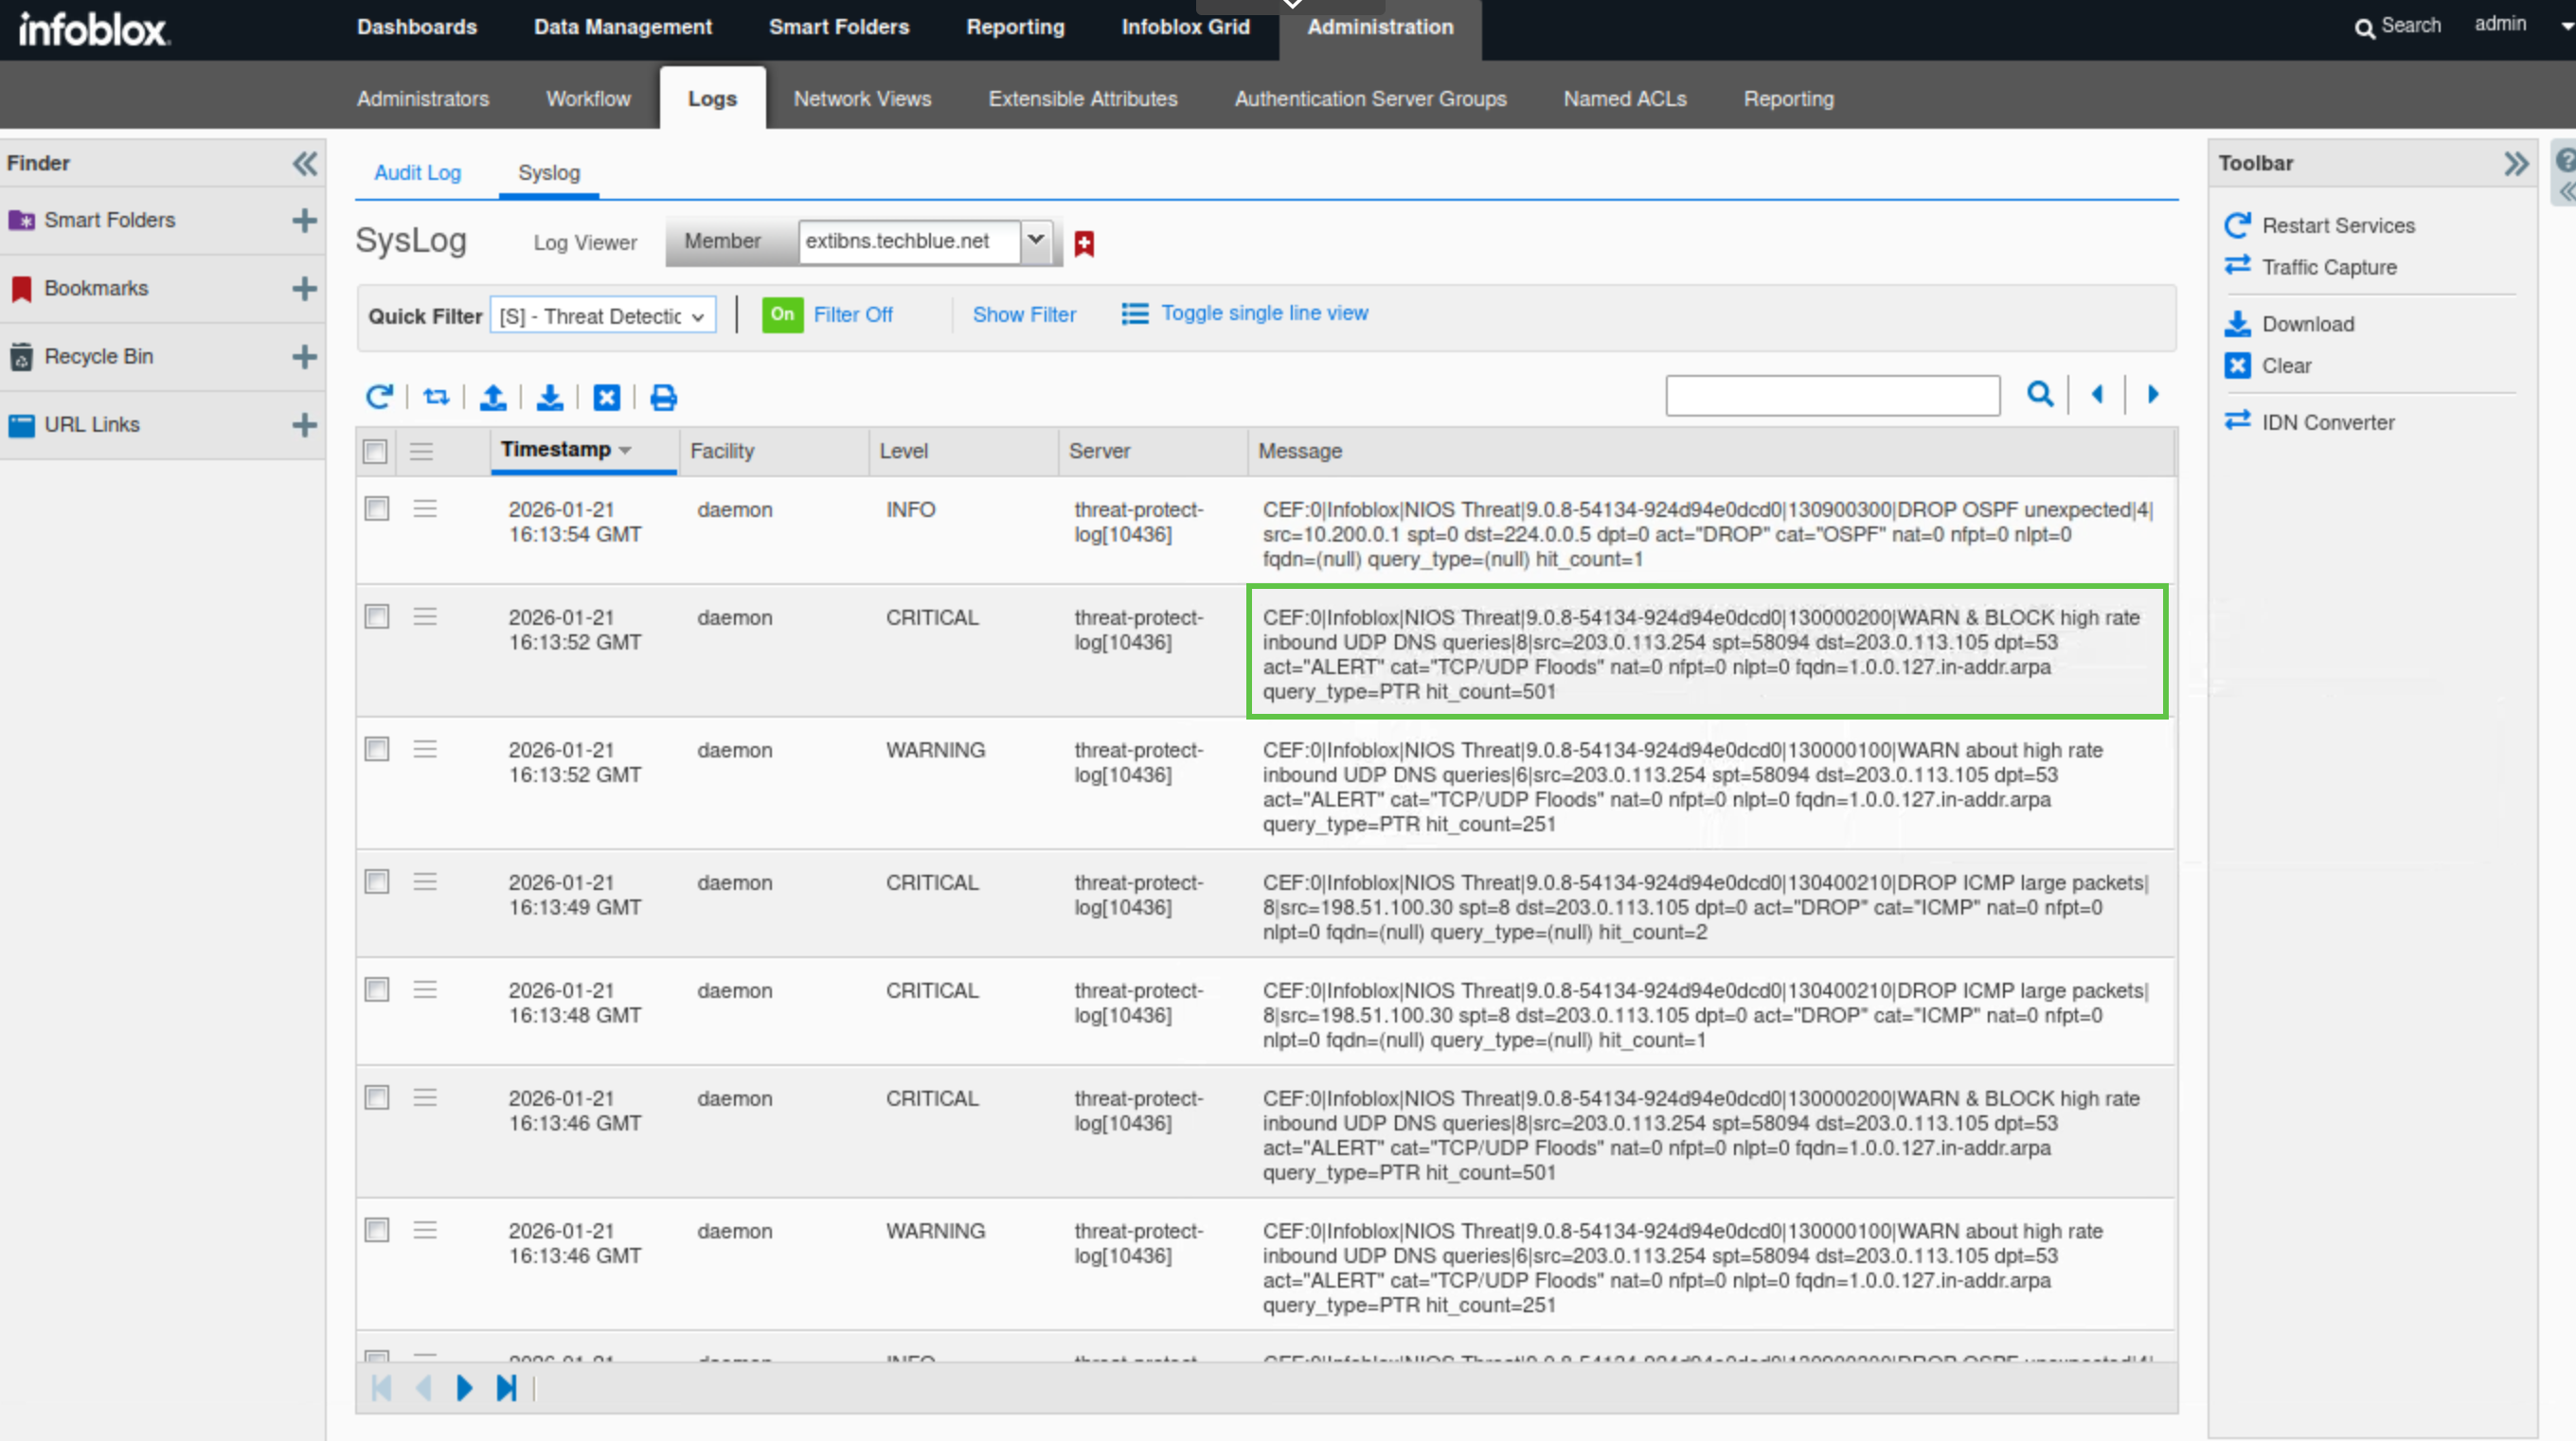
On the Grid Manager UI, navigate to Administration → Logs → Syslog
-
Choose extibns.techblue.net from the Log Viewer drop-down menu.
-
Click the Toggle multi-line view link.
-
Select Threat Detection Event Logs from the Quick Filter drop-down list.
-
This time, you should see syslog WARN & BLOCK alerts for rule ID 130000200 being triggered, indicating that 203.0.113.254 is sending more than 500 QPS. Since we are still in monitor-mode, the packets won’t actually be blocked yet.
Task 9 Solution: Test the new Configuration with monitor-mode Disabled
In this task, we will disable monitor mode so extibns.techblue.net can drop packets when necessary, and we will rerun the same tests once at 350 QPS and once at 600 QPS.
-
Log in to the CLI of the NIOS-4 virtual machine (admin/infoblox).
-
This is the command-line interface for extibns.techblue.net.
-
-
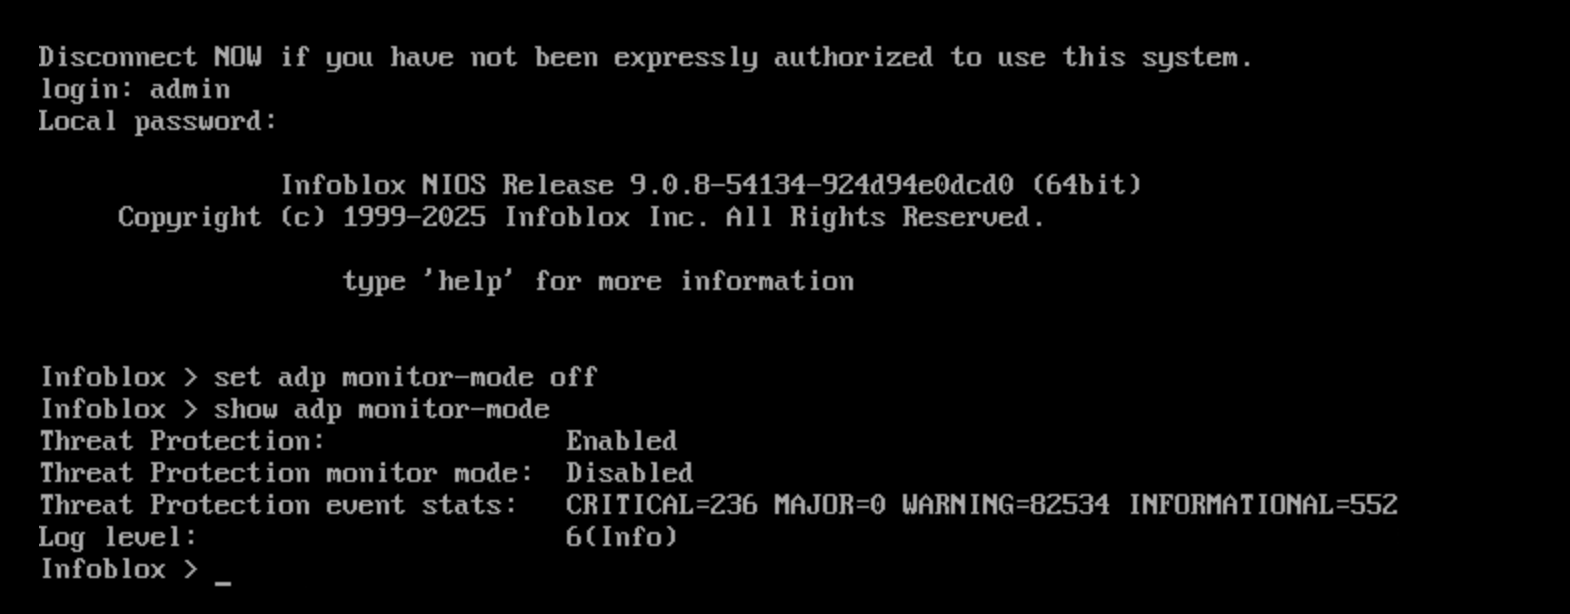
Issue the set adp monitor-mode off command.
-
This command will disable monitor-mode off allowing the Grid member to drop packets when triggered.
-
-
Issue the show adp monitor-mode command.
-
This command will display the current DNS Infrastructure Protection settings configured on the Grid member.
-
-
Switch back to the support-server VM.
-
Rerun the queryperf command once more.
-
Set the query rate to 350.
-
The bmon window should show the spike of RX (Bytes/second) or received traffic. This should be almost identical to what we observed with monitor-mode disabled. This is because rule ID 130000100 is a WARN rule; it will not drop any packets when triggered, only generate syslog messages.
-
-
Switch back to jump-desktop.
-
On the Grid Manager UI, navigate to Administration → Logs → Syslog
-
Choose extibns.techblue.net from the Log Viewer drop-down menu.
-
Click the Toggle multi-line view link.
-
Select Threat Detection Event Logs from the Quick Filter drop-down list.
-
You should see the same syslog WARN alerts of rule ID 130000100 being triggered.
-
Switch back to support-server.
-
Rerun the queryperf command once more.
-
Set the query rate to 600, which exceeds the threshold for rule ID 130000200.
-
Packets will start to drop, and the bmon window will show RX (Bytes/second) traffic spikes, then drop for 5 seconds, then spike again until the queryperf script completes, verifying that monitor-mode has been switched off.
-
-
Switch back to jump-desktop.
-
On the Grid Manager UI, navigate to Administration → Logs → Syslog
-
Choose extibns.techblue.net from the Log Viewer drop-down menu.
-
Click the Toggle multi-line view link.
-
Select Threat Detection Event Logs from the Quick Filter drop-down list.
-
This time, you should see syslog WARN & BLOCK alerts for rule ID 130000200 being triggered, indicating that 203.0.113.254 is sending more than 500 QPS.
-
With monitor mode turned off, we have noticed using bmon that packets are indeed dropped. However, rule ID 130000200 is set to the action ALERT and cannot be changed because it is a system rule. As a result, the action recorded in the syslog will remain as ALERT. This is because the rule is designed to first generate an ALERT if any source IP sends inbound UDP DNS packets at a rate equal to the configured limit (500 packets per second in our example). When the packet rate exceeds this threshold, the rule begins blocking all such packets for a specified duration (5 seconds in our example).
-