3615 - Configuring RRL to protect authoritative servers
Scenario
Your team decided to apply different security policies to your Grid members serving DNS. members will only accept queries originating from internal address space using named ACLs. Please make the necessary configuration changes in the Grid.
Estimate Completion Time
20 to 25 minutes
Credentials
Description | Username | Password | URL or IP |
|---|---|---|---|
Grid Manager UI | admin | infoblox |
Course References
1006: NIOS DNS Service Overview
2009: Configuring NIOS DNS Services
Lab Initiation
Access jump-desktop
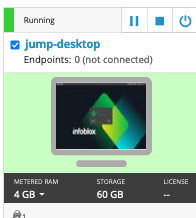
Once the lab is deployed, you can access the virtual machines required to complete this lab activity. To initiate the lab, click on the jump-desktop tile and login to the Linux UI:
Username: training
Password: infoblox
Initiate lab
To initiate the lab, double-click the Launch Lab icon on the Desktop.

Launch Lab
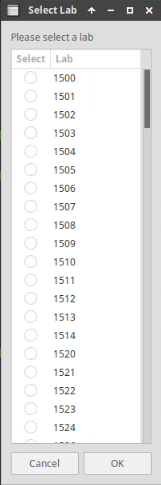
Choose the lab number from the list and click OK.
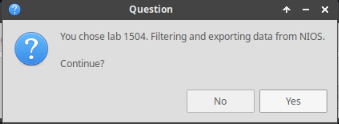
After clicking OK, you will see a pop-up message with a brief description of the lab task. If the description looks correct, click Yes to continue lab initiation.
Lab initiation will take a couple of minutes to finish.
Once complete, you will see another pop-up message with the login credentials and the URL for the Grid Manager’s User Interface. Note that the credentials may differ from those from prior labs.
Tasks
Task 1: Configuring Response Rate Limiting
In this task, you will enable RRL (Response Rate Limiting) on the NS3 (10.200.0.33) and observe its effect.
login to NS3 (10.200.0.33):
Navigate to Dashboards → Status
Add DNS Statistics widget to monitor the performance ns3.example.local
Select Responses per Second option.
Switch to the support-server VM:
Click on the bmon icon on the desktop, this starts the application that monitors the traffic sent and received by each interface on the Linux server, maximize its to see the graph on the bottom.
Open a terminal window, type the following command, it starts a query generator that queries for various large RRset in the nuts.corp domain:
queryperf-rrl
login to NS3 (10.200.0.33):
Check the Responses per Second graph, and note the traffic pattern. You may have to wait a couple of minutes for the graph to be updated.
Check syslog.
What information is generated, if any, from the traffic?
Switch to the NS3 VM named nios-5:
Execute the following 3 commands, the first to see the RRL is disabled, second to turn it on, and the third to verify it is enabled. You do not need to wait for the traffic generation to stop:
show dns_rrlset dns_rrl enableshow dns_rrl
Switch back to the support-server VM:
Open a terminal window,and re-type the following command, to restart the query generator:
queryperf-rrl
login back to NS3 (10.200.0.33):
Check the Responses per Second graph, and note the traffic pattern.
How is this traffic pattern different?
Check syslog
What information is generated?
Solutions
Task 1 solution: Configuring Response Rate Limiting
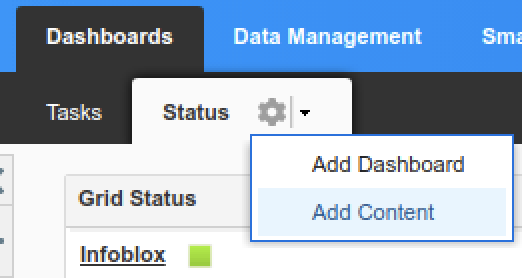
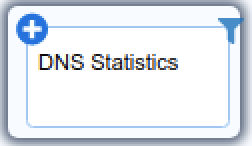
On Jump-Desktop (10.35.22.10), login to NS3 (10.200.0.33), navigate to Dashboard → Status → Add Content, drag the DNS Statistics widget to the dashboard, as shown below:
In the widget, choose Select Member and choose ns3.example.local. Tick the checkbox for Auto Refresh Period, and change the time to every 10 seconds, as shown below: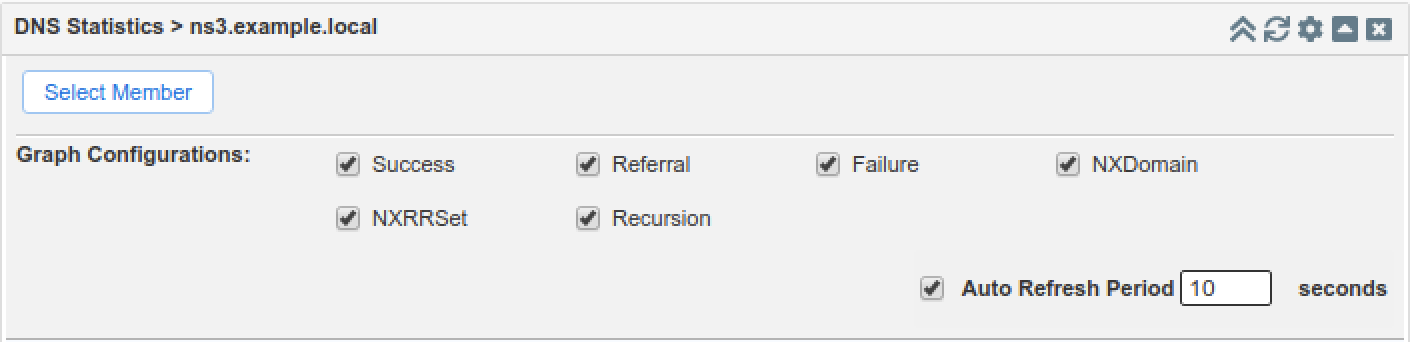
In the DNS Statistics Widget, click Response per Second to change the default view, as shown below: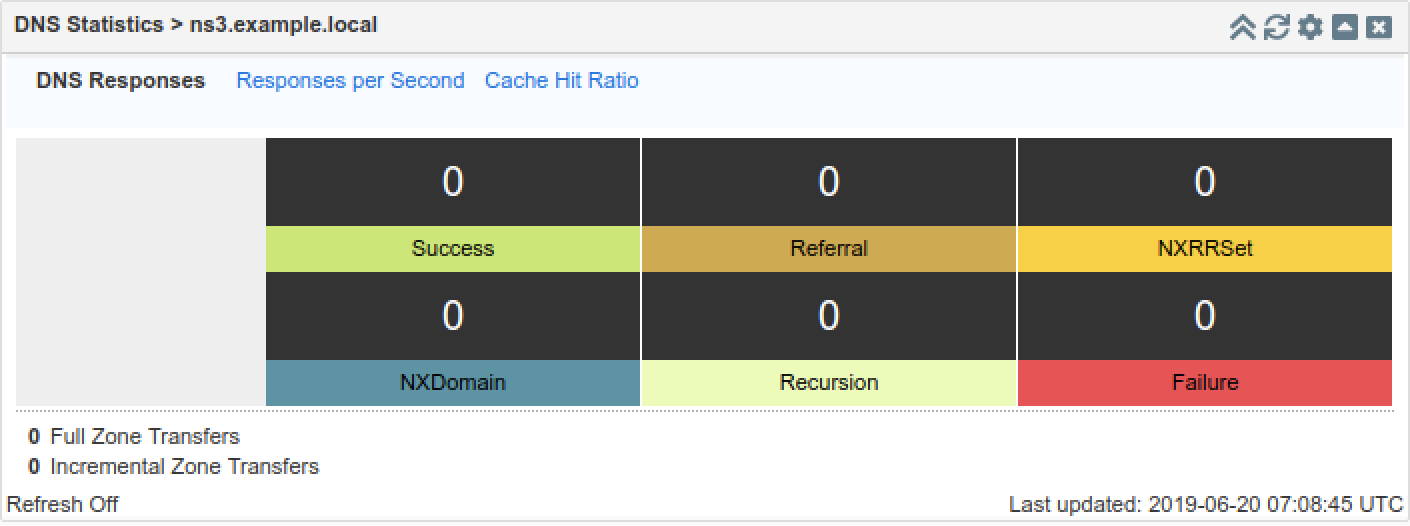

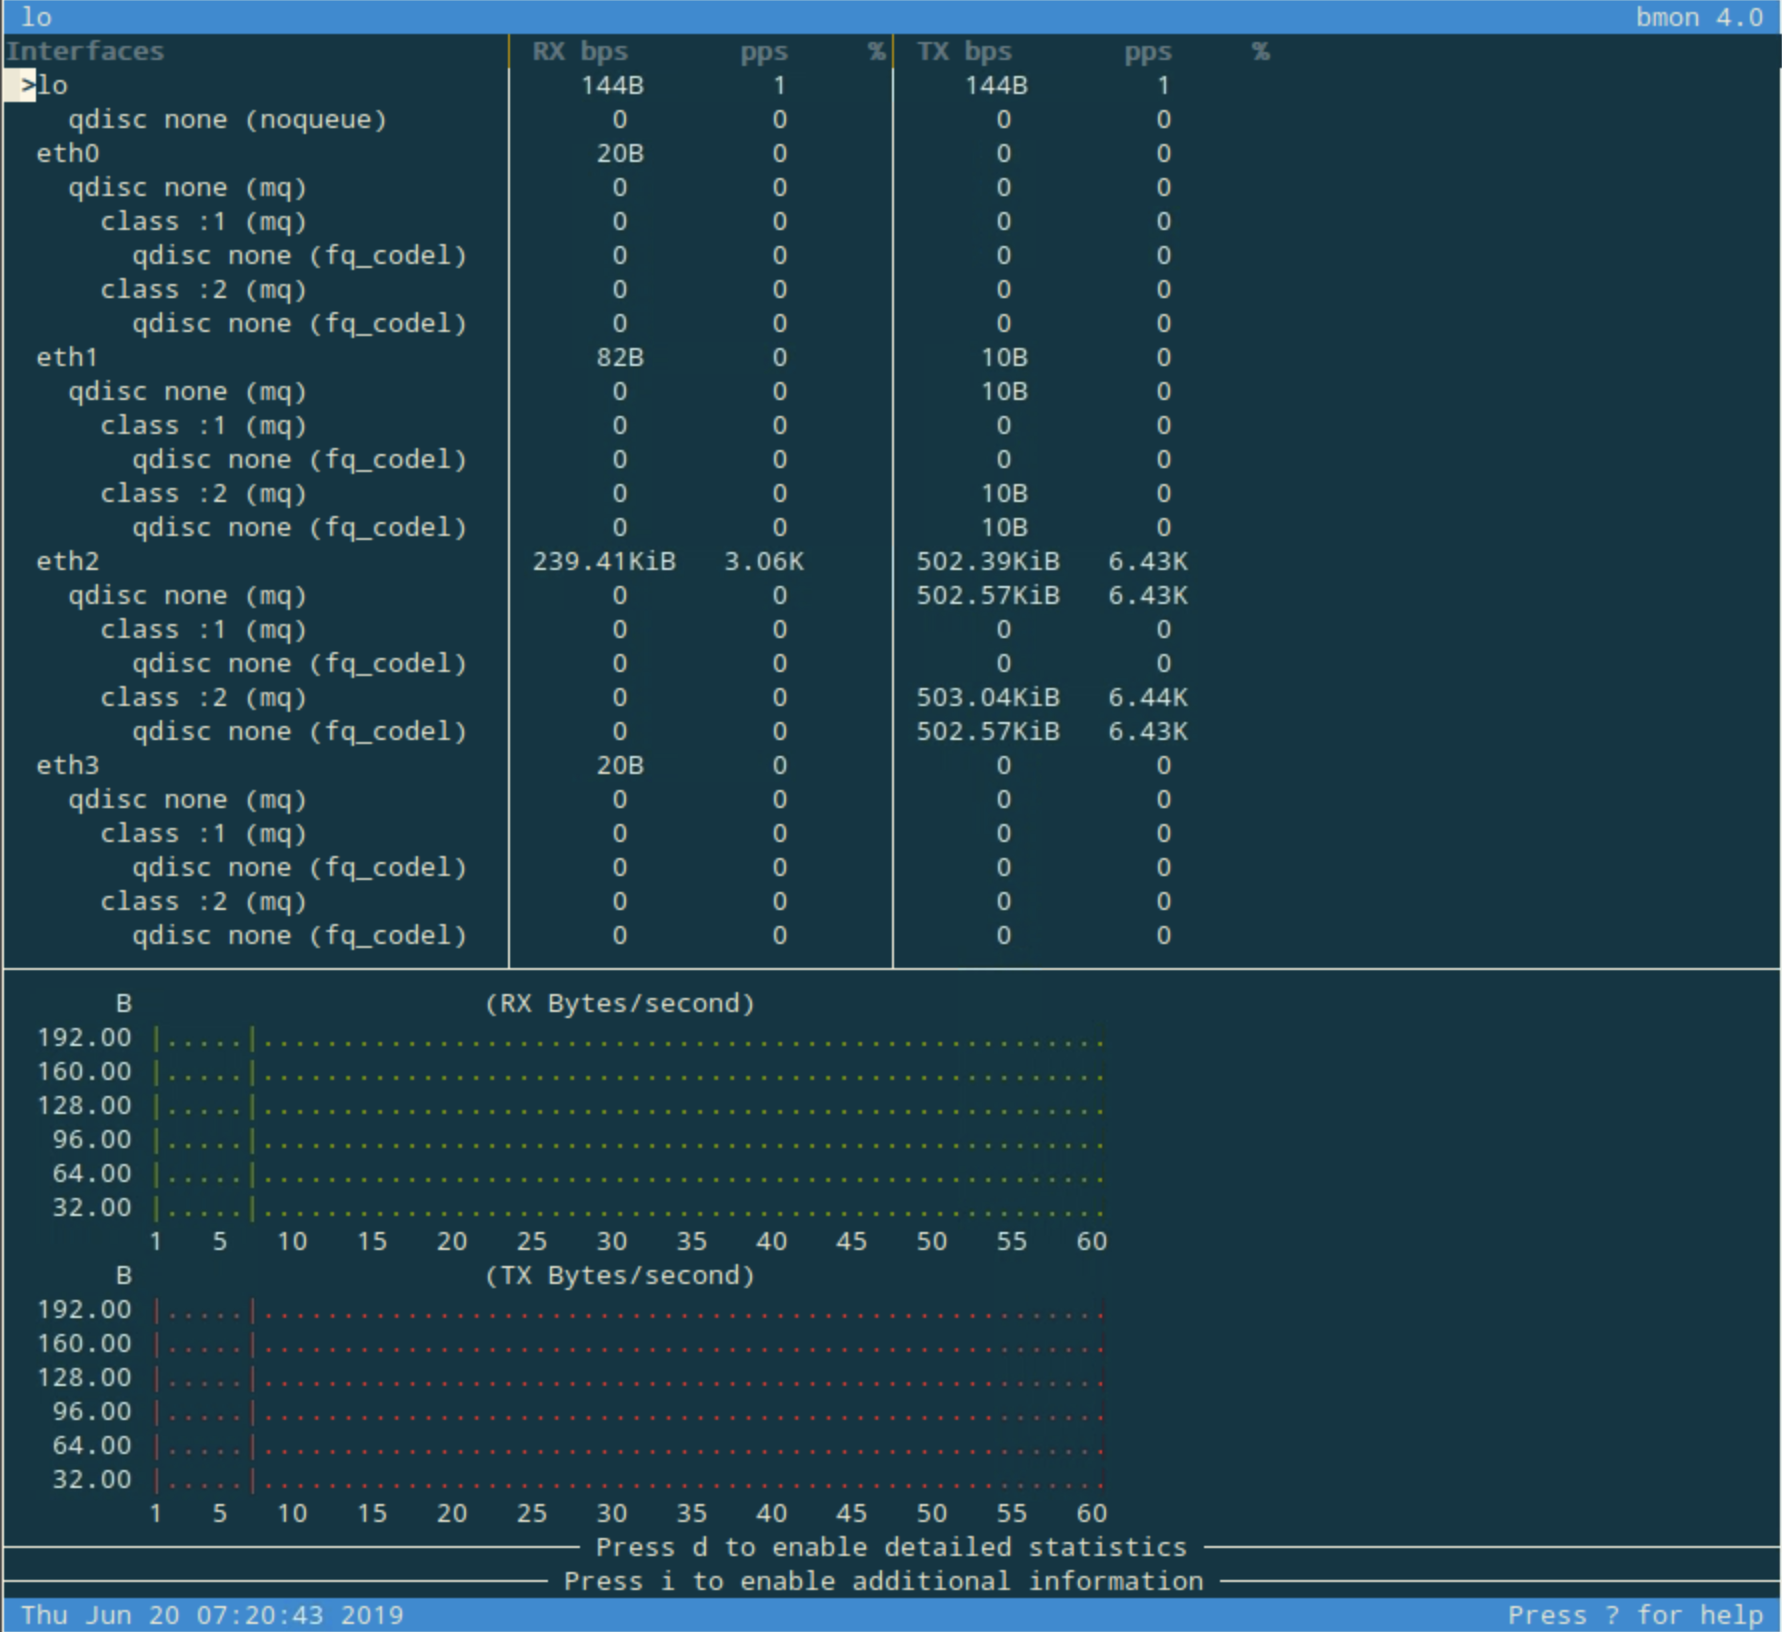
After launching bmon, it opens a window that looks like the one shown below. Use the down arrow to select the interface named eth2. Take note of the current state before traffic generator starts.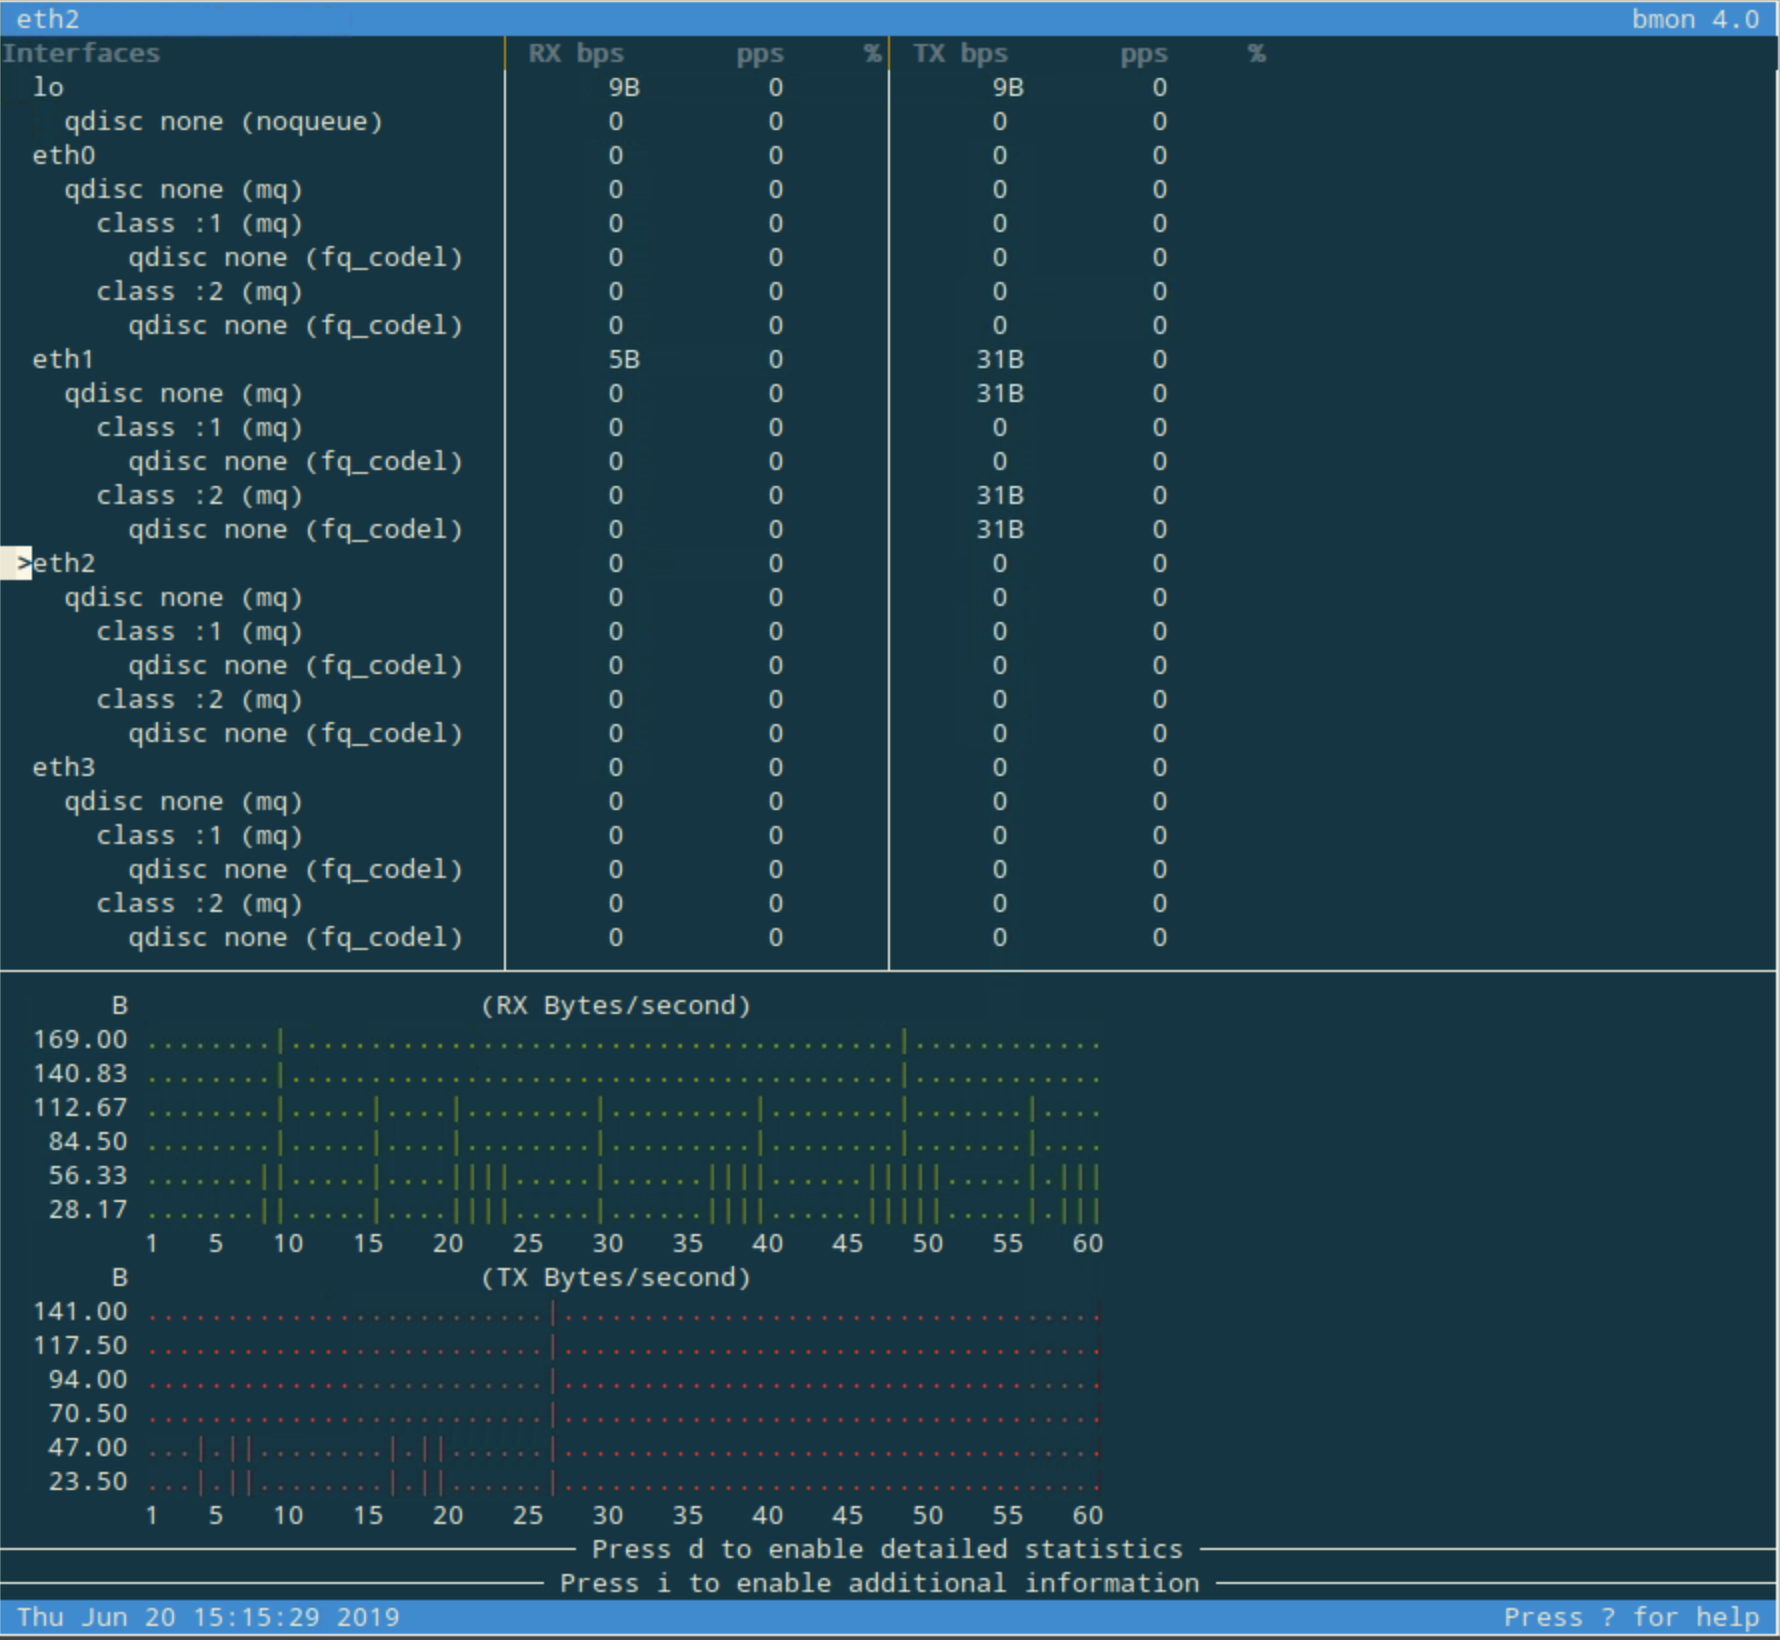
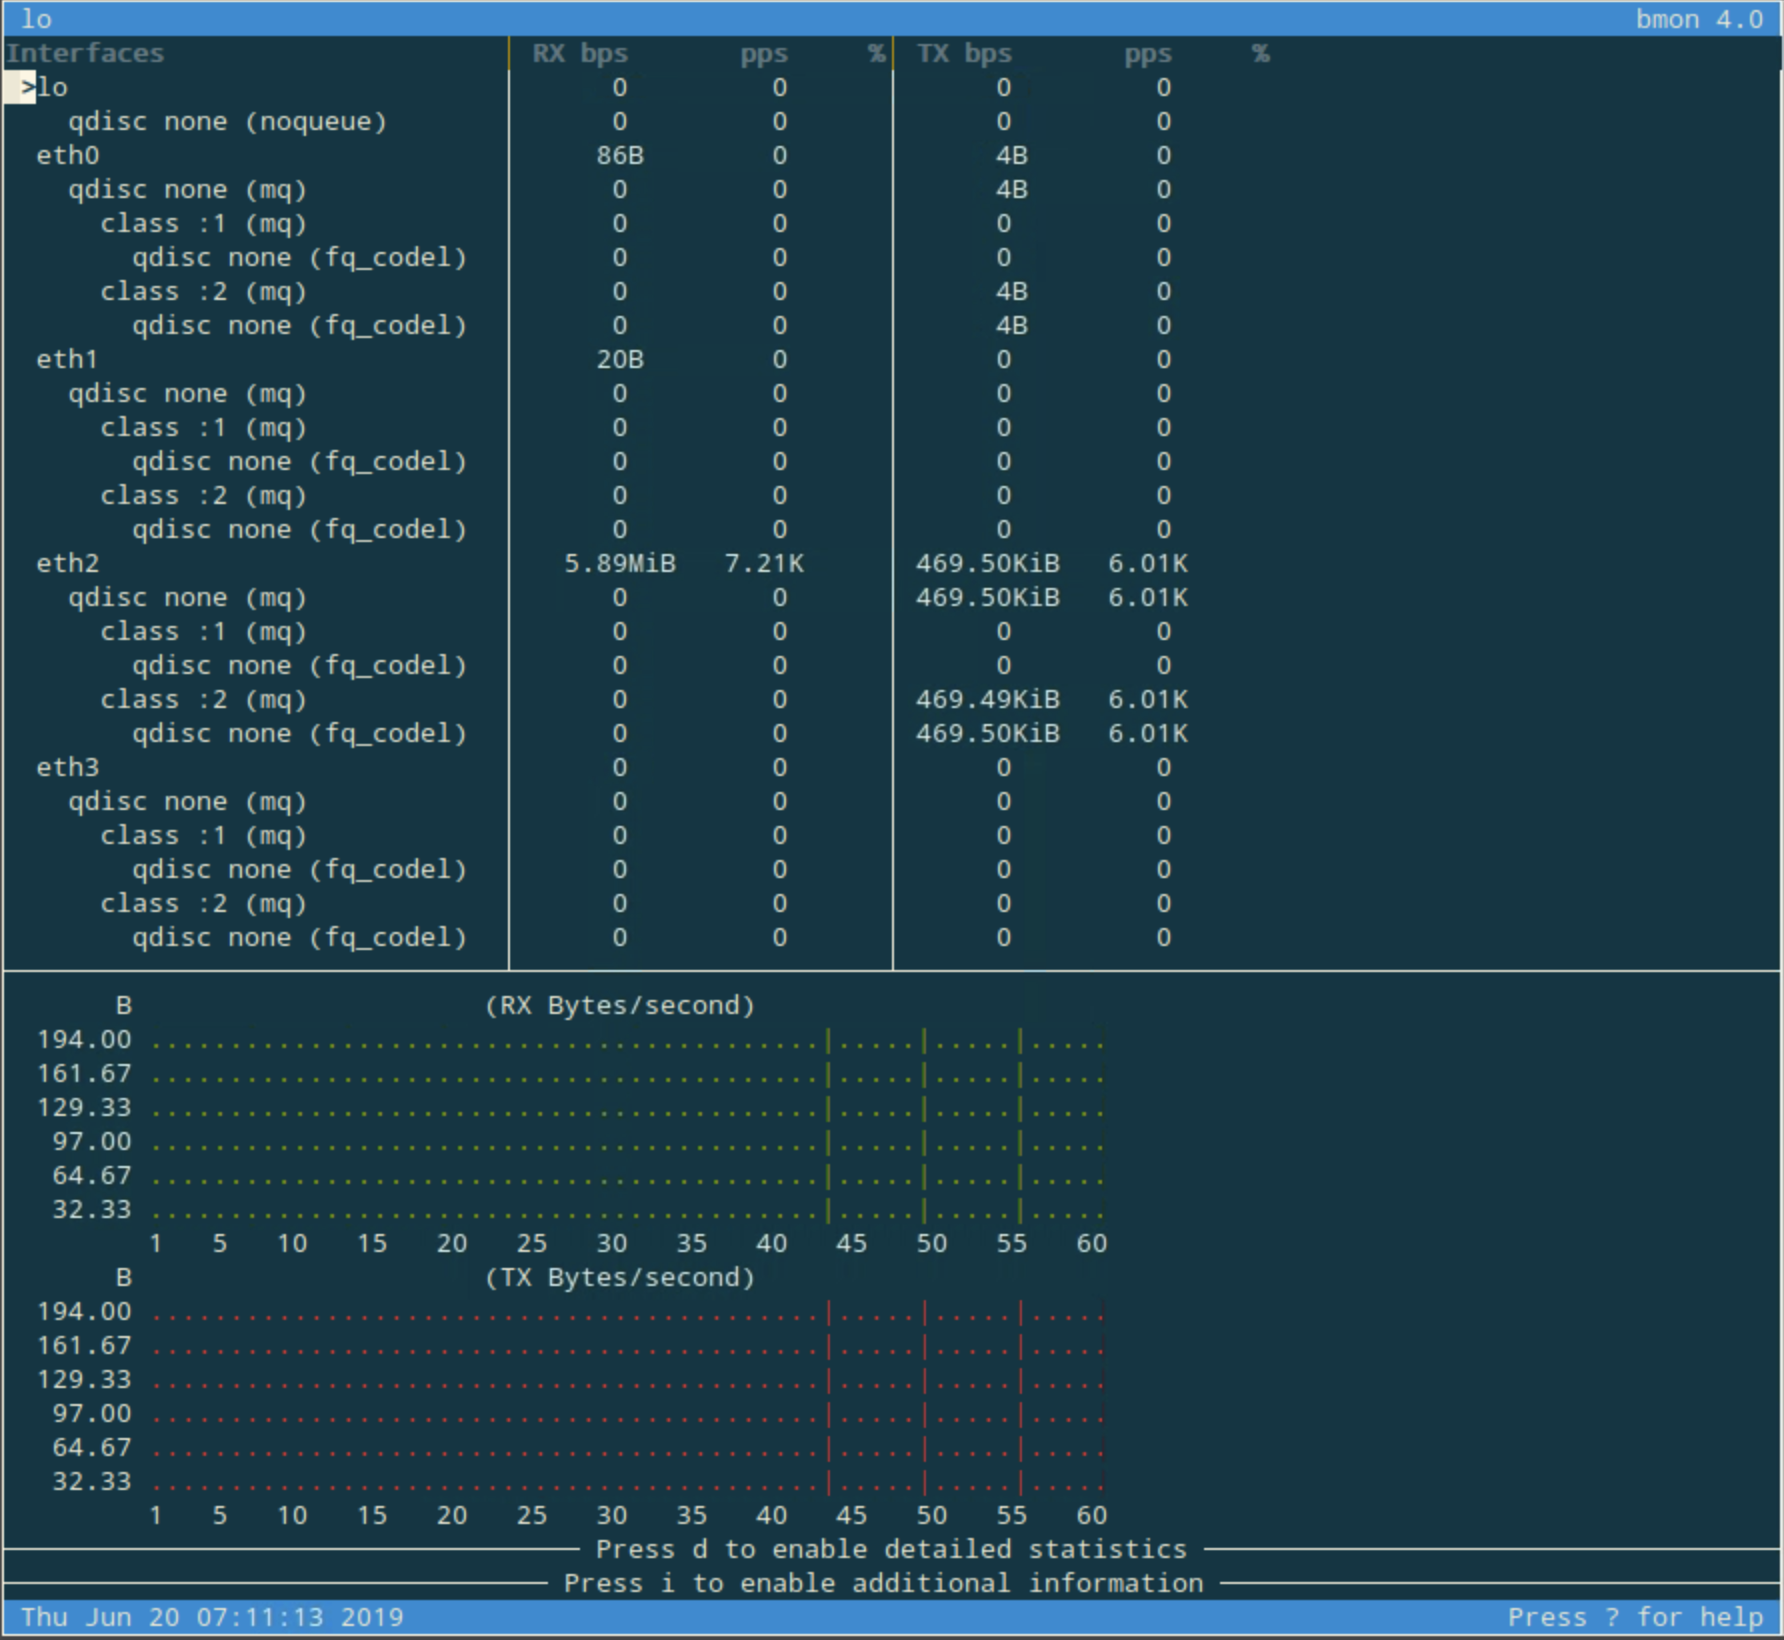
Open a terminal window, and type in the command queryperf-rrl to start traffic generation. Soon after starting the traffic generation, the bmon screen should reflect the amount of traffic seen on eth2, as shown below:
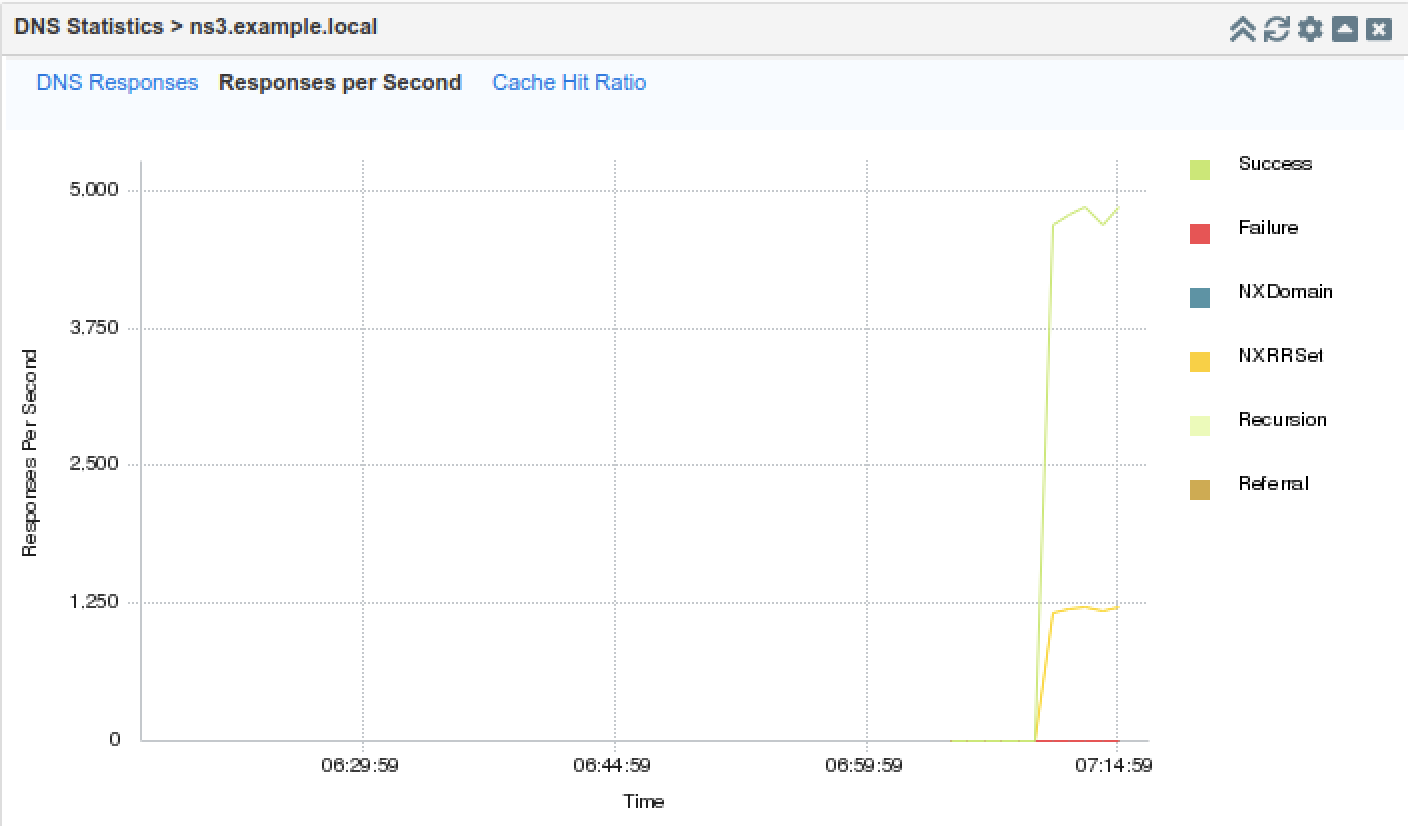
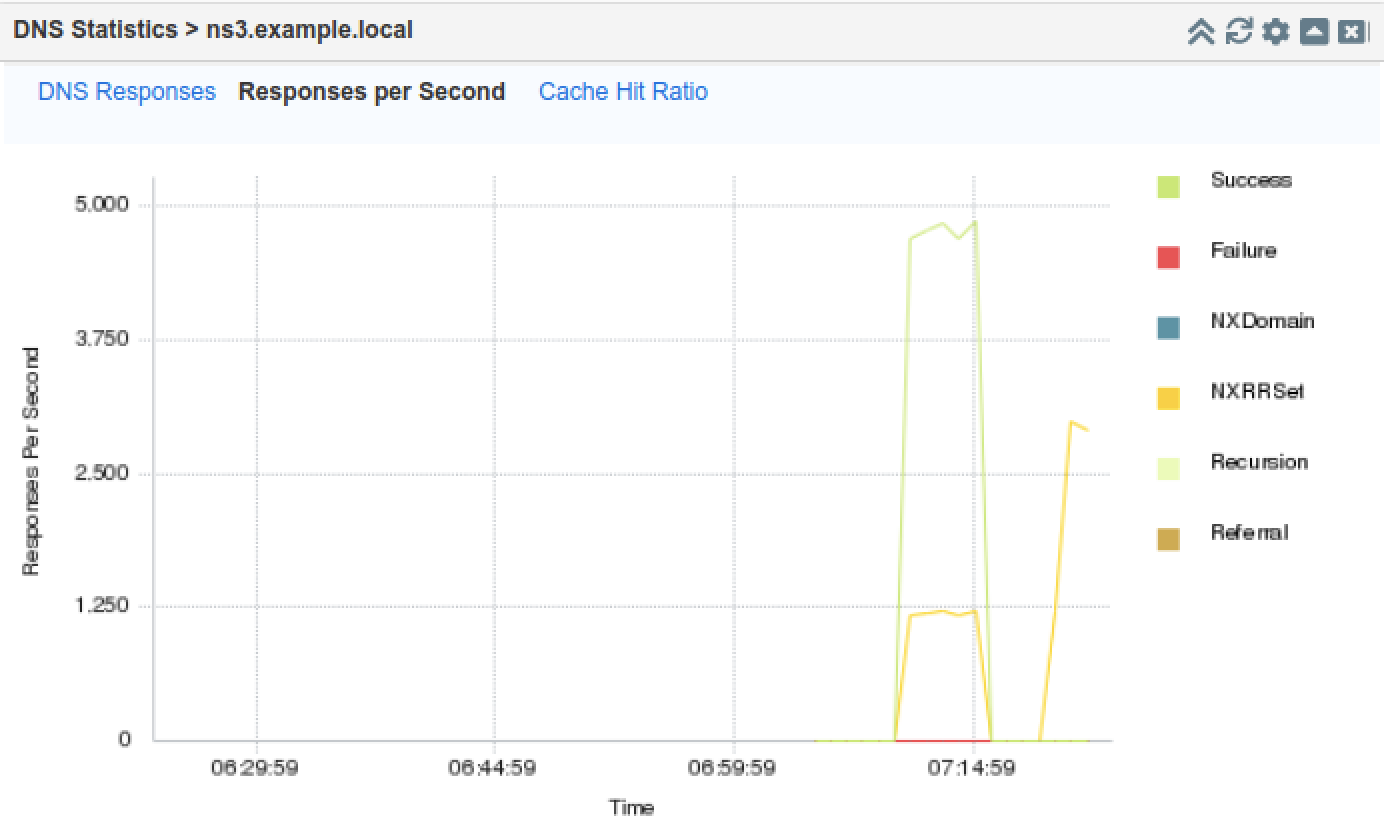
On the Jump-Desktop (10.35.22.10), access the web interface of NS3 (10.200.0.33), and navigate to the DNS Statistics widget. It may take a few minutes for the graphs to be updated, and when it does, the graph should look something like what is shown below. Notice the rise in NXRRSET, those are the queries that the name server received but couldn't answer, due to the excessive load. Unless query logging is enabled, no additional syslog messages are generated due to the increased query load on NS3.
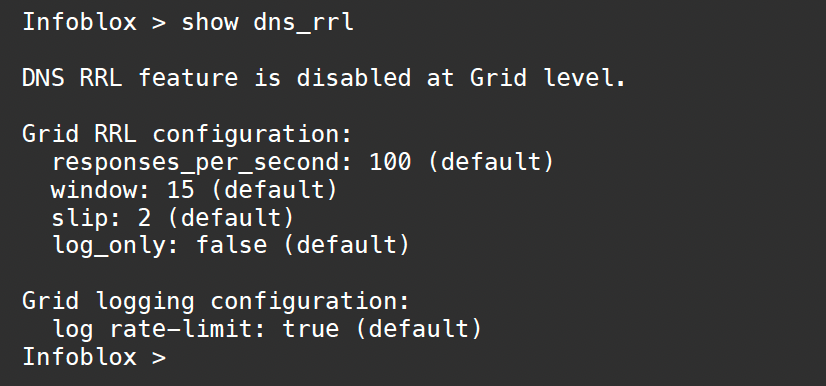
Open the nios-5 virtual machine, enter the command show dns_rrl as shown below. The default DNS RRL setting is disabled at the Grid level.
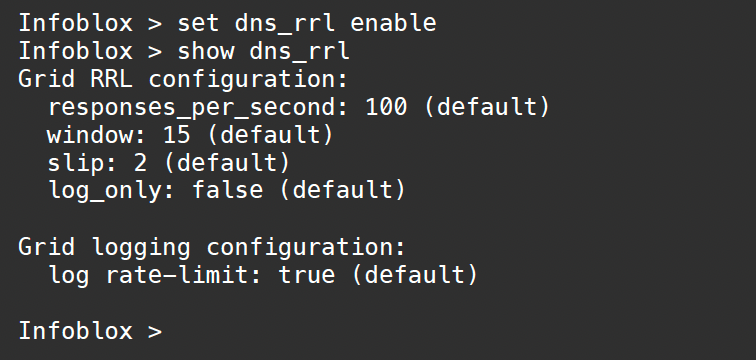
Enter the command set dns_rrl enable, followed by the command show dns_rrl, to enable RRL and see the enabled settings, as shown below:
Repeat the traffic generation step by executing the command queryperf-rrl on Linux Server again. Soon after executing the command we are able to see bmon showing different traffic pattern on eth2, as shown below. Because of the RRL setting on NS3, the response traffic is very limited.
On the Jump-Desktop (10.35.22.10), get back to the web interface for NS3, navigate to the DNS Statistics widget. Wait a few minutes, the graph should reflect the traffic pattern with RRL enabled, as shown below. Notice that the success queries are much smaller because they are subject to the RRL rules, and NXRRSET is much higher, also due to the RRL being enabled.
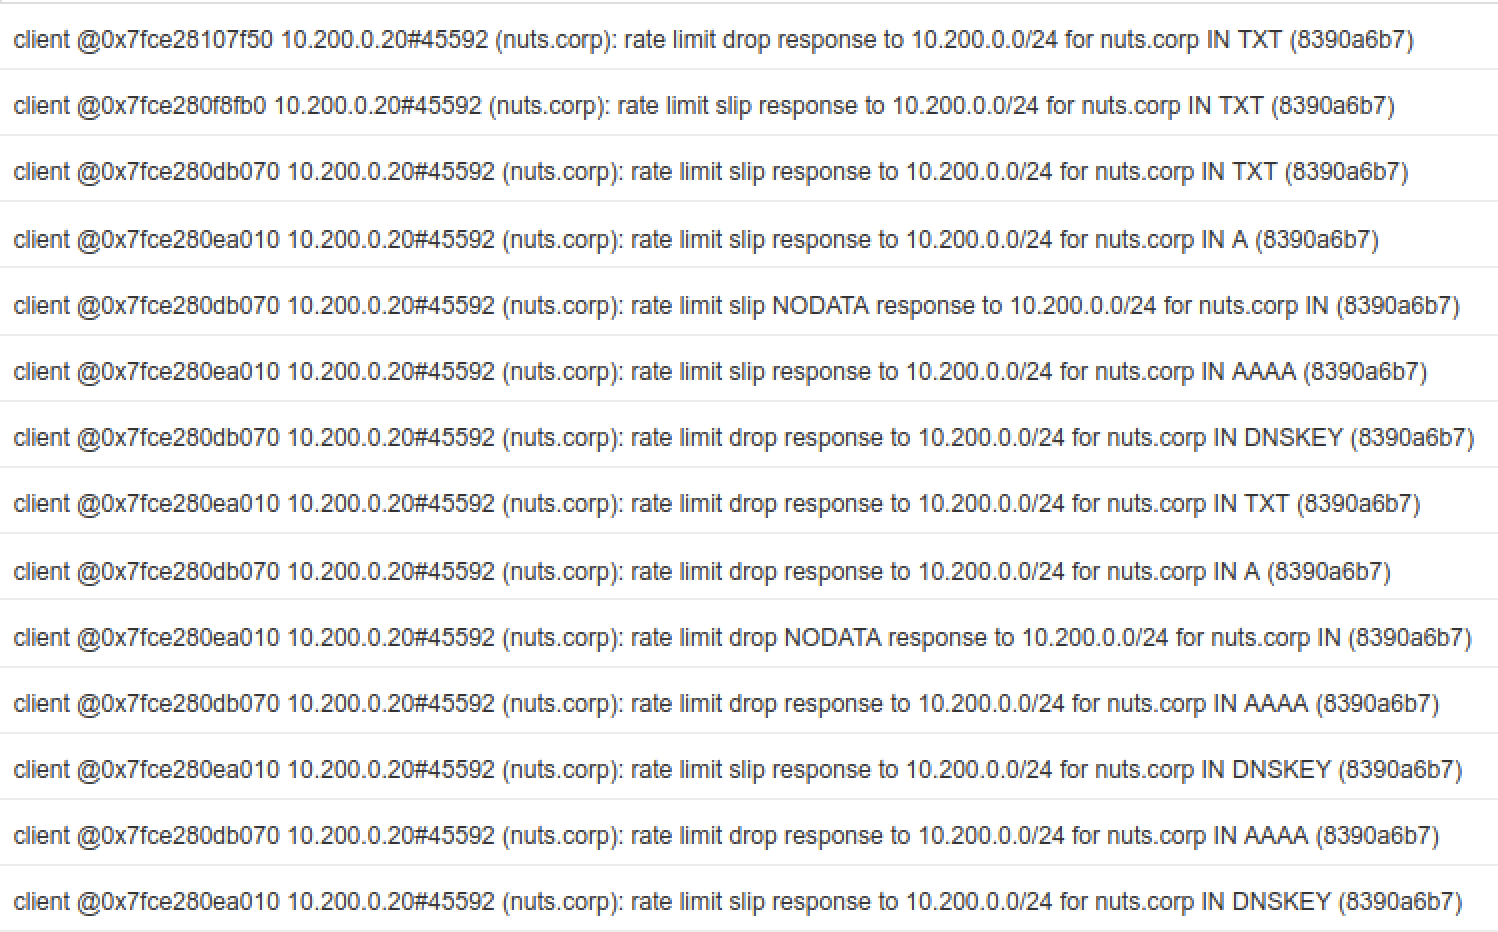
On NS3, navigate to Administration à Logs à Syslog, and we should see RRL drop messages as shown below: