
Scenario
Your organization has DNS Infrastructure Protection enabled on the Grid, with two rulesets (20250702-16 and 20251209-16) and a tuned profile (Authoritative - Tuned) applied to the external-facing Grid member extibns.techblue.net. A custom Rate-Limiting rule (rule ID 120201001) was previously created to manage traffic from a key customer's IP address, 203.0.113.254, limiting them to 100 queries per second to ensure continuous service without risking system overload.
Your organization has been using DNS Infrastructure Protection in production for a while. You have applied some tuned and customized configuration on the member enabled on the external-facing Grid member extibns.techblue.net.
Your monitoring tools detected that the customer's IP address 203.0.113.254 has begun generating DNS query traffic at an exccessive rate than what is allowed, a clear sign that the client machine may be misbehaving or compromised.
Your task is to investigate the incident, use the NIOS Security Dashboard to assess the Grid's current overall security health and identify the affected member, verify through syslog that your custom Rate-Limiting rule triggered correctly and took the expected action, and then leverage the Reporting Server's dashboards and reports to build a complete historical picture of the event, confirming which rules fired, which sources were involved, and whether the suspect IP triggered any other rules excessively or unexpectedly. Finally, you will export a summary dashboard as a PDF to present your findings to management.
Estimate Completion Time
-
120 minutes
Credentials
|
Description |
Username |
Password |
URL or IP |
|---|---|---|---|
|
Grid Manager UI |
admin |
infoblox |
Requirements
-
Administrative access to the Grid
-
Usage of the NIOS Lab Environment (with DNS Infrastructure Protection) Lab environment
Learning Content
Lab Initiation
Access jump-desktop
Once the lab is deployed, you can access the virtual machines required for this activity. To begin, select VM List from the navigation bar at the top, locate jump-desktop, and click the green play icon to open its console. Log in to the Linux UI.

Username: training
Password: infoblox
Initiate lab
To initiate the lab, double-click the Launch Lab icon on the Desktop.

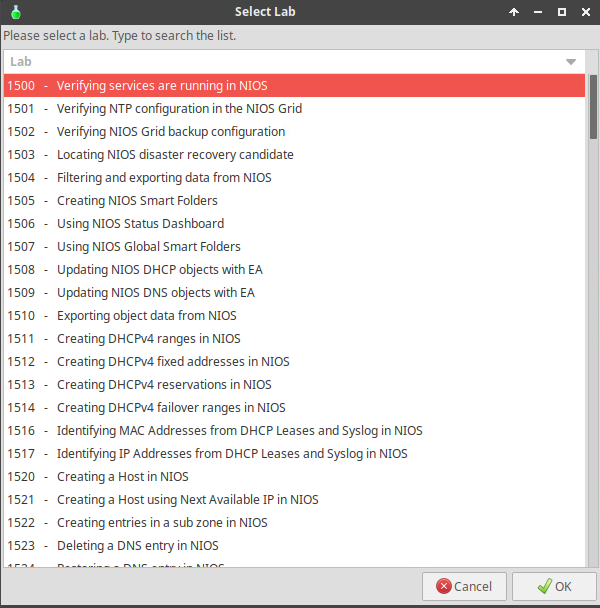
Choose the lab number from the list and click OK.
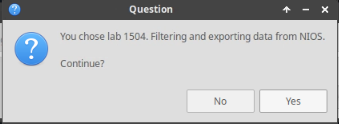
After clicking OK, you will see a pop-up message with a brief description of the lab task. If the description looks correct, click Yes to continue lab initiation.
Lab initiation will take a couple of minutes to finish.
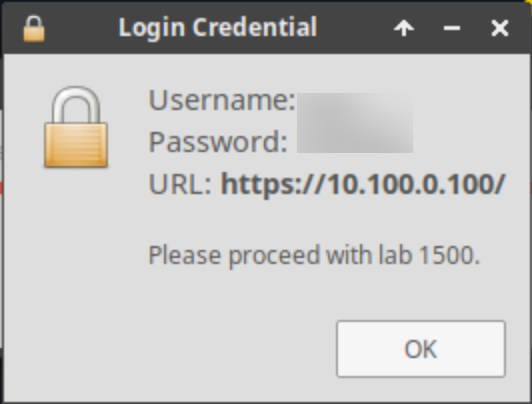
Once complete, you will see another pop-up message with the login credentials and the URL for the Grid Manager’s User Interface. Note that the credentials may differ from those from prior labs.
Tasks
-
Load DNS Infrastructure Protection License Files to the Grid and Verify Existing Configuration
-
Set up the Reporting Server
-
Simulate a Misbehaving/Infected Client
-
Analyze the Grid Status and Health using NIOS Security Dashboard
-
Investigate Action Taken and Matched Rule for the Recent Incident Using Syslog
-
Investigate Incident History using Reporting Server Dashboards and Reports
Task 1: Load DNS Infrastructure Protection License Files to the Grid and Verify Existing Configuration
Advanced DNS Protection (ADP) is an older name for the DNS Infrastructure Protection (DNS-IP) service; some system files still use the old name.
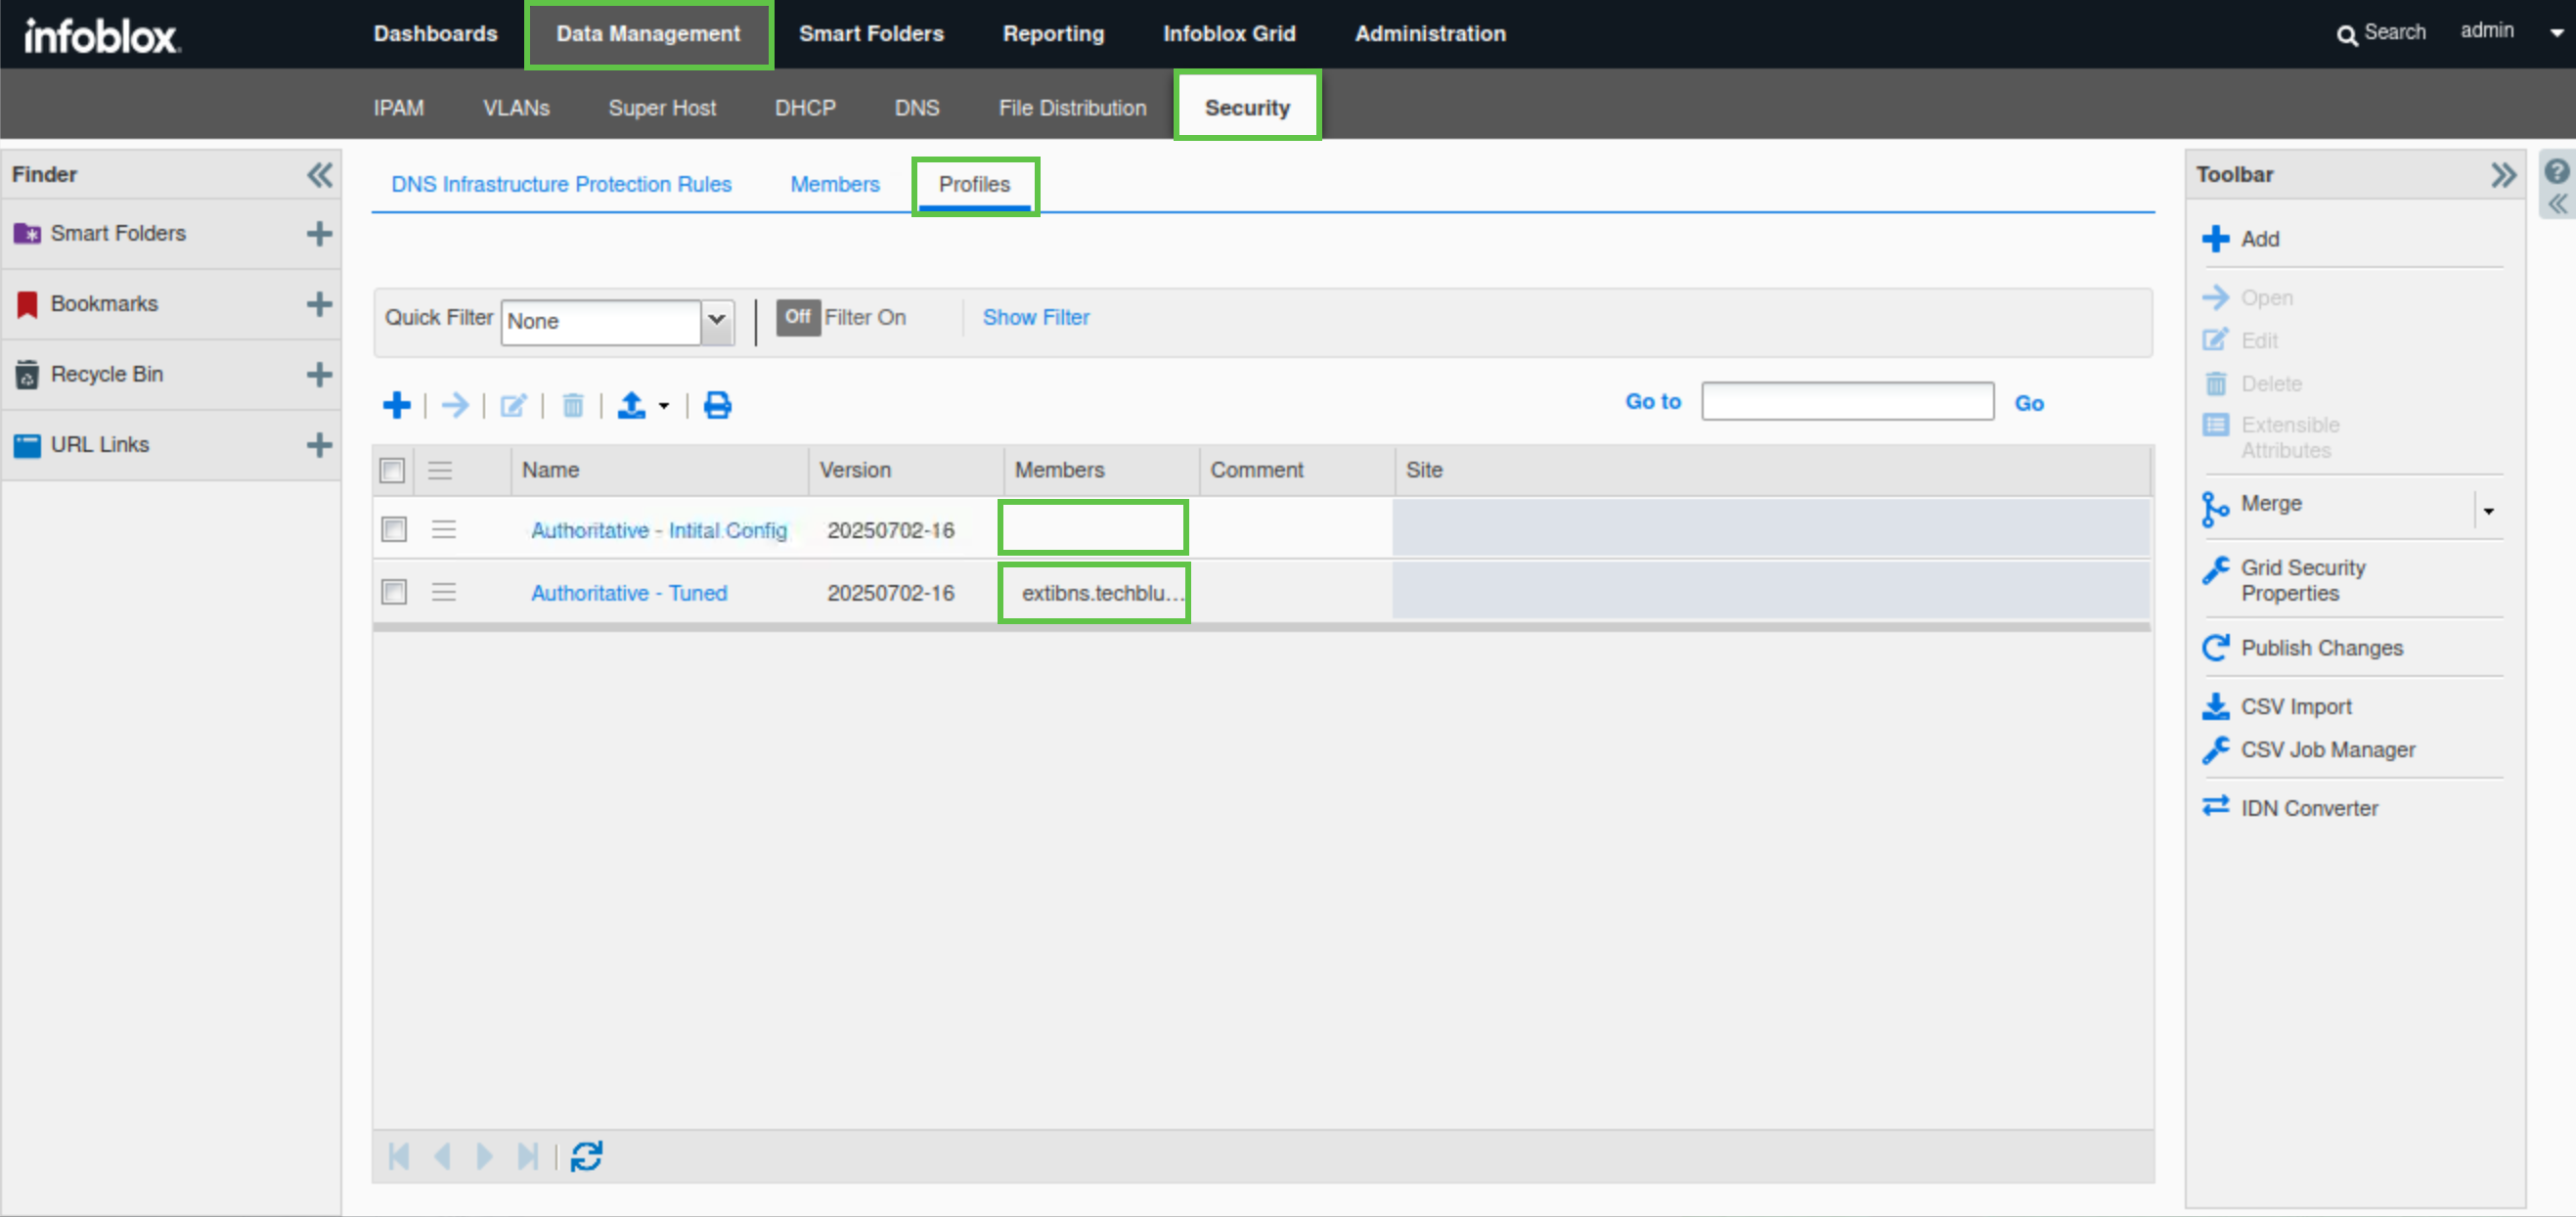
Load the DNS Infrastructure Protection license files to the Grid by navigating to Shared Drive/Licenses. Select the ADP.lic file. Verify the Grid was configured in previous labs to include two rulesets (20250702-16 and 20251209-16), and one untuned initial profile (Authoritative - Initial Config) not used currently by any grid member and a second tuned profile (Authoritative - Tuned) used by extibns.techblue.net. This task is only necessary due to lab environment limitations.
Task 2: Set up the Reporting Server
Set up the Reporting Server with the following information:
|
Configuration |
Value |
|
Username |
training |
|
Password |
infoblox |
|
Protocol |
SCP |
|
Host/ IP Address |
10.100.0.205 |
|
Port |
22 |
|
Path |
/home/training/Documents/ReportingData |
Task 3: Simulate a Misbehaving/Infected Client
It can take up to 10 minutes for extibns.techblue.net, to boot up with the DNS Infrastructure Protection service enabled.
Use the queryperf tool on the support-server VM to send DNS queries to the extibns.techblue.net DNS server with the DNS-IP service enabled. We want to trigger a custom Rate-Limiting rule is set to 100 queries per second. Use a query rate of 200.
Use the bmon tool on the support-server VM to monitor traffic on the eth2 interface, as it is connected to the 203.0.113.0 network.
Task 4: Analyze the Grid Status and Health using NIOS Security Dashboard
Use the NIOS Security Dashboard to analyze the Security Status for Grid, Security Status for all Members, and DNS Infrastructure Protection status widgets, identify which member is affected by the recent incedent, and examine the event severity, top rules, clients, and events over time for the incident.
Task 5: Investigate Action Taken and Matched Rule for the Recent Incident Using Syslog
Use the syslog viewer to display Threat Detection Event Logs, filter entries for the client IP address 203.0.113.254, and find the rule ID that the traffic has triggered.
Task 6: Investigate Incident History using Reporting Server Dashboards and Reports
It can take up to 15 minutes for the Reporting Server to pull data from the Grid and populate its dashboards and reports. This delay applies only to this simulated lab environment because the Grid and Reporting Server haven't had enough time to sync.
Use the Reporting Server’s DNS Infrastructure Protection reports (Event Count by member, Event Count by category, Event Count by rule, and Top Rules Logged by Source) and the DNS Infrastructure Protection Event Count dashboard to review historical DNS-IP activity for the Grid, correlate events for rule (Rule ID identified in the previous task) and source IP 203.0.113.254, and export the summary dashboard as a PDF.
Solutions
Task 1 Solution: Load DNS Infrastructure Protection License Files to the Grid and Verify Existing Configuration
In this task, we will reload the DNS Infrastructure Protection license on the Grid due to limitations in the lab environment. There should be two licenses bundled into the file. The first “DNS Infrastructure Protection” license enables the service on the Grid, while the second “DNS Infrastructure Protection Update” license allows the Grid to download and install the latest rule sets.
We will then verify that the Grid was configured in previous labs to include two rulesets: 20250702-16, the active ruleset, and 20251209-16, and an untuned profile (Authoritative - Initial Config) not used currently by any grid member and a second tuned profile (Authoritative - Tuned) used by the Grid member extibns.techblue.net. This task is only necessary due to lab environment limitations.
-
On the jump-desktop machine, open a browser window to https://10.100.0.100.
-
Navigate to Infoblox Grid → Licenses → Members.
-
Click the plus (+) symbol to add a new license.
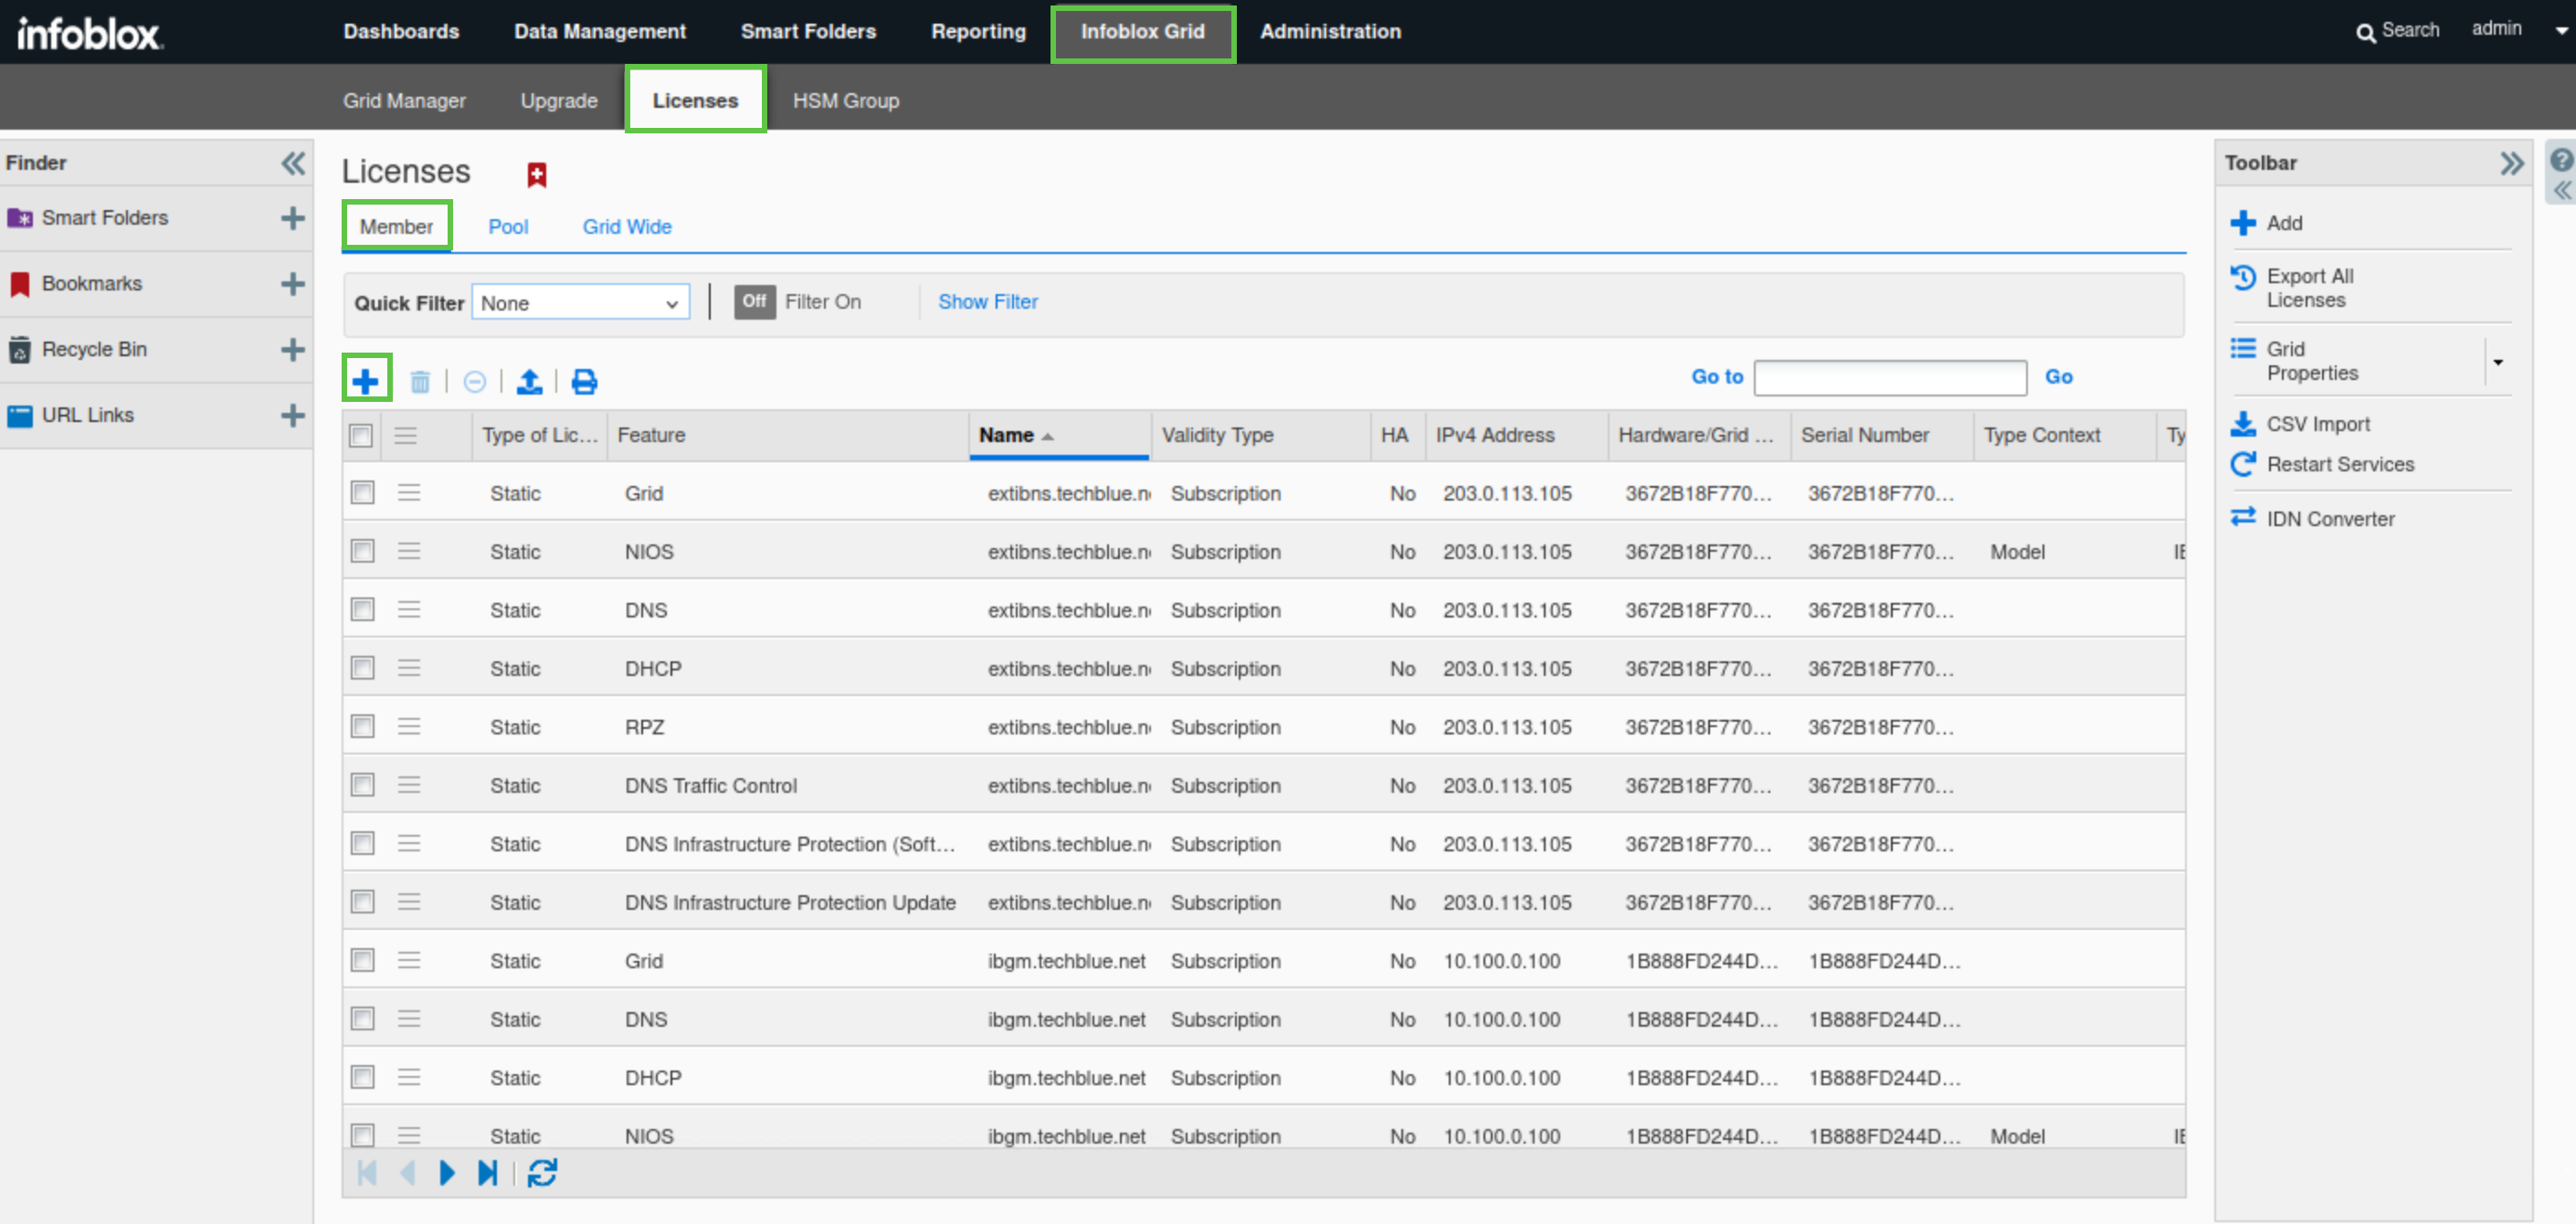
-
Click Select File to upload the license file.
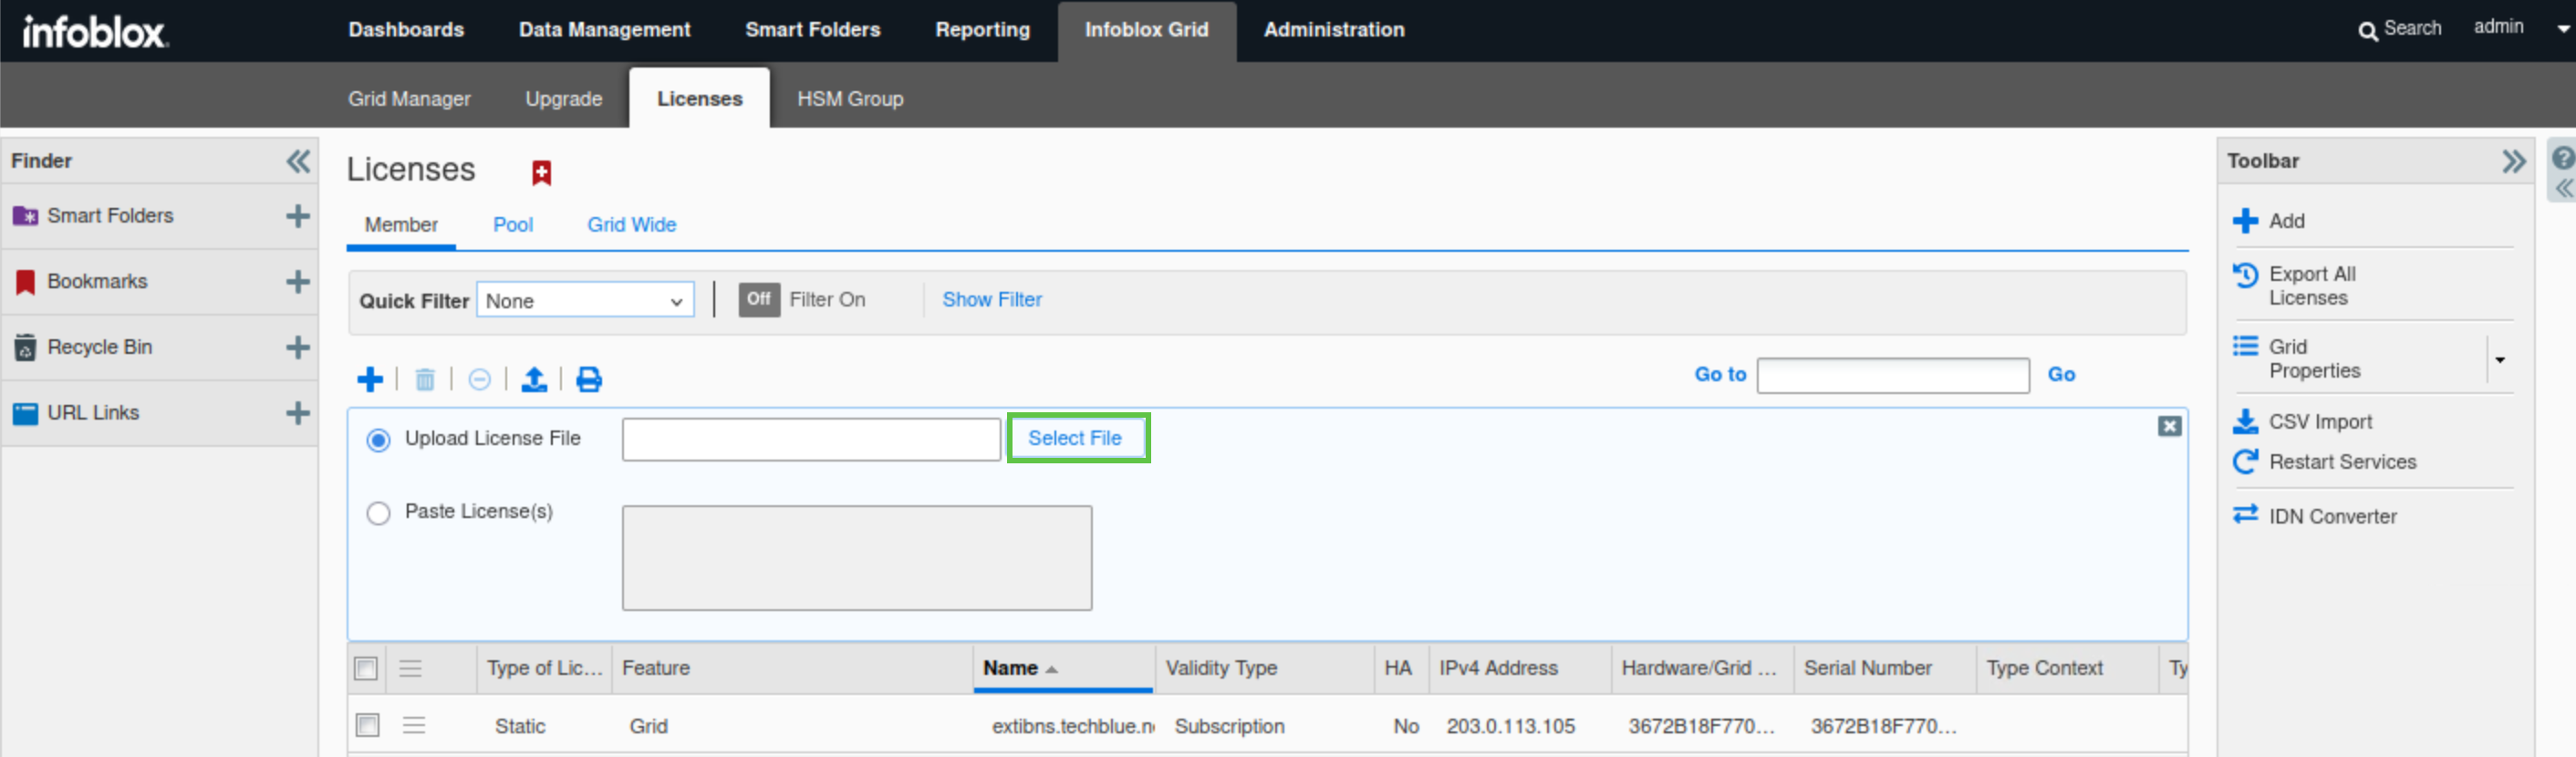
-
Navigate to
Shared Drive/Licenses/9.0. -
Select the ADP.lic file and click Open.
-
Advanced DNS Protection (ADP) is an older name for the DNS Infrastructure Protection (DNS-IP) service; some system files still use the old name.
-
-
Click Verify License(s), then Save All Valid Licenses.
-
After the licenses are added, two new DNS Infrastructure Protection licenses will be listed. The first “DNS Infrastructure Protection” license enables the service on the Grid, while the second “DNS Infrastructure Protection Update” license allows the Grid to download and install the latest rule sets.
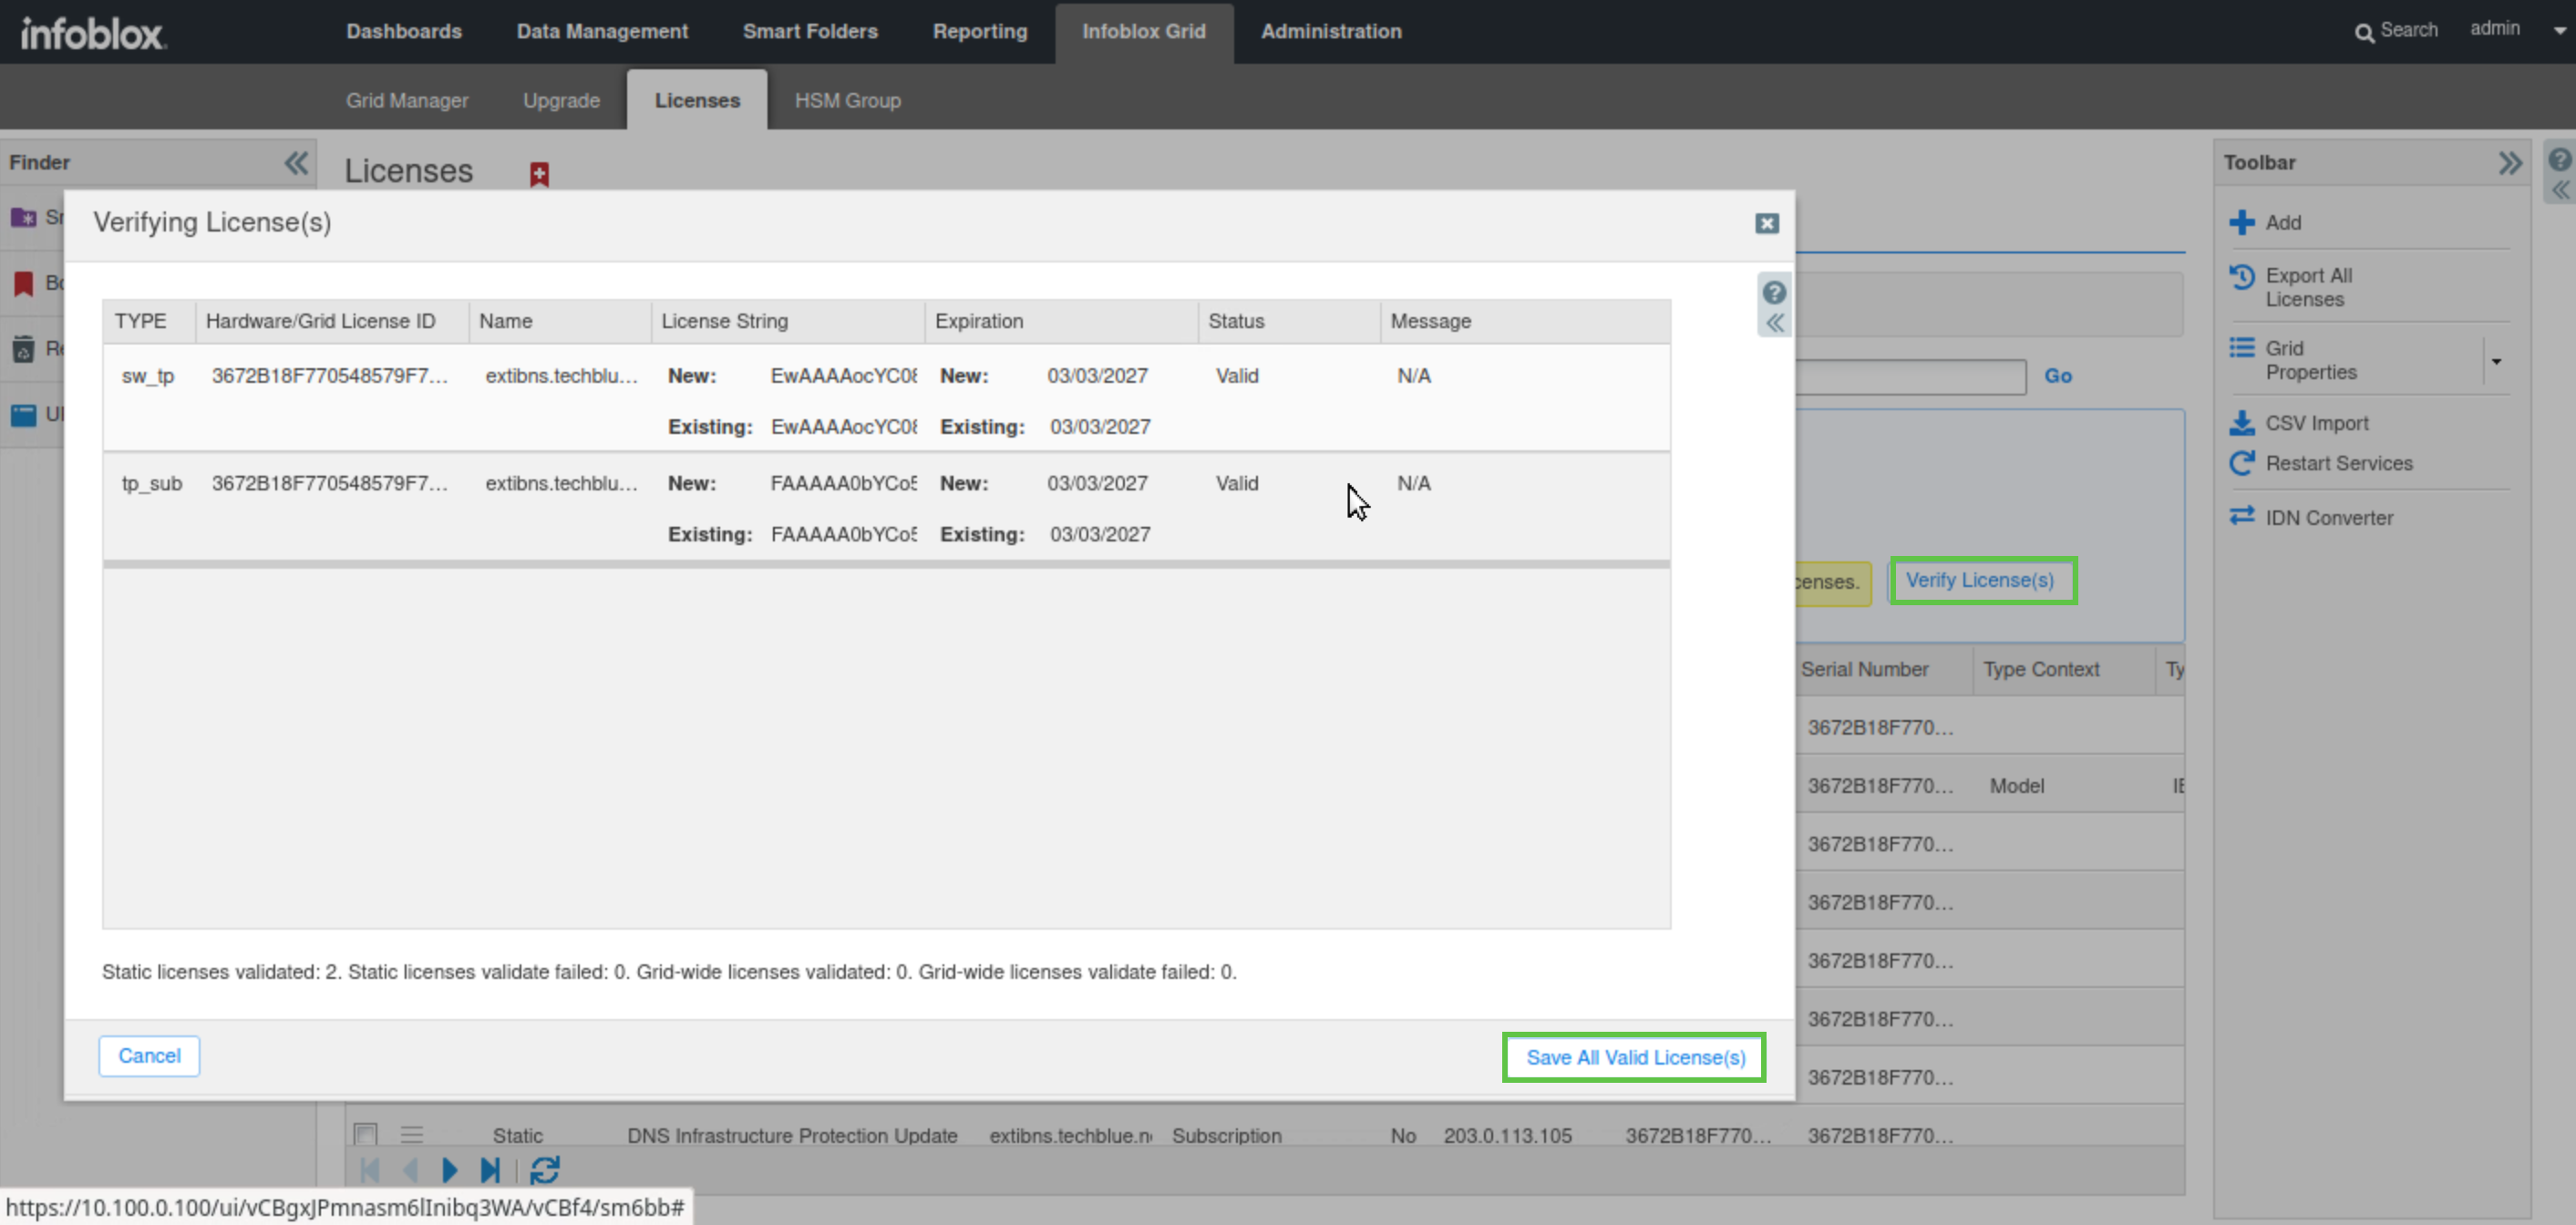
-
-
Navigate to Data Management → Security → DNS Infrastructure Protection Rules.
-
Two rulesets will be listed. The first is 20250702-16, the active ruleset highlighted in green, and the second is 20251209-16.
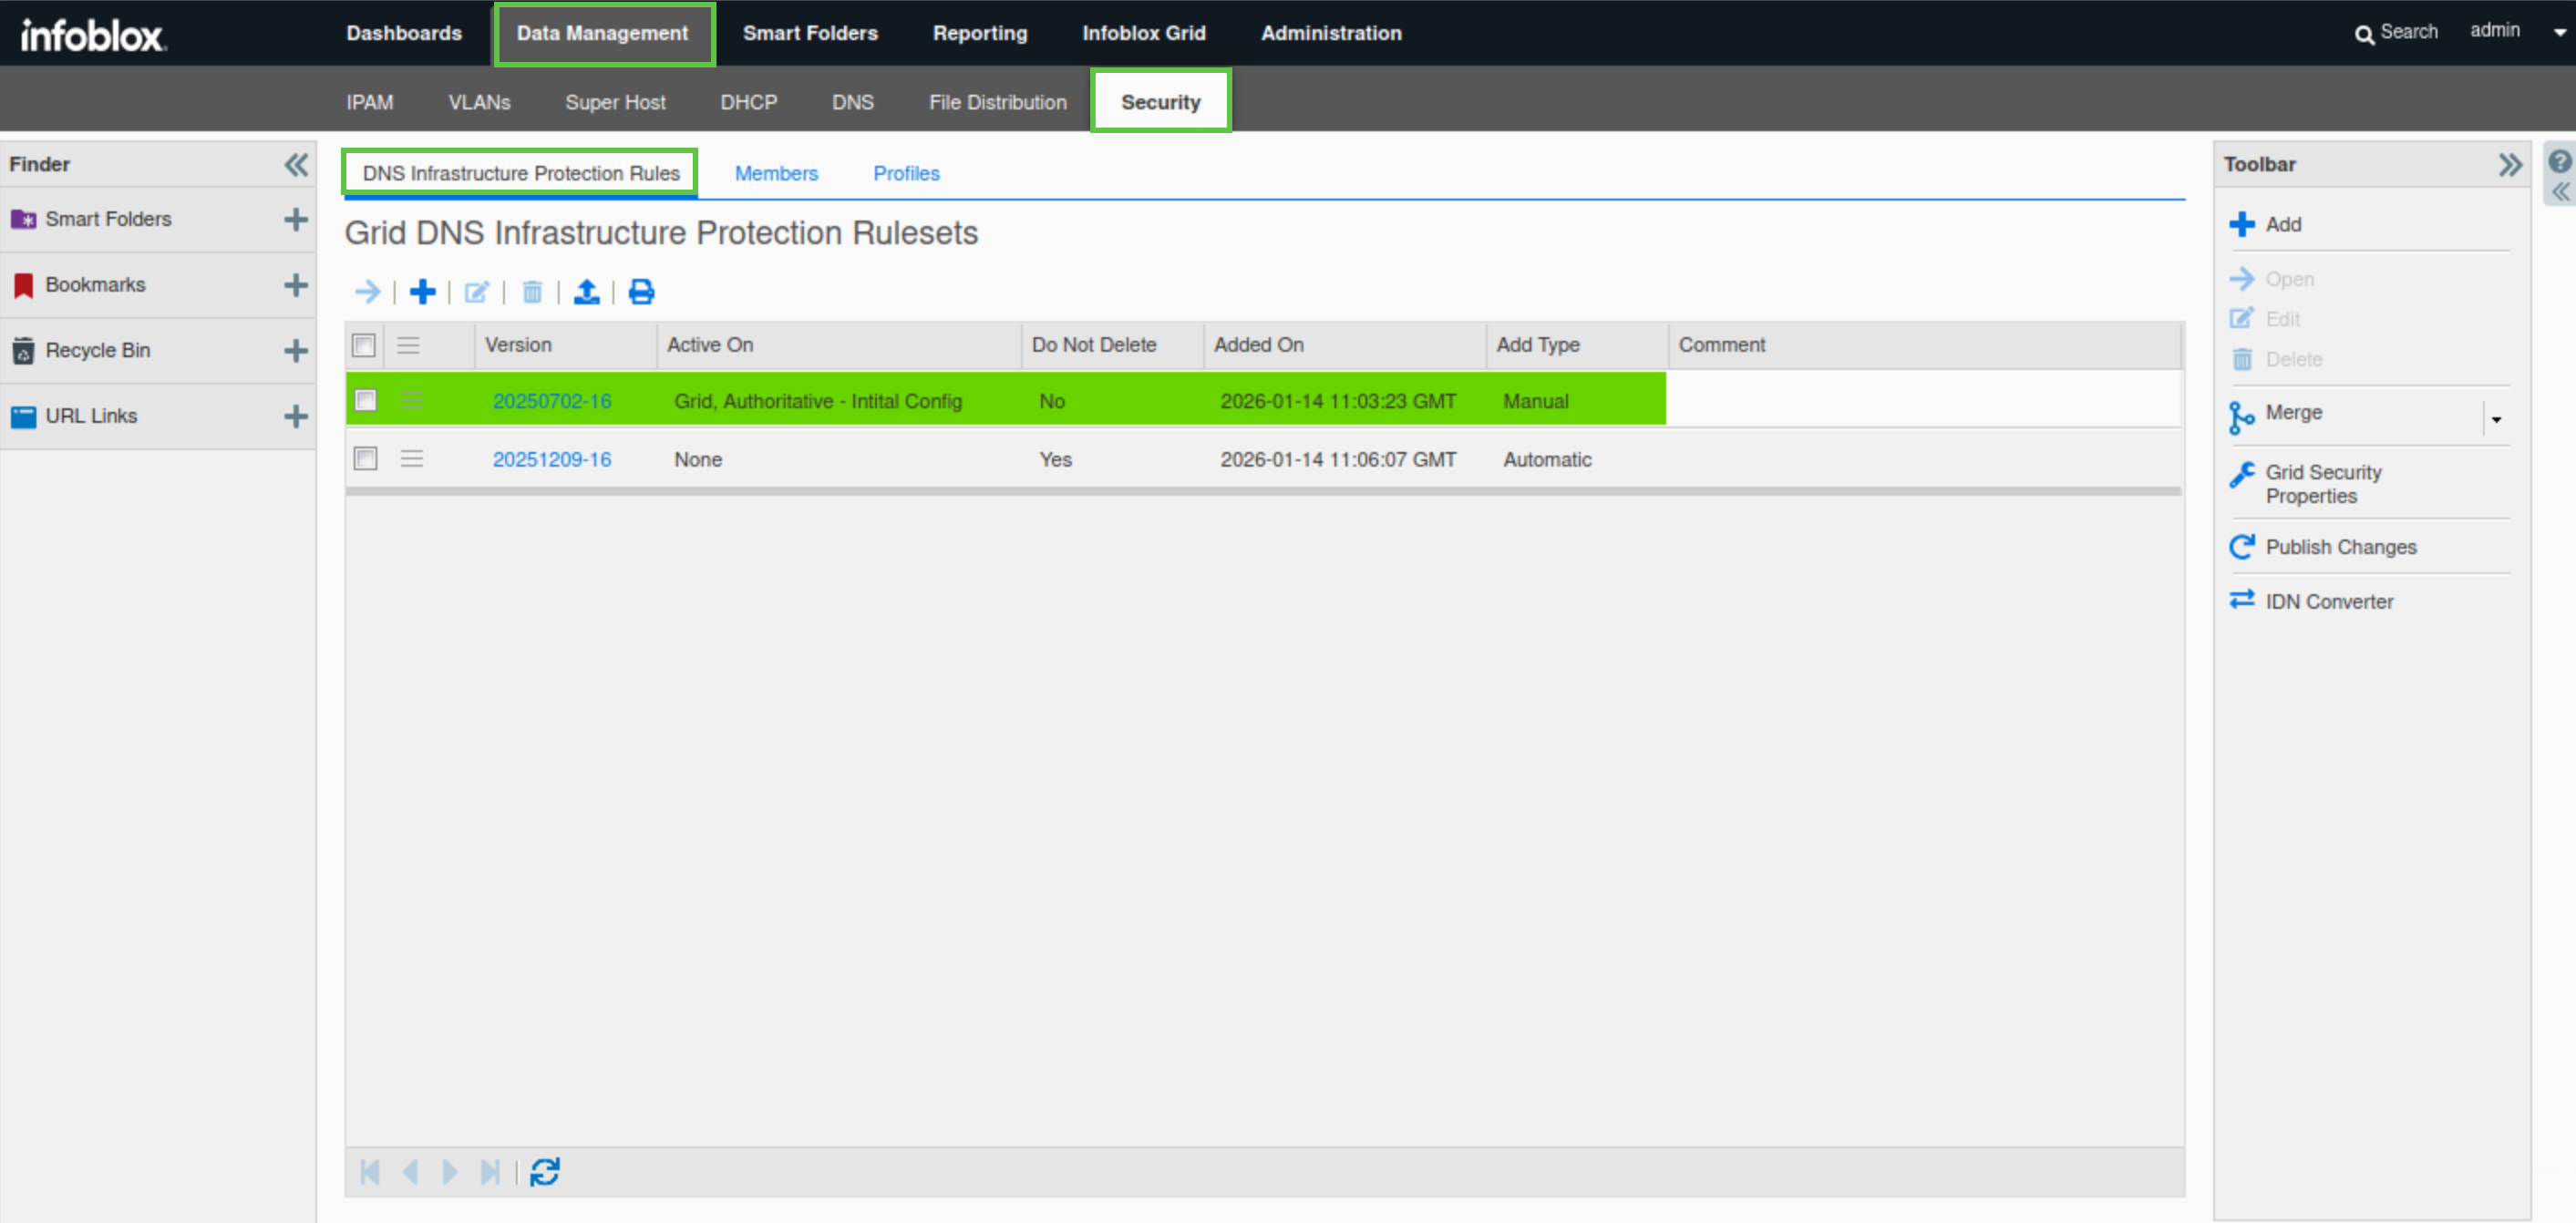
-
-
Navigate to Data Management → Security → Profiles
-
Two profiles will be listed, an untuned profile Authoritative - Initial Config not used by any Grid member and a tuned profile Authoritative - Tuned used by the Grid member extibns.techblue.net.
-
Task 2 Solution: Set up the Reporting Server
In this task, we will set up the Grid’s Reporting Server so we can view and analyse its DNS Infrastructure Protection dashboards and reports in later steps. These reports will be used to help us identify and trace the misbehaving client.
-
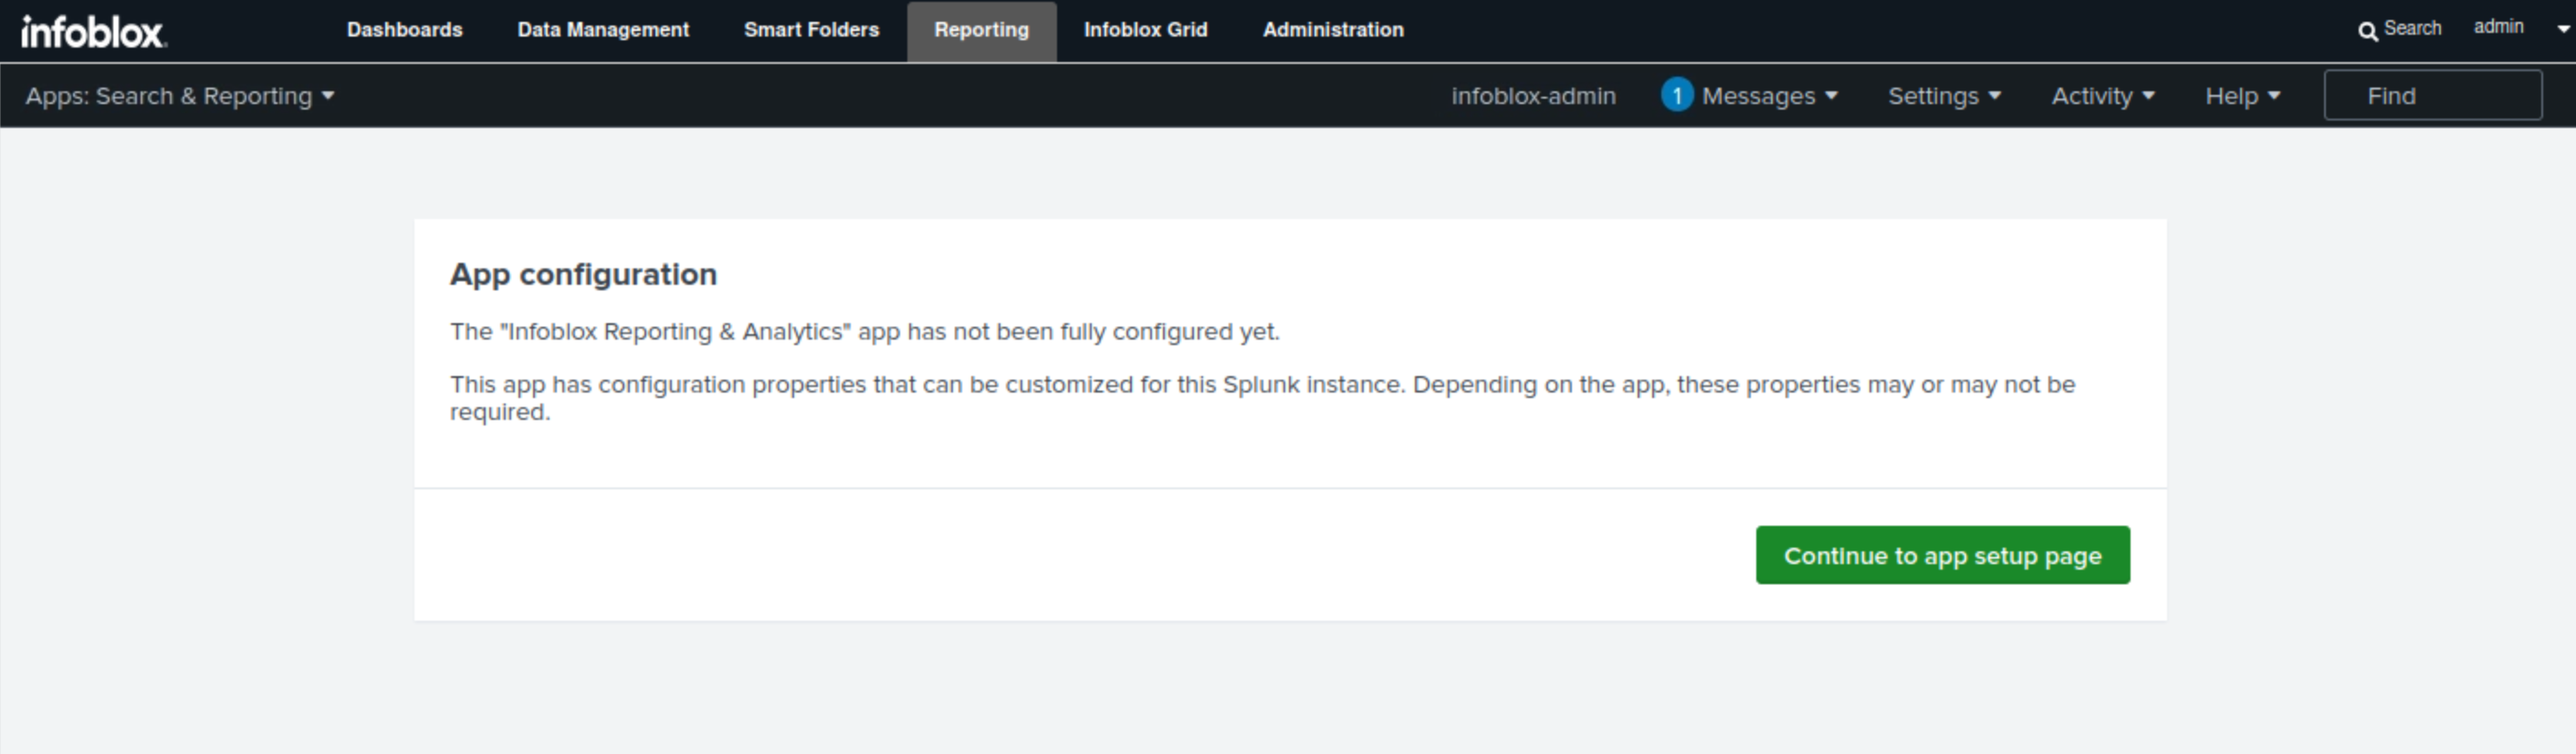
Navigate to Reporting
-
Click Continue to app setup page.
-
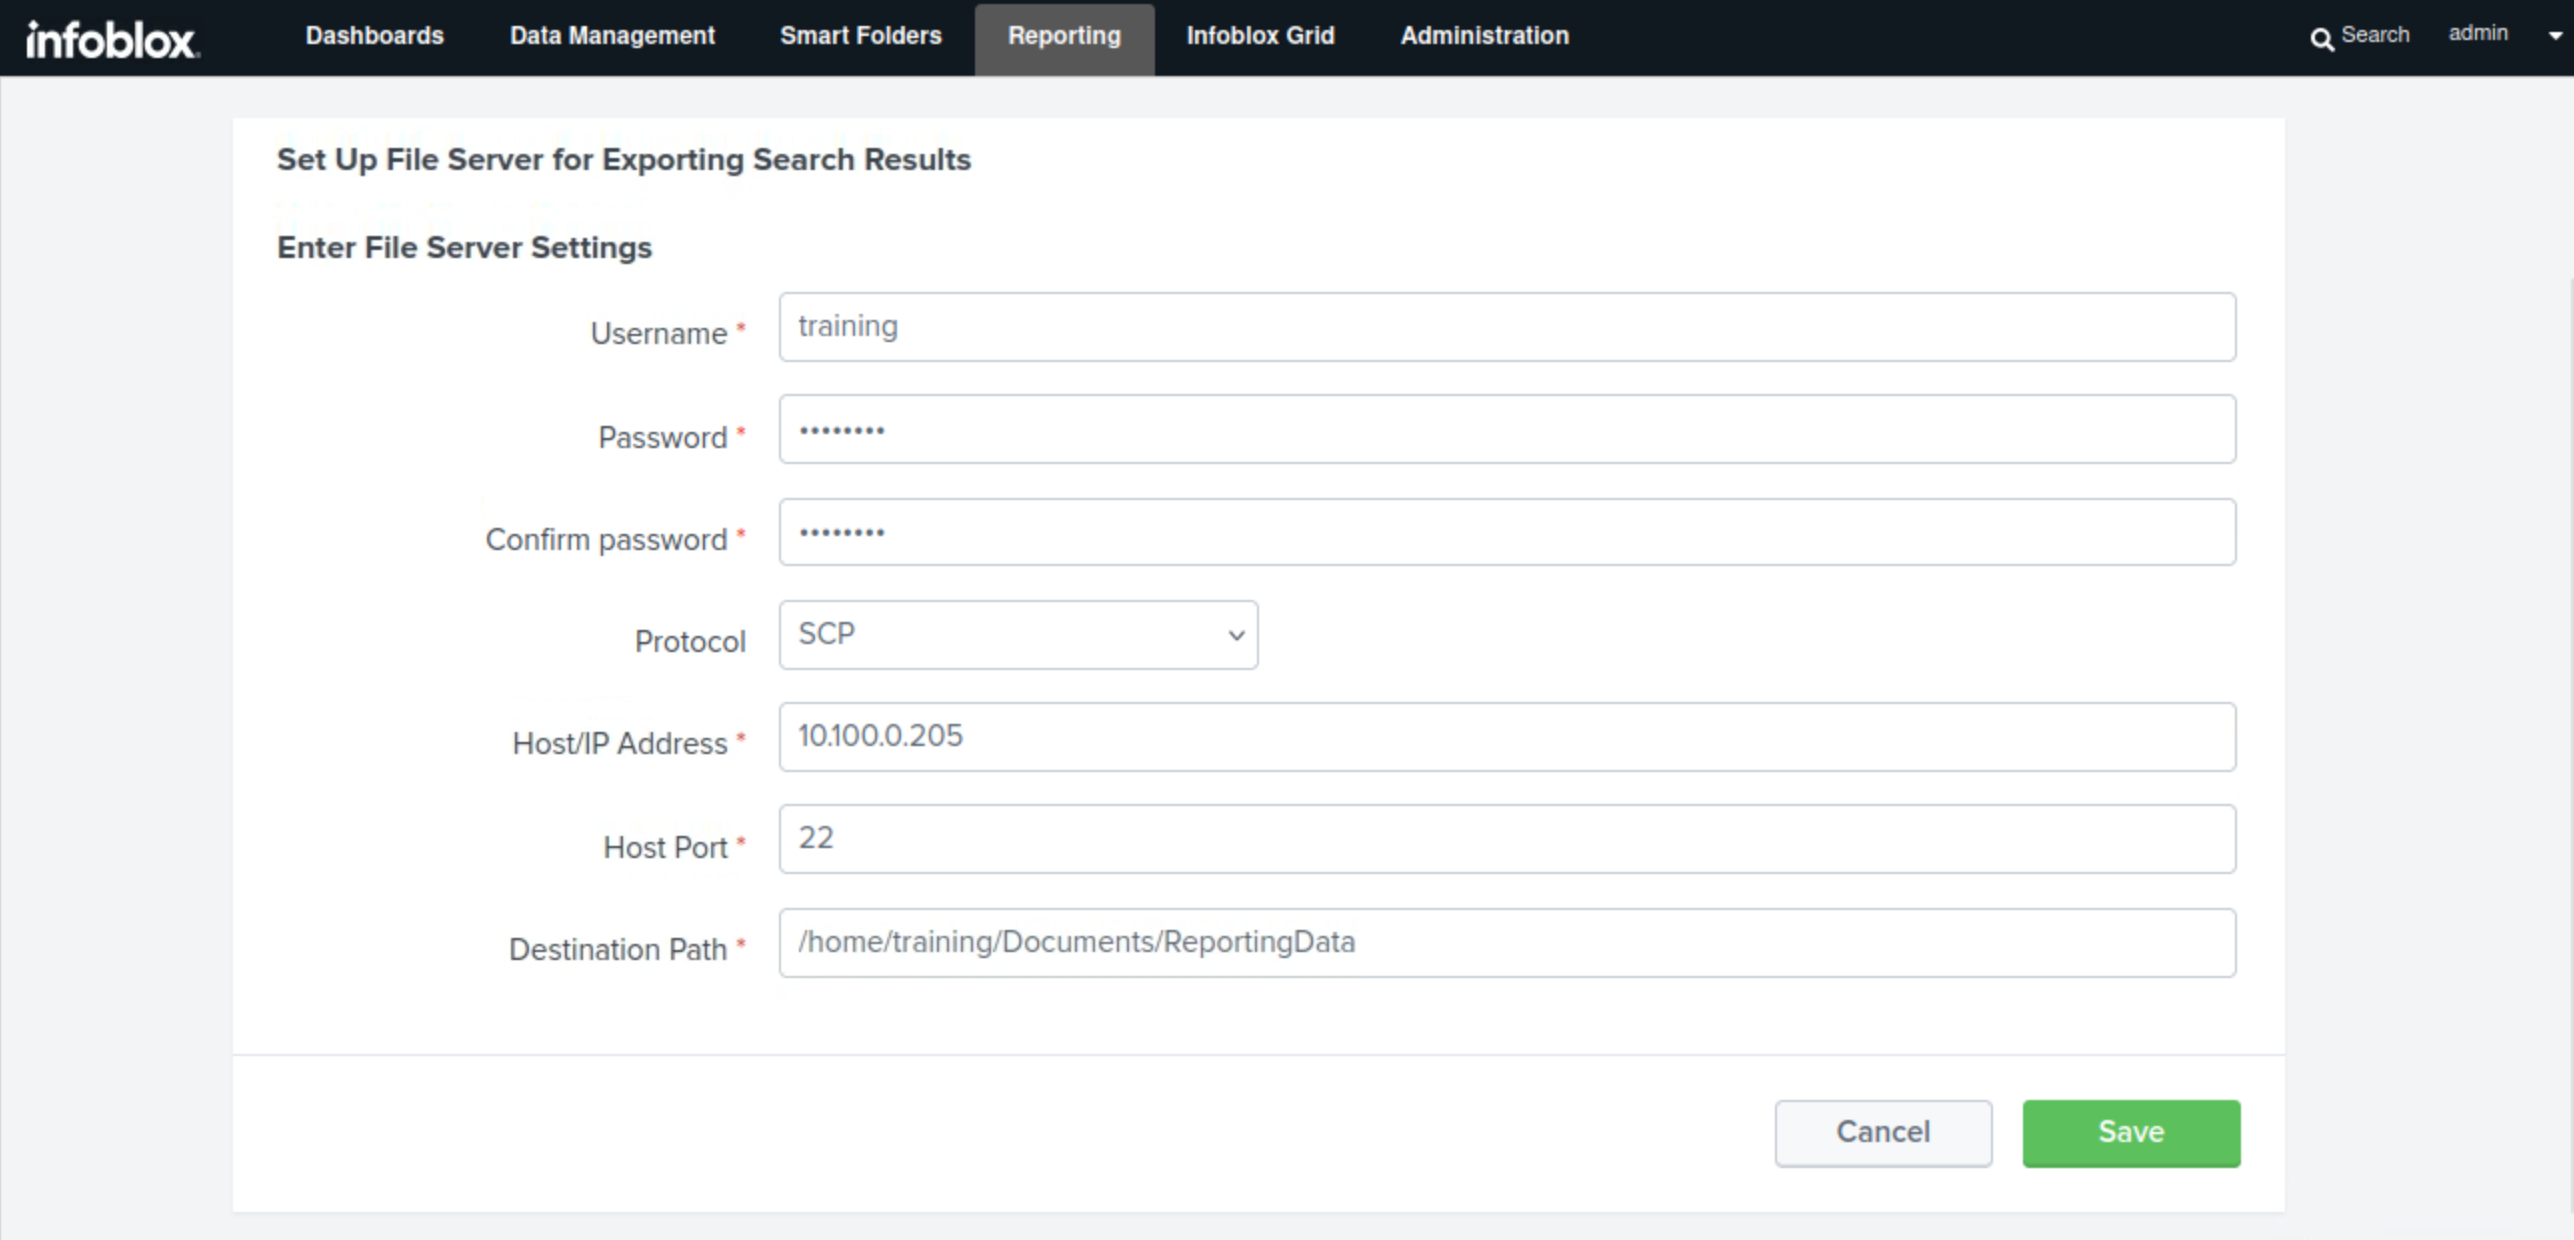
Use the information from this table to set up the reporting server:
|
Configuration |
Value |
|
Username |
training |
|
Password |
infoblox |
|
Protocol |
SCP |
|
Host/ IP Address |
10.100.0.205 |
|
Port |
22 |
|
Path |
/home/training/Documents/ReportingData |
-
Click Save.
Task 3 Solution: Simulate a Misbehaving/Infected Client
It can take up to 10 minutes for extibns.techblue.net, to boot up with the DNS Infrastructure Protection service enabled.
In this task, We will wait for extibns.techblue.net to boot up with the DNS Infrastructure Protection service enabled.
Using the queryperf tool on the support-server VM, we will run three rounds, each with four attempts and 3- to 4-minute breaks between rounds, to send DNS queries to the extibns.techblue.net DNS server with the DNS-IP service enabled. We will use queryperf to set the query rate and simulate a misbehaving or infected client.
A custom Rate-Limiting rule (ID 120201001) was created in a previous lab under the 20250702-16 ruleset and inherited by the Authoritative - Tuned profile used by extibns.techblue.net. This rule controls traffic from the IP address 203.0.113.254 (support-server VM). It ensures continuous service for the customer’s IP, as your organization must provide 24/7 support, while preventing overloads. The rule triggers if the client sends more than 100 queries per second. We will use a query rate of 200.
We will use another tool, bmon on the support-server VM to monitor traffic on the eth2 interface connected to the 203.0.113.0 network to observe how extibns.techblue.net triggers the Rate-Limiting rule (ID 120201001).
-
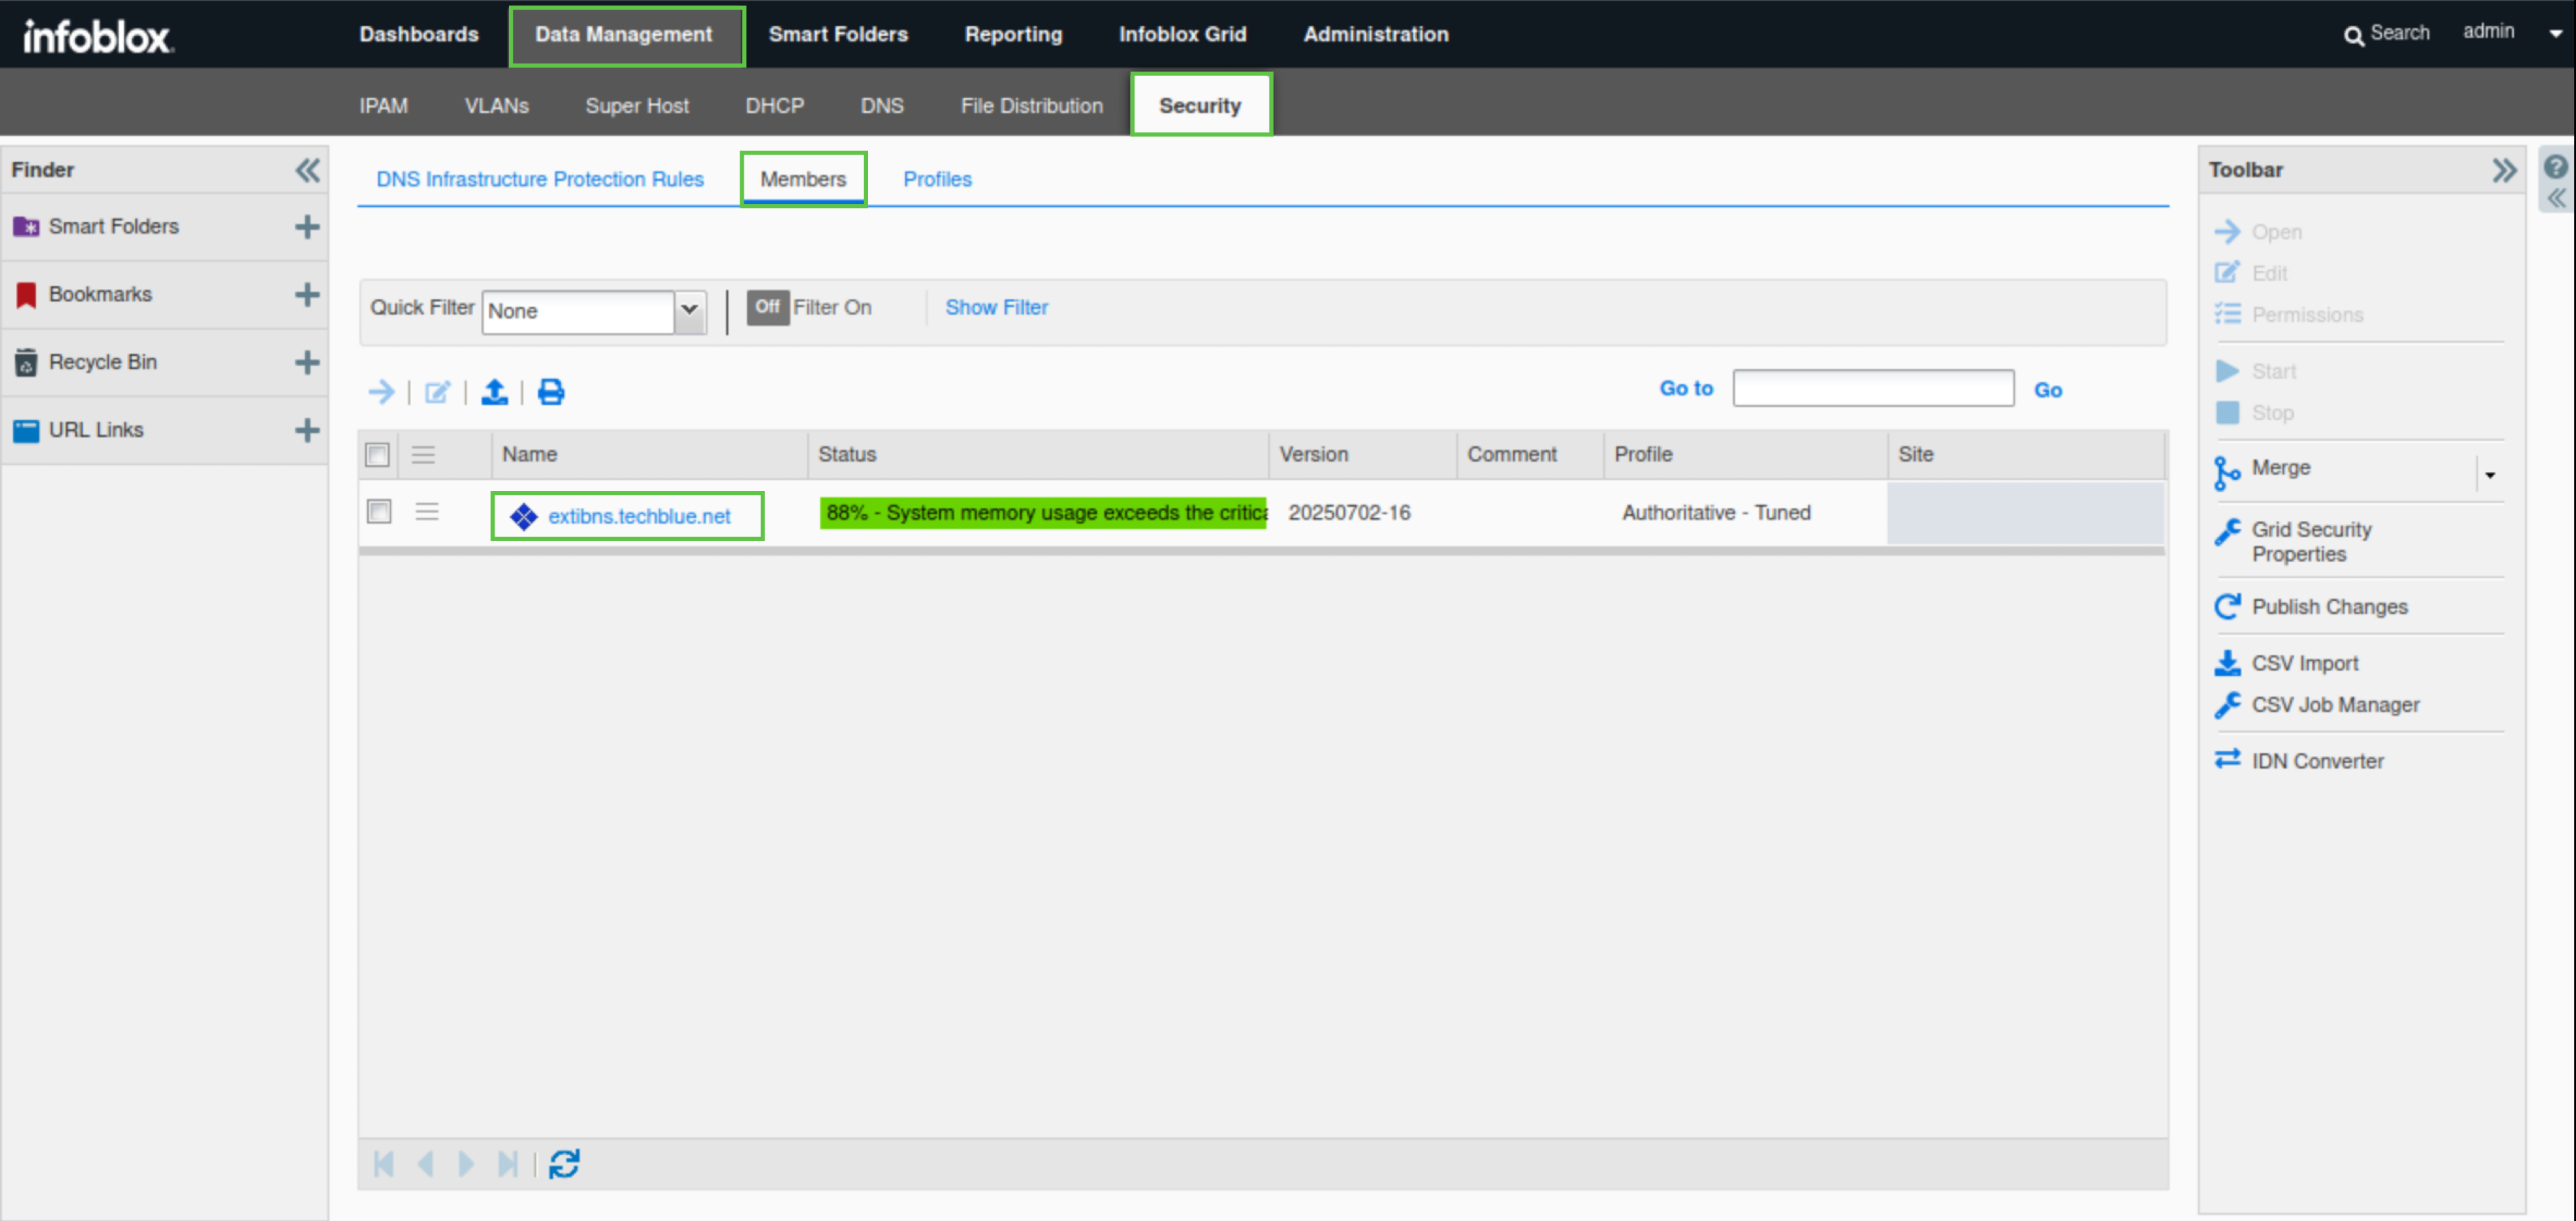
Navigate to Data Management → Security → Members
-
Confirm that extibns.techblue.net is online and with the DNS Infrastructure Protection service enabled.
-
The entire process can take up to 10 minutes. It is normal for extibns.techblue.net to cycle between online and offline while loading license files and enabling the service.
-
-
Switch to the support-server VM (training/infoblox).
-
Open the bmon tool.
-
Expand the terminal window so you can see the colored charts that visualize DNS traffic flow during our tests.
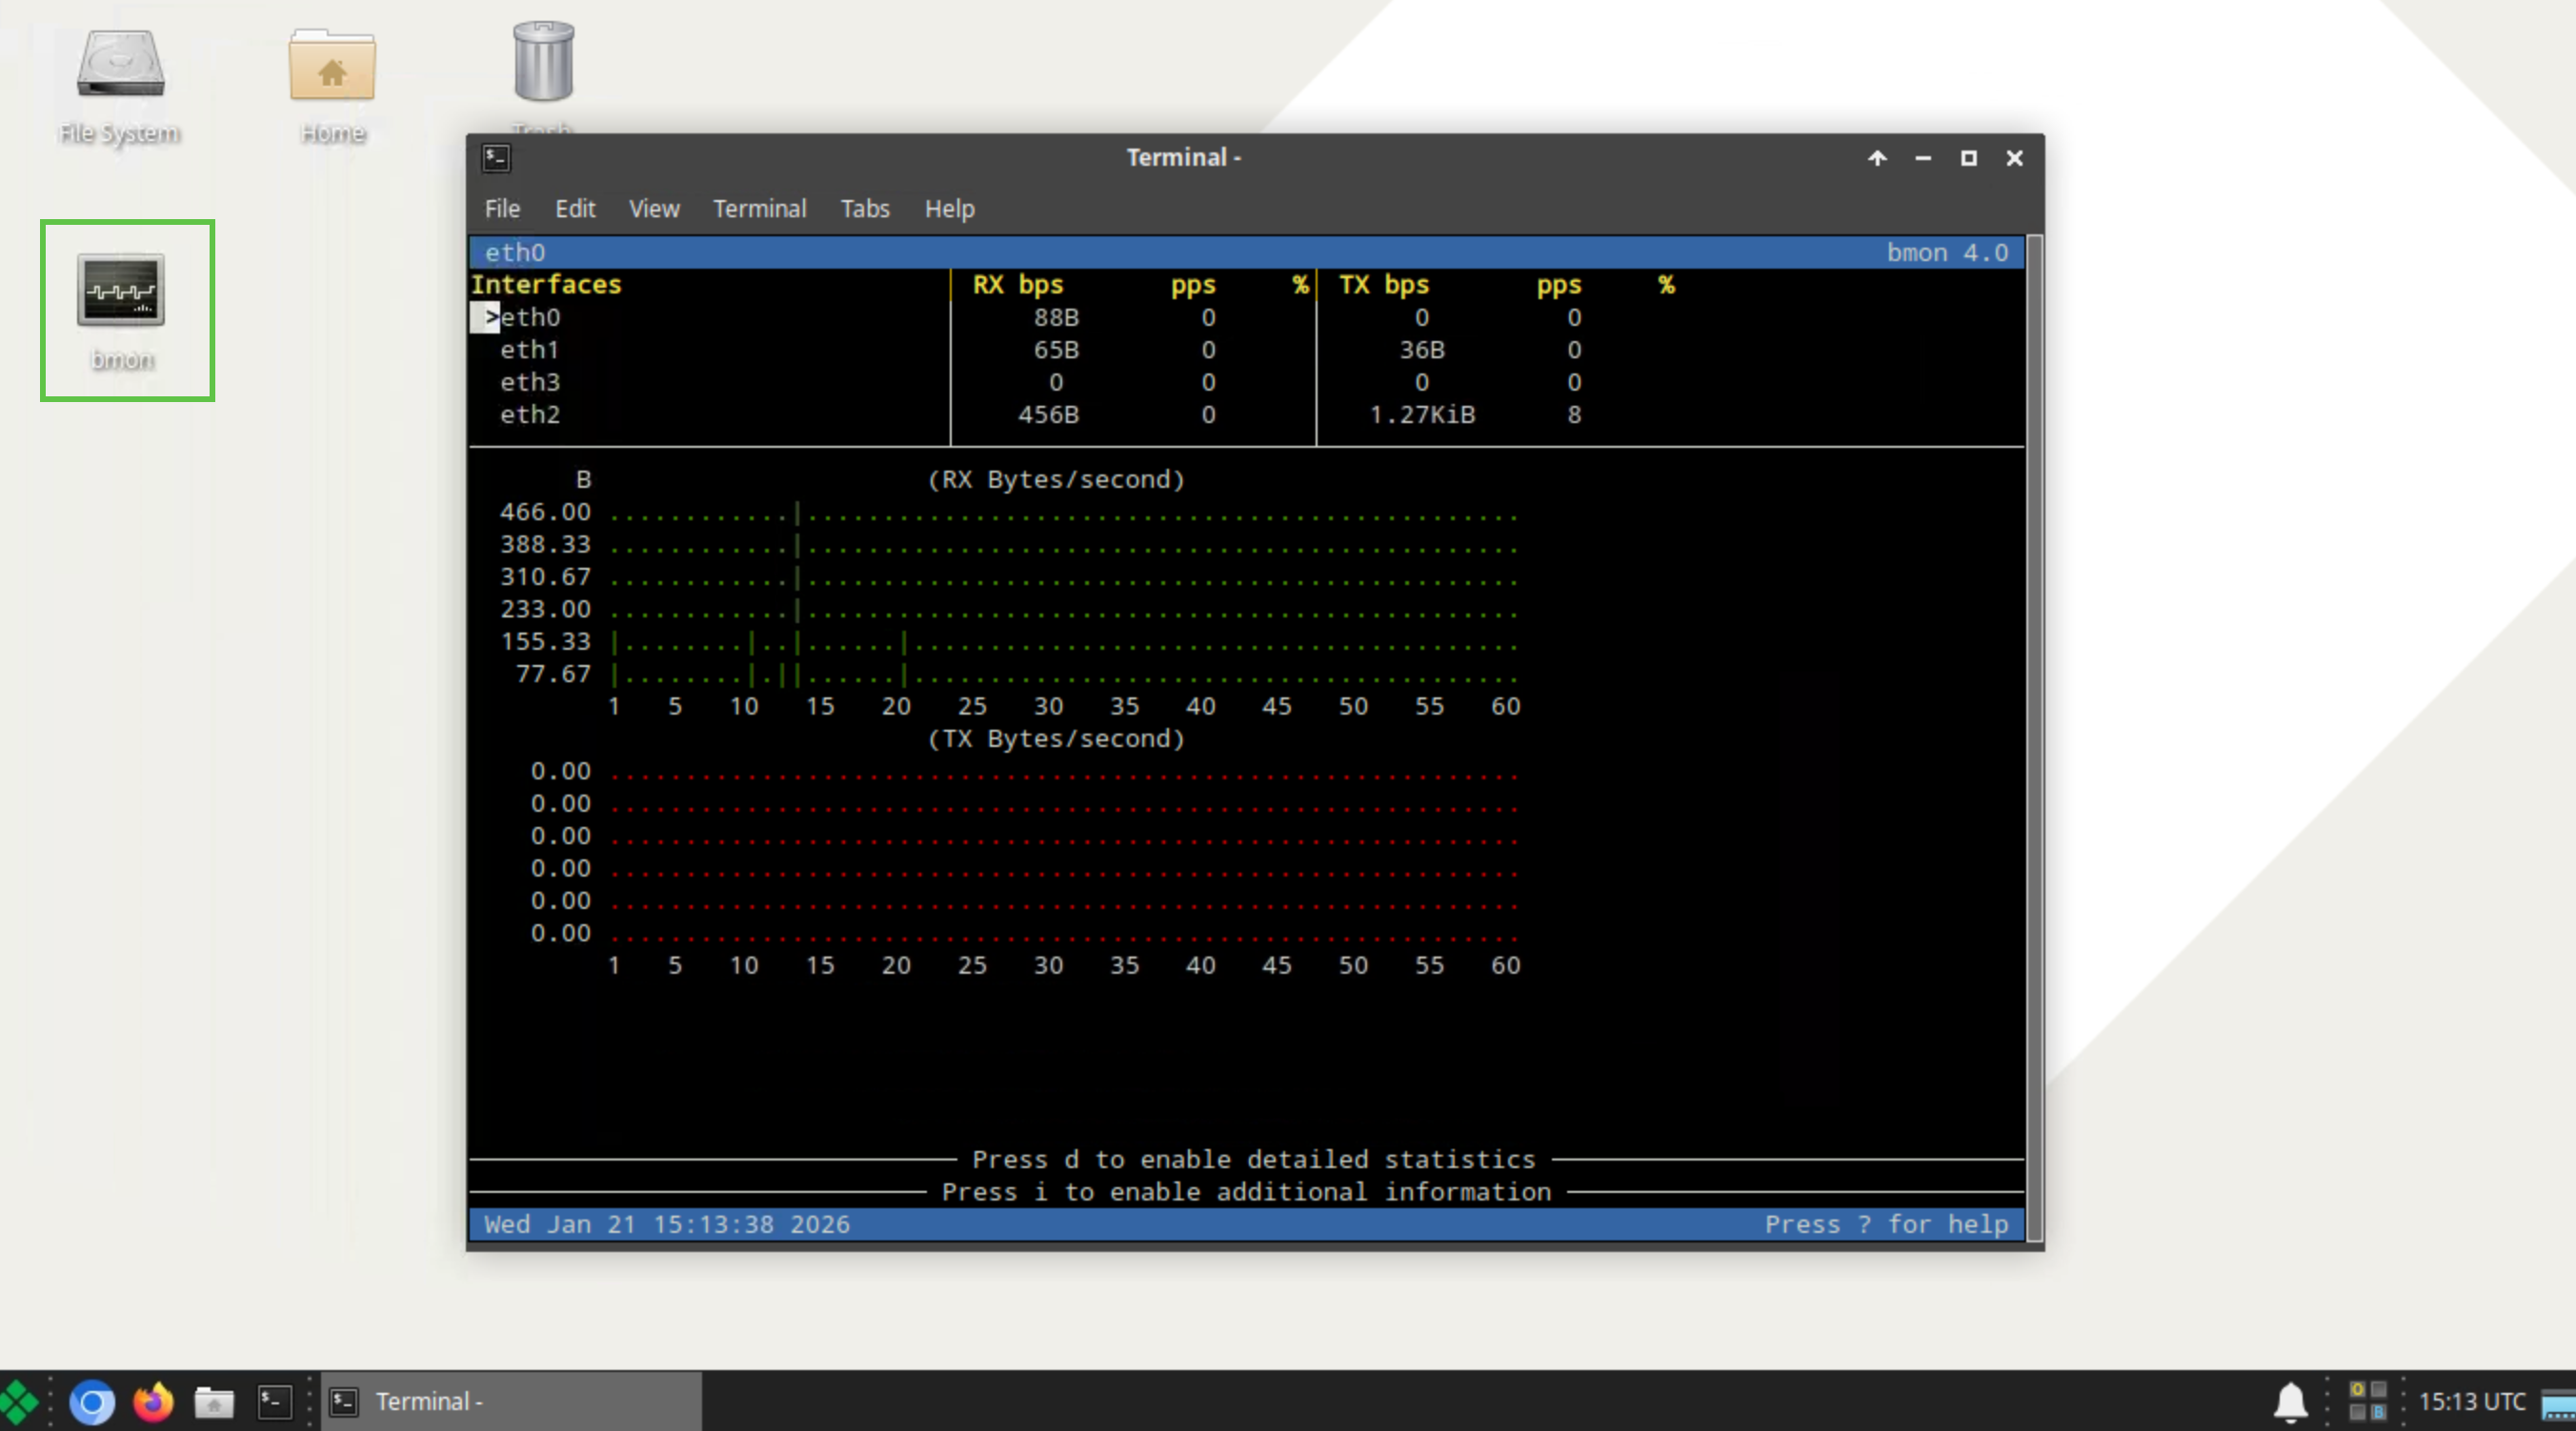
-
-
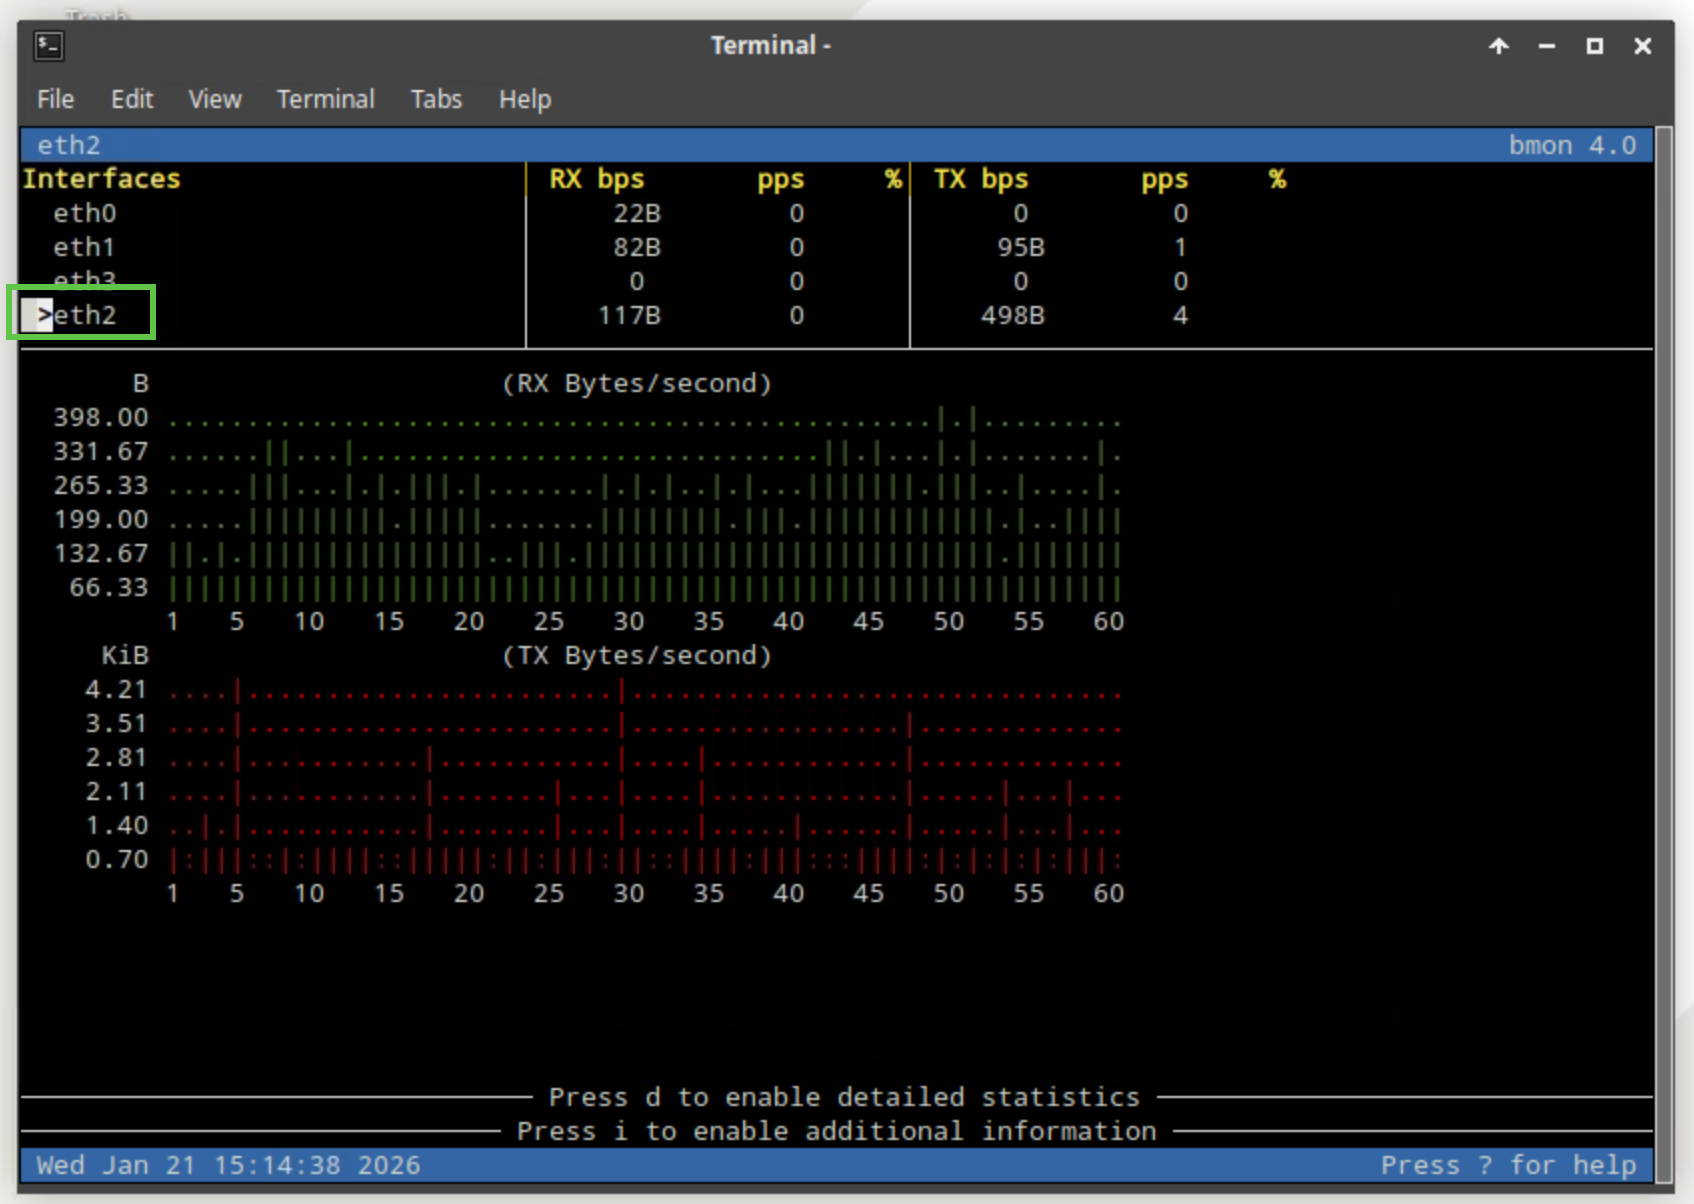
Press the down arrow key on your keyboard to select the eth2 interface.
-
This indicates that you are monitoring traffic on the eth2 interface, which is connected to the 203.0.113.0 network.
-
-
Open another terminal window.
-
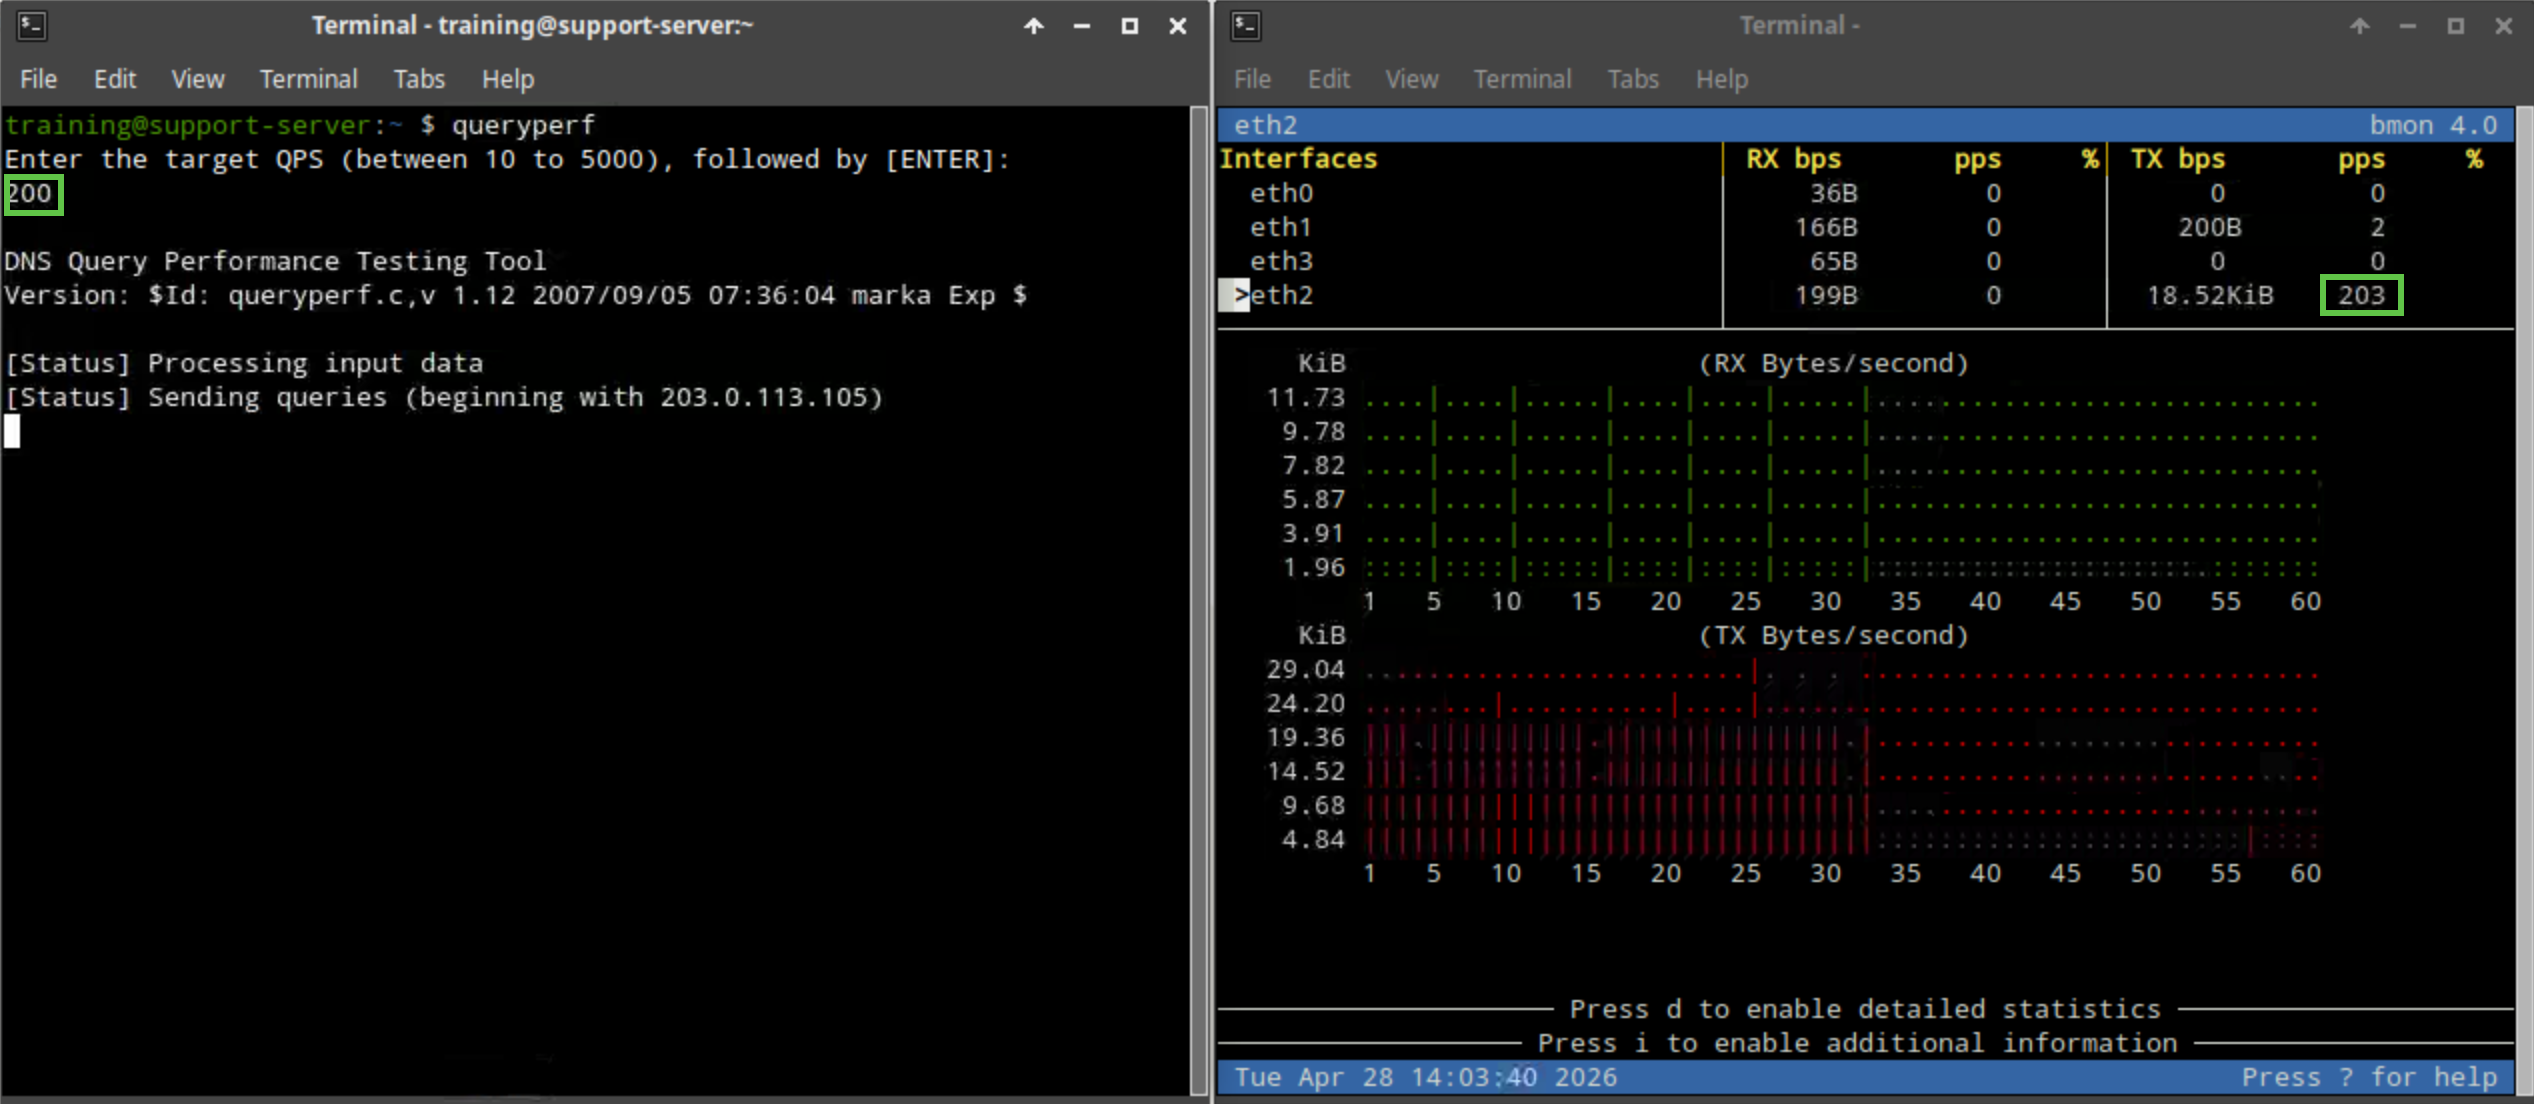
Type the command queryperf.
-
Send 200 QPS.
-
This rate higher than the maximum allowed query rate for the custom Rate-Limiting rule (rule ID 120201001) of 100 and will trigger the rule.
-
-
The bmon window should show continuous spikes of queries, then drops for 5-second intervals, which verifies that our custom Rate-Limiting rule has been triggered properly.
-
Repeat steps 5 to 7 for 3 more times for a total of 4 repetitions.
-
Wait for 2 to 3 minutes.
-
Repeat steps 5 to 7 one more time, for 4 repetitions.
-
Wait again, for 2 to 3 minutes.
-
Then, repeat steps 5 to 7 one last time, for 4 repetitions.
-
We are trying to simulate an infected or misbehaving client periodically sending out an excessive number of DNS queries.
-
Task 4 Solution: Analyze the Grid Status and Health using NIOS Security Dashboard
In this task, we assume an administrator role after the security status for Grid widget on the NIOS Security dashboard turned red, signaling a critical issue.
We use the NIOS Security Dashboard to analyze the issue. Since our investigation has just begun, we start by examining the grid's general security health using the security status for Grid and Security Status for all Members widgets to gather information and context about the incident.
Using these widgets, we identify the issue was triggered by the DNS Infrastructure Protection (DNS-IP) service on extibns.techblue.net. This leads us to analyze the grid member separately to understand which rules triggered, the associated IP addresses, visualize a timeline, and verify whether DNS-IP stopped the incident.
This information helps us understand the recent event. We need to investigate if this incident recurs after verifying with syslog that traffic was rate limited by our organization’s custom DNS-IP rule. We will check extibns.techblue.net’s syslog to confirm the action taken and matched rule, then use the Reporting Server’s dashboards to view historical Grid dashboards.
-
Switch back to the jump-desktop VM and log back into the Grid Manager UI. (admin/infoblox).
-
Navigate to Dashboards → Status → Security.
-
Find the Security Status for Grid widget.
-
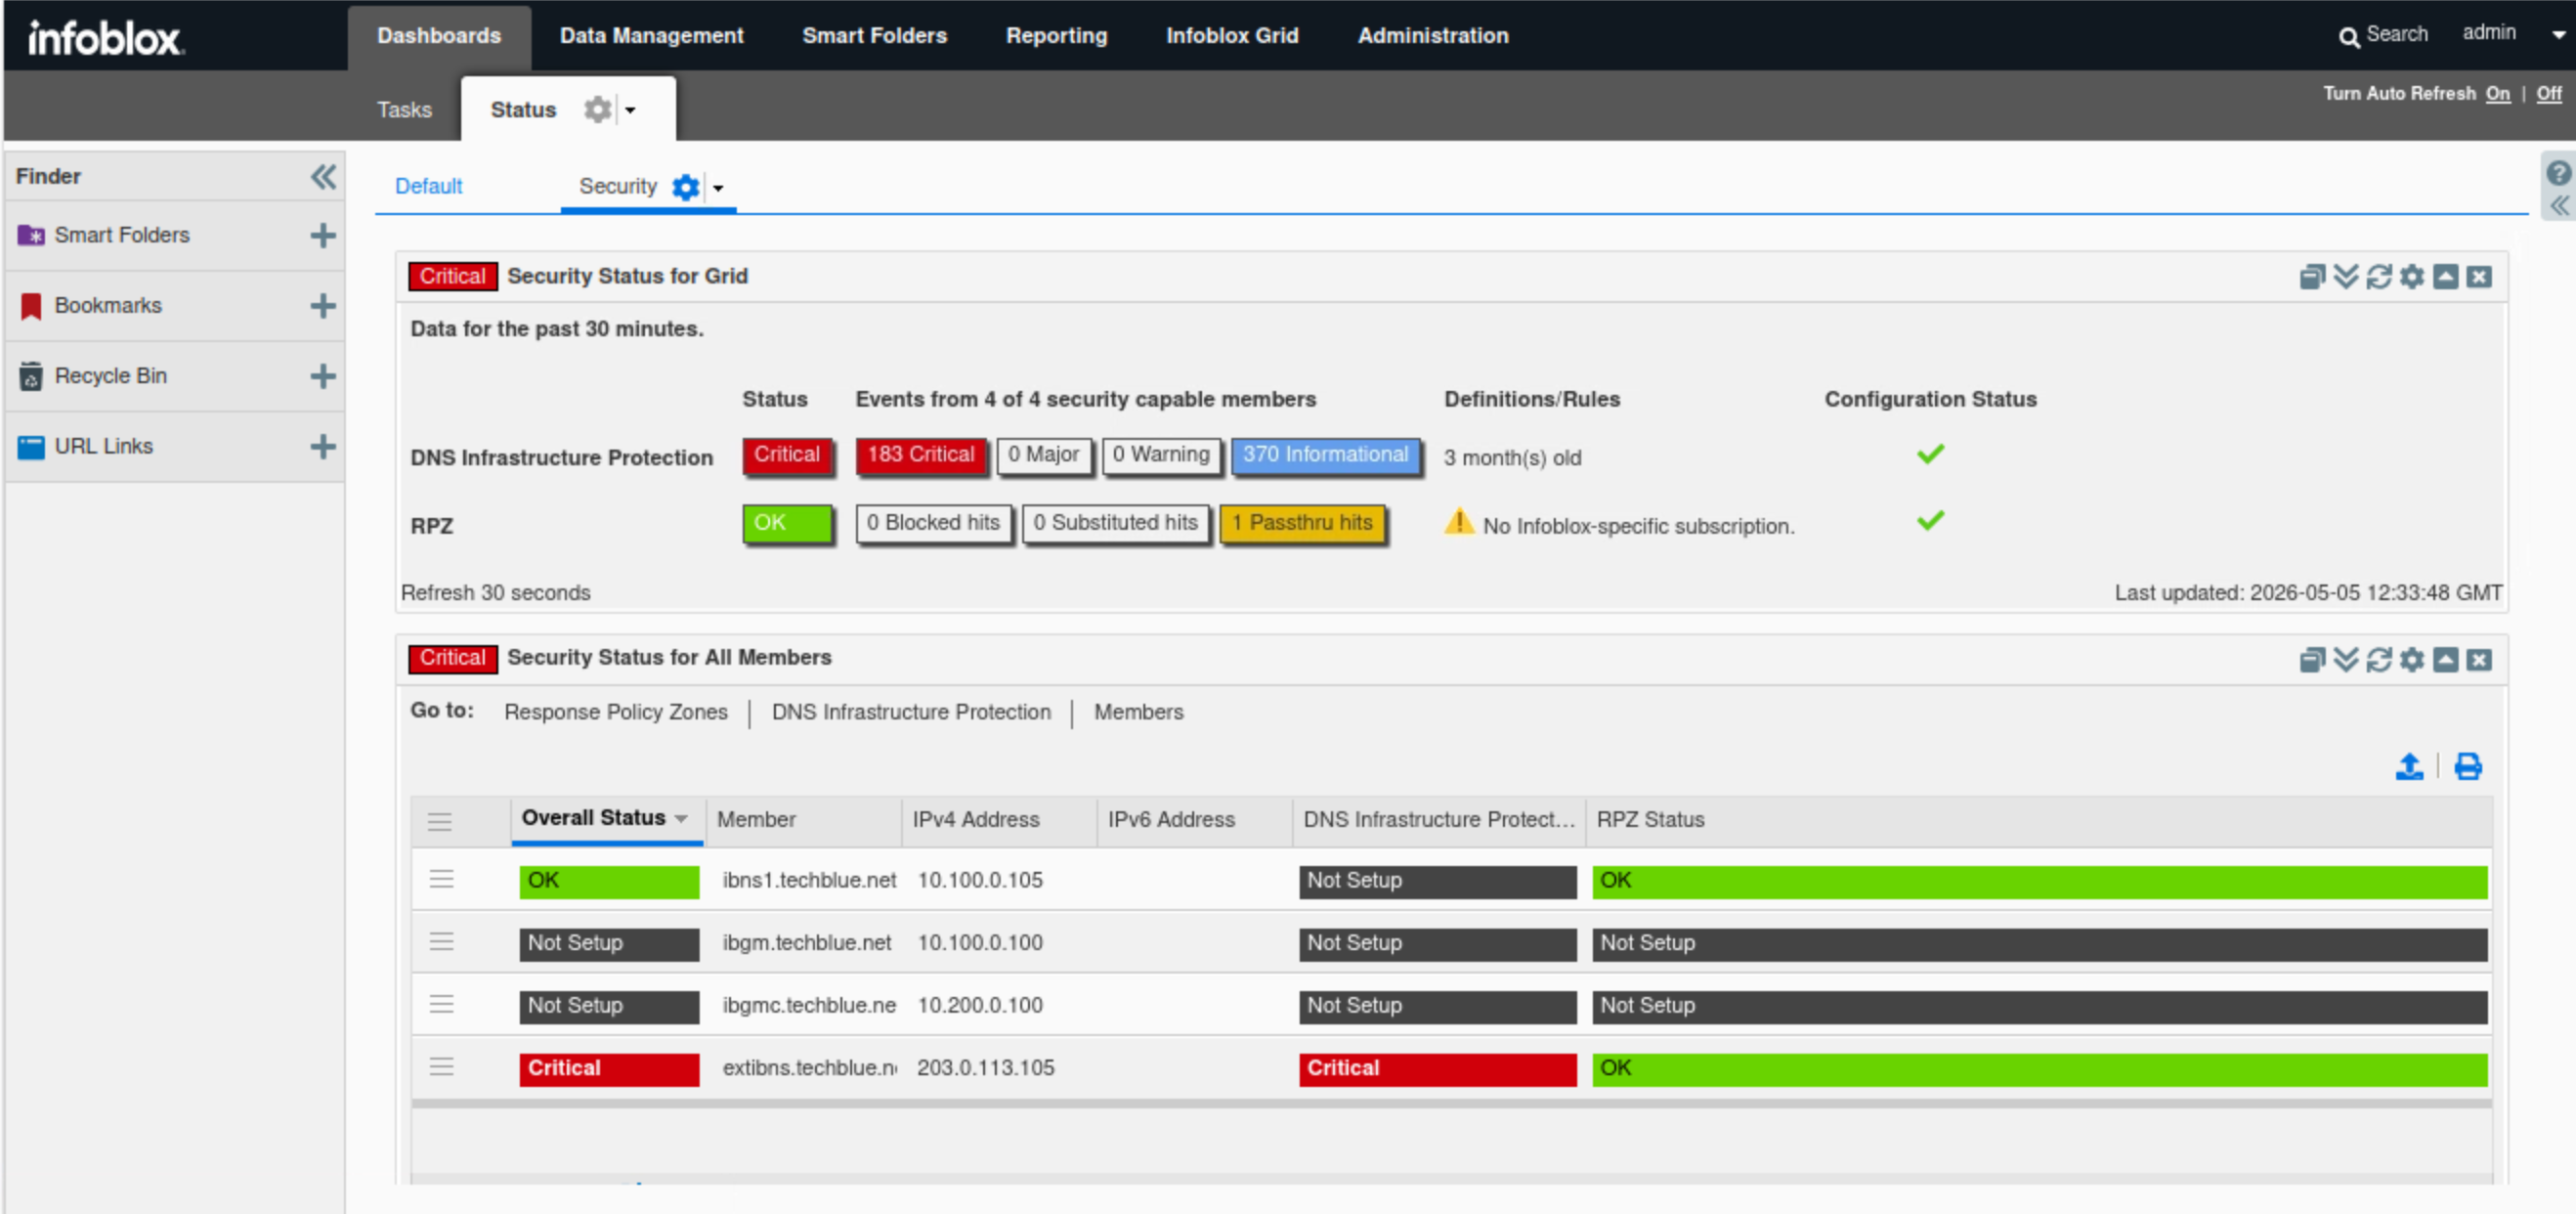
The widget shows high-level information about the Grid security status, including the status of each enabled security service: RPZ, Threat Insight or DNS-IP.
-
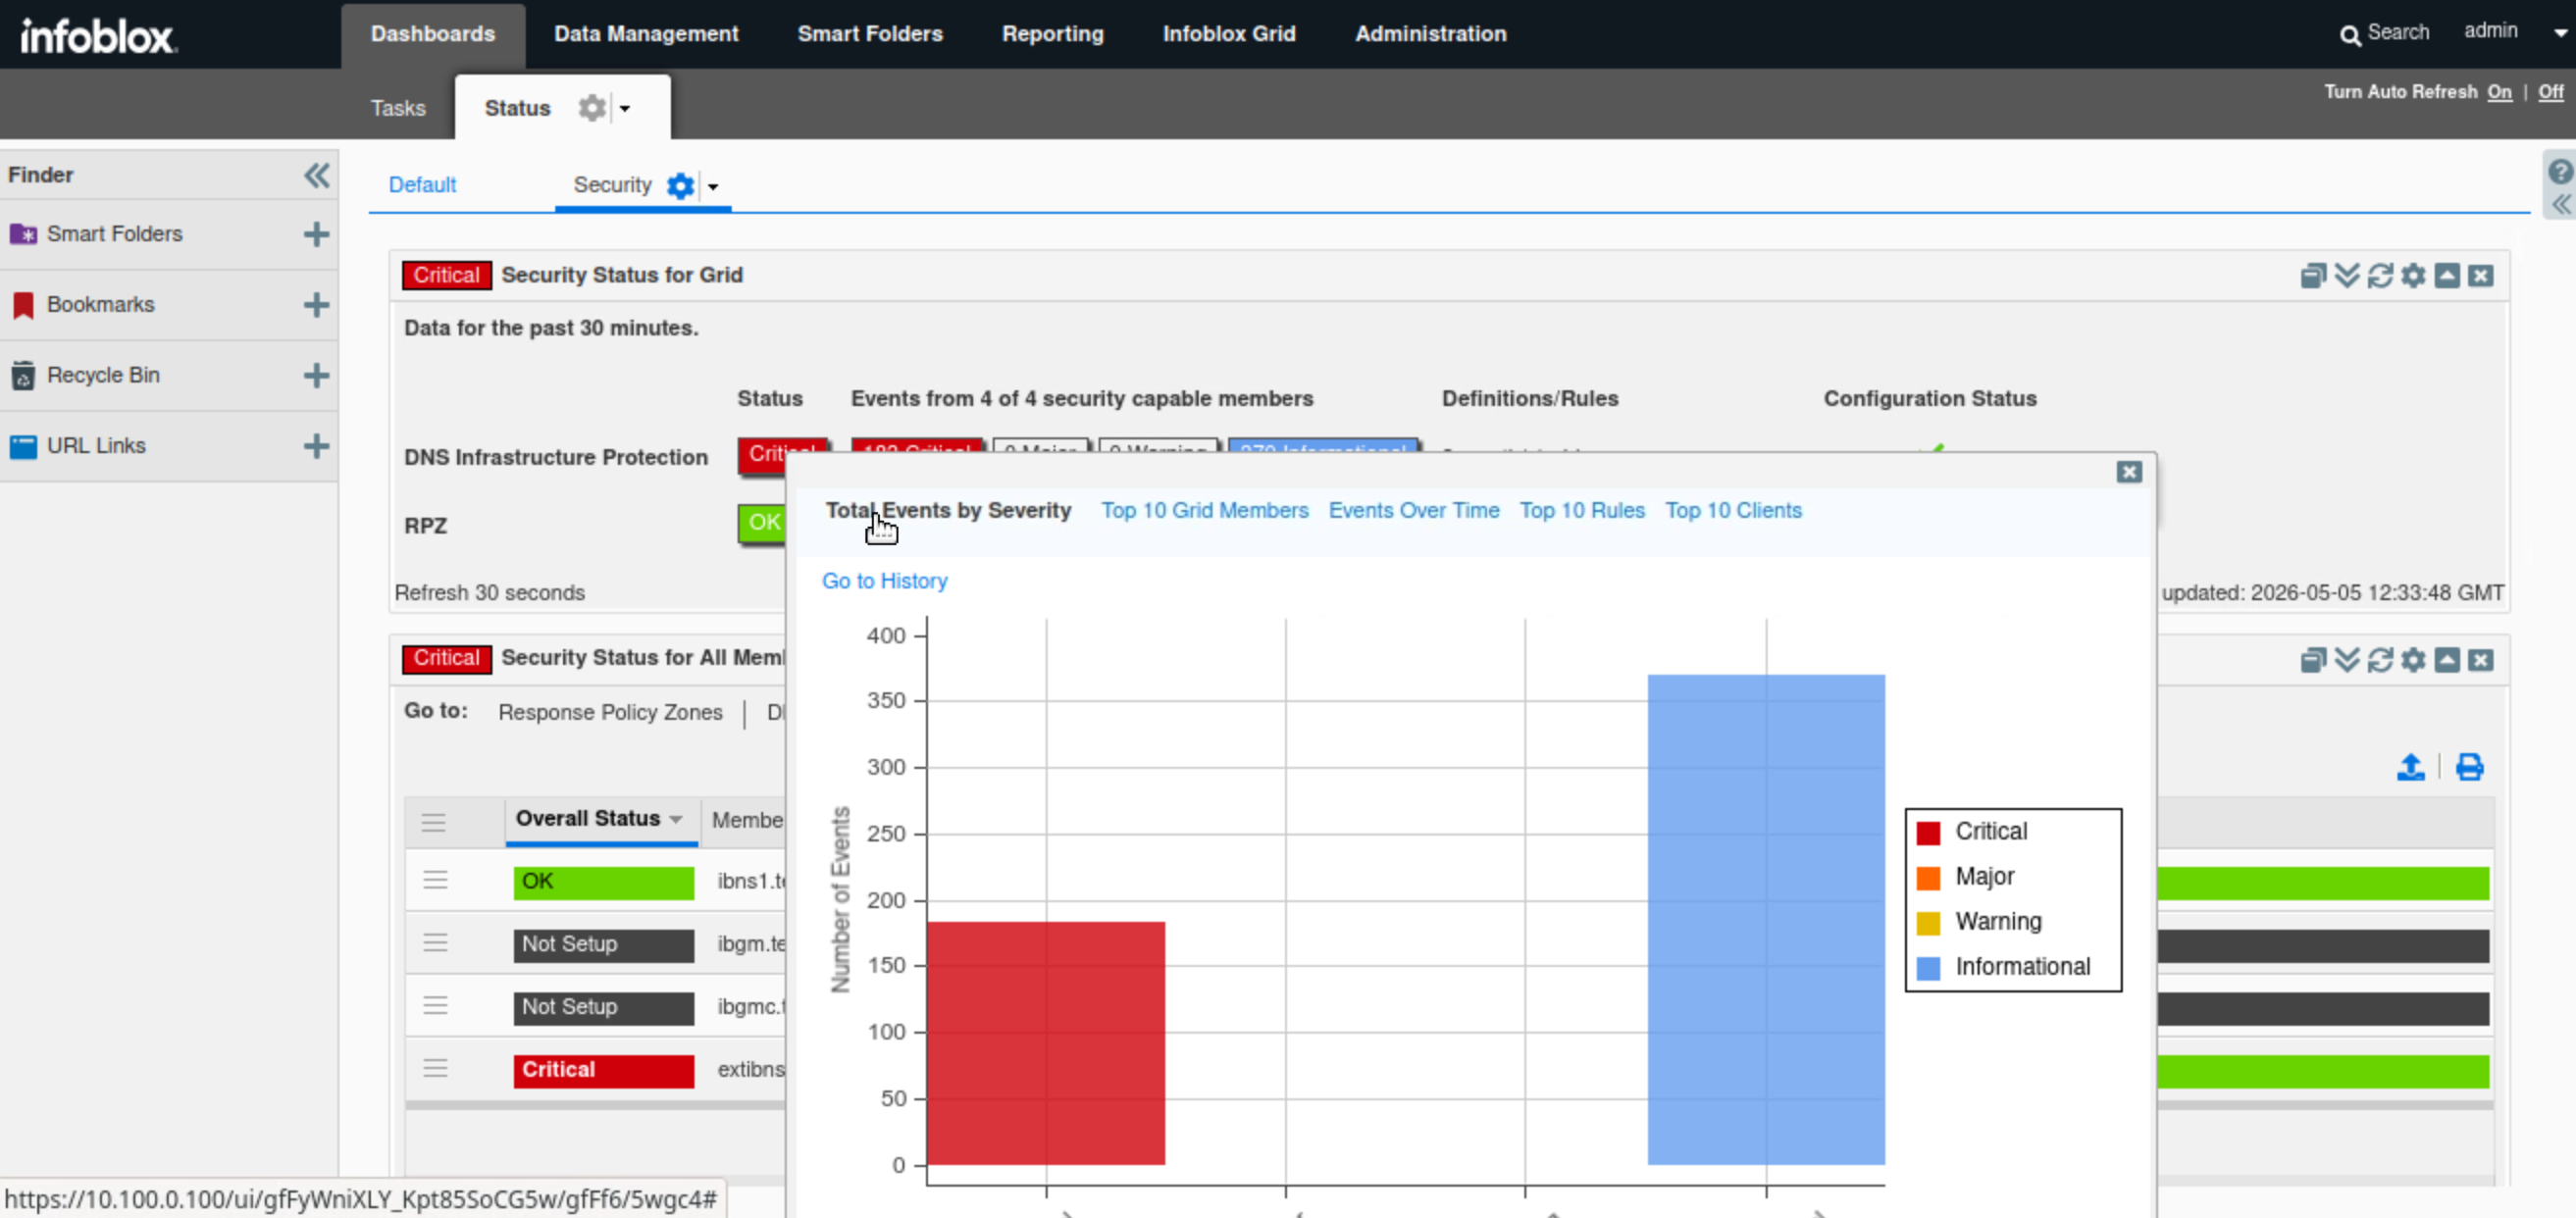
The DNS Infrastructure Protection status is critical. We see a Grid-wide breakdown of the number of events per severity level.
-
Hovering over the status icon shows a breakdown of the DNS Infrastructure Protection status, including Total Events by Severity, Events Over Time, and Top 10 Rules among others. This information also appears in the DNS Infrastructure Protection status for the Grid widget. We will focus on these details in a later step.
-
-
Find the Security Status for all Members widget.
-
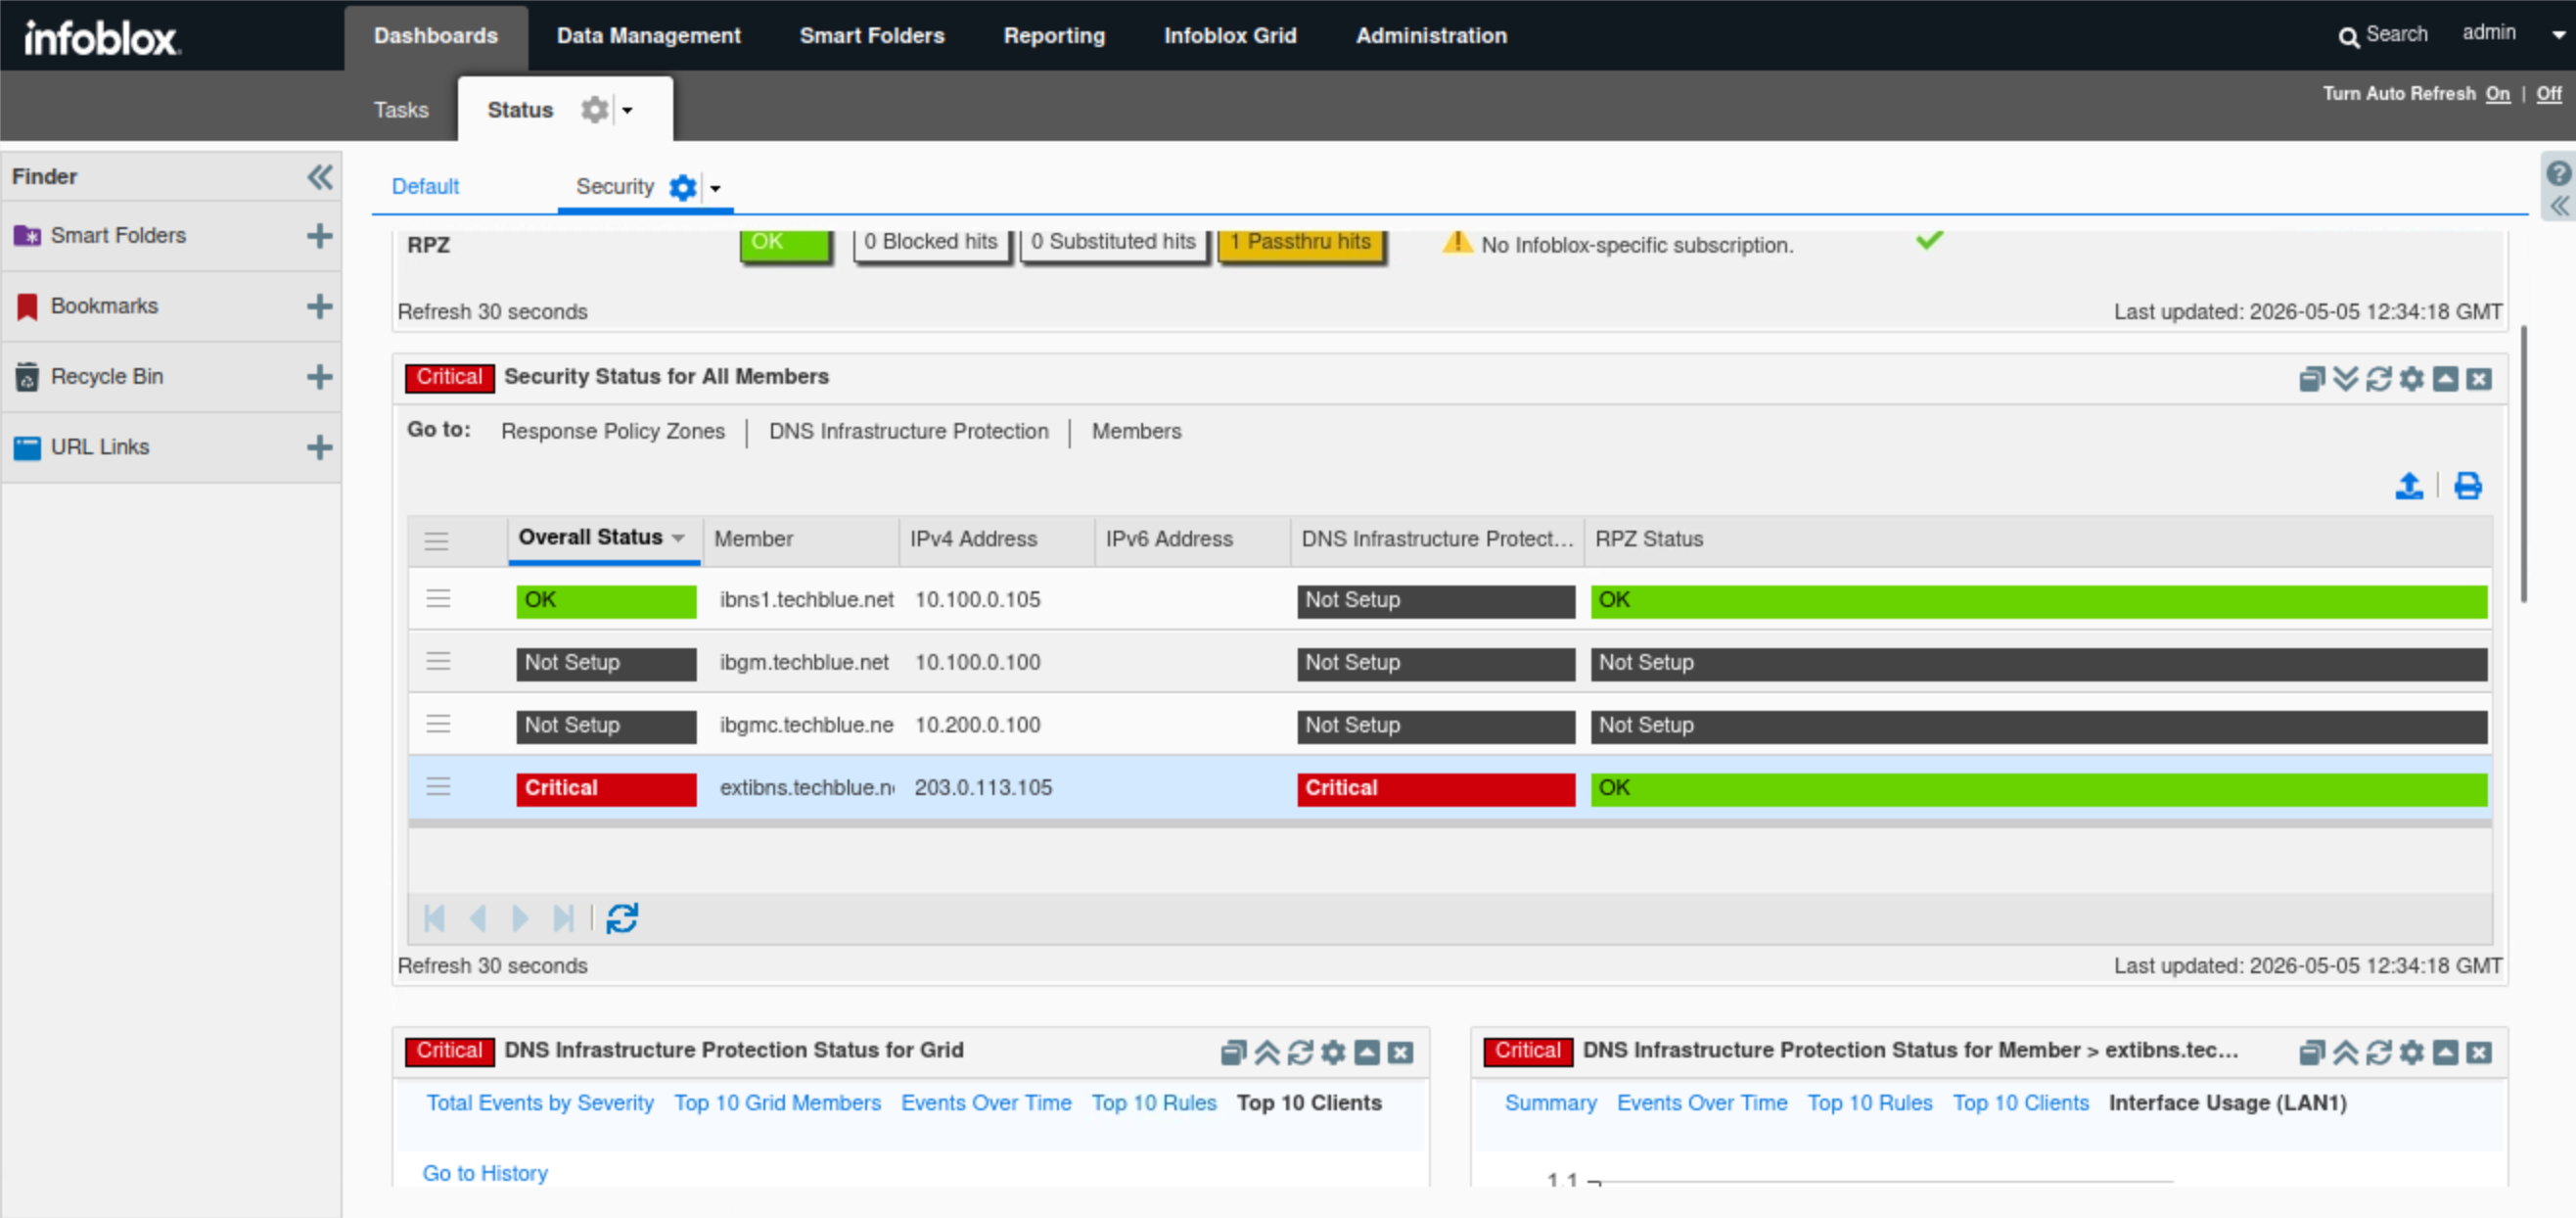
This widget shows a detailed status breakdown for each Grid member. Since the grid member ibns1.techblue.net does not run DNS Infrastructure Protection, it should not be affected by recent events, while extibns.techblue.net is critical because it runs DNS Infrastructure Protection.
-
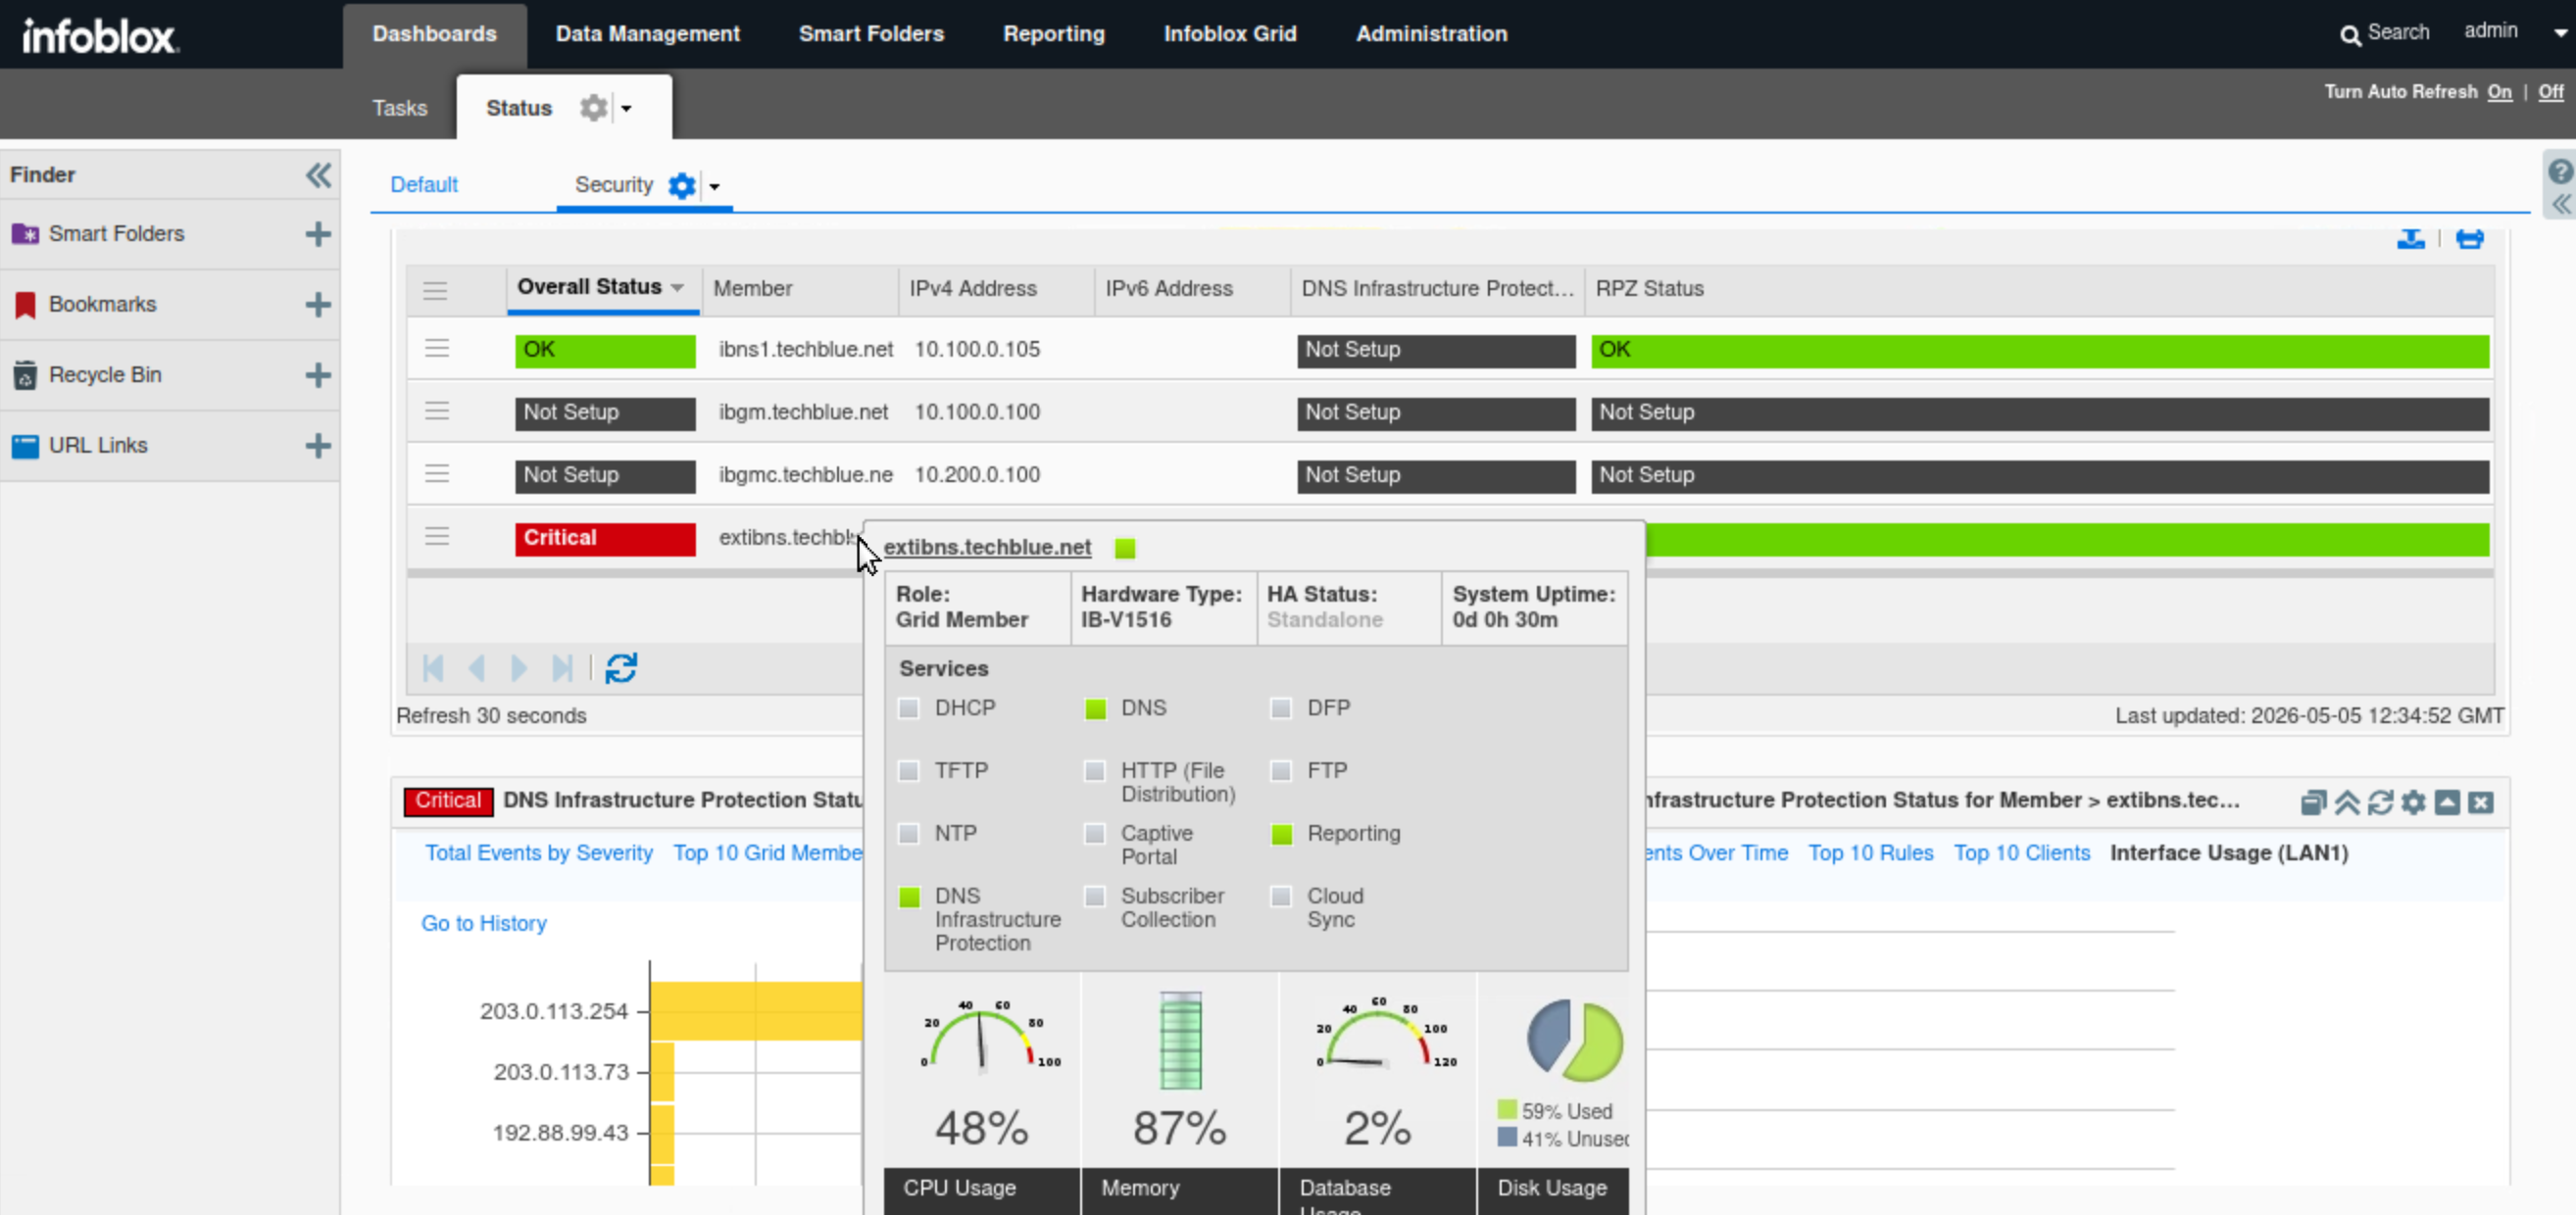
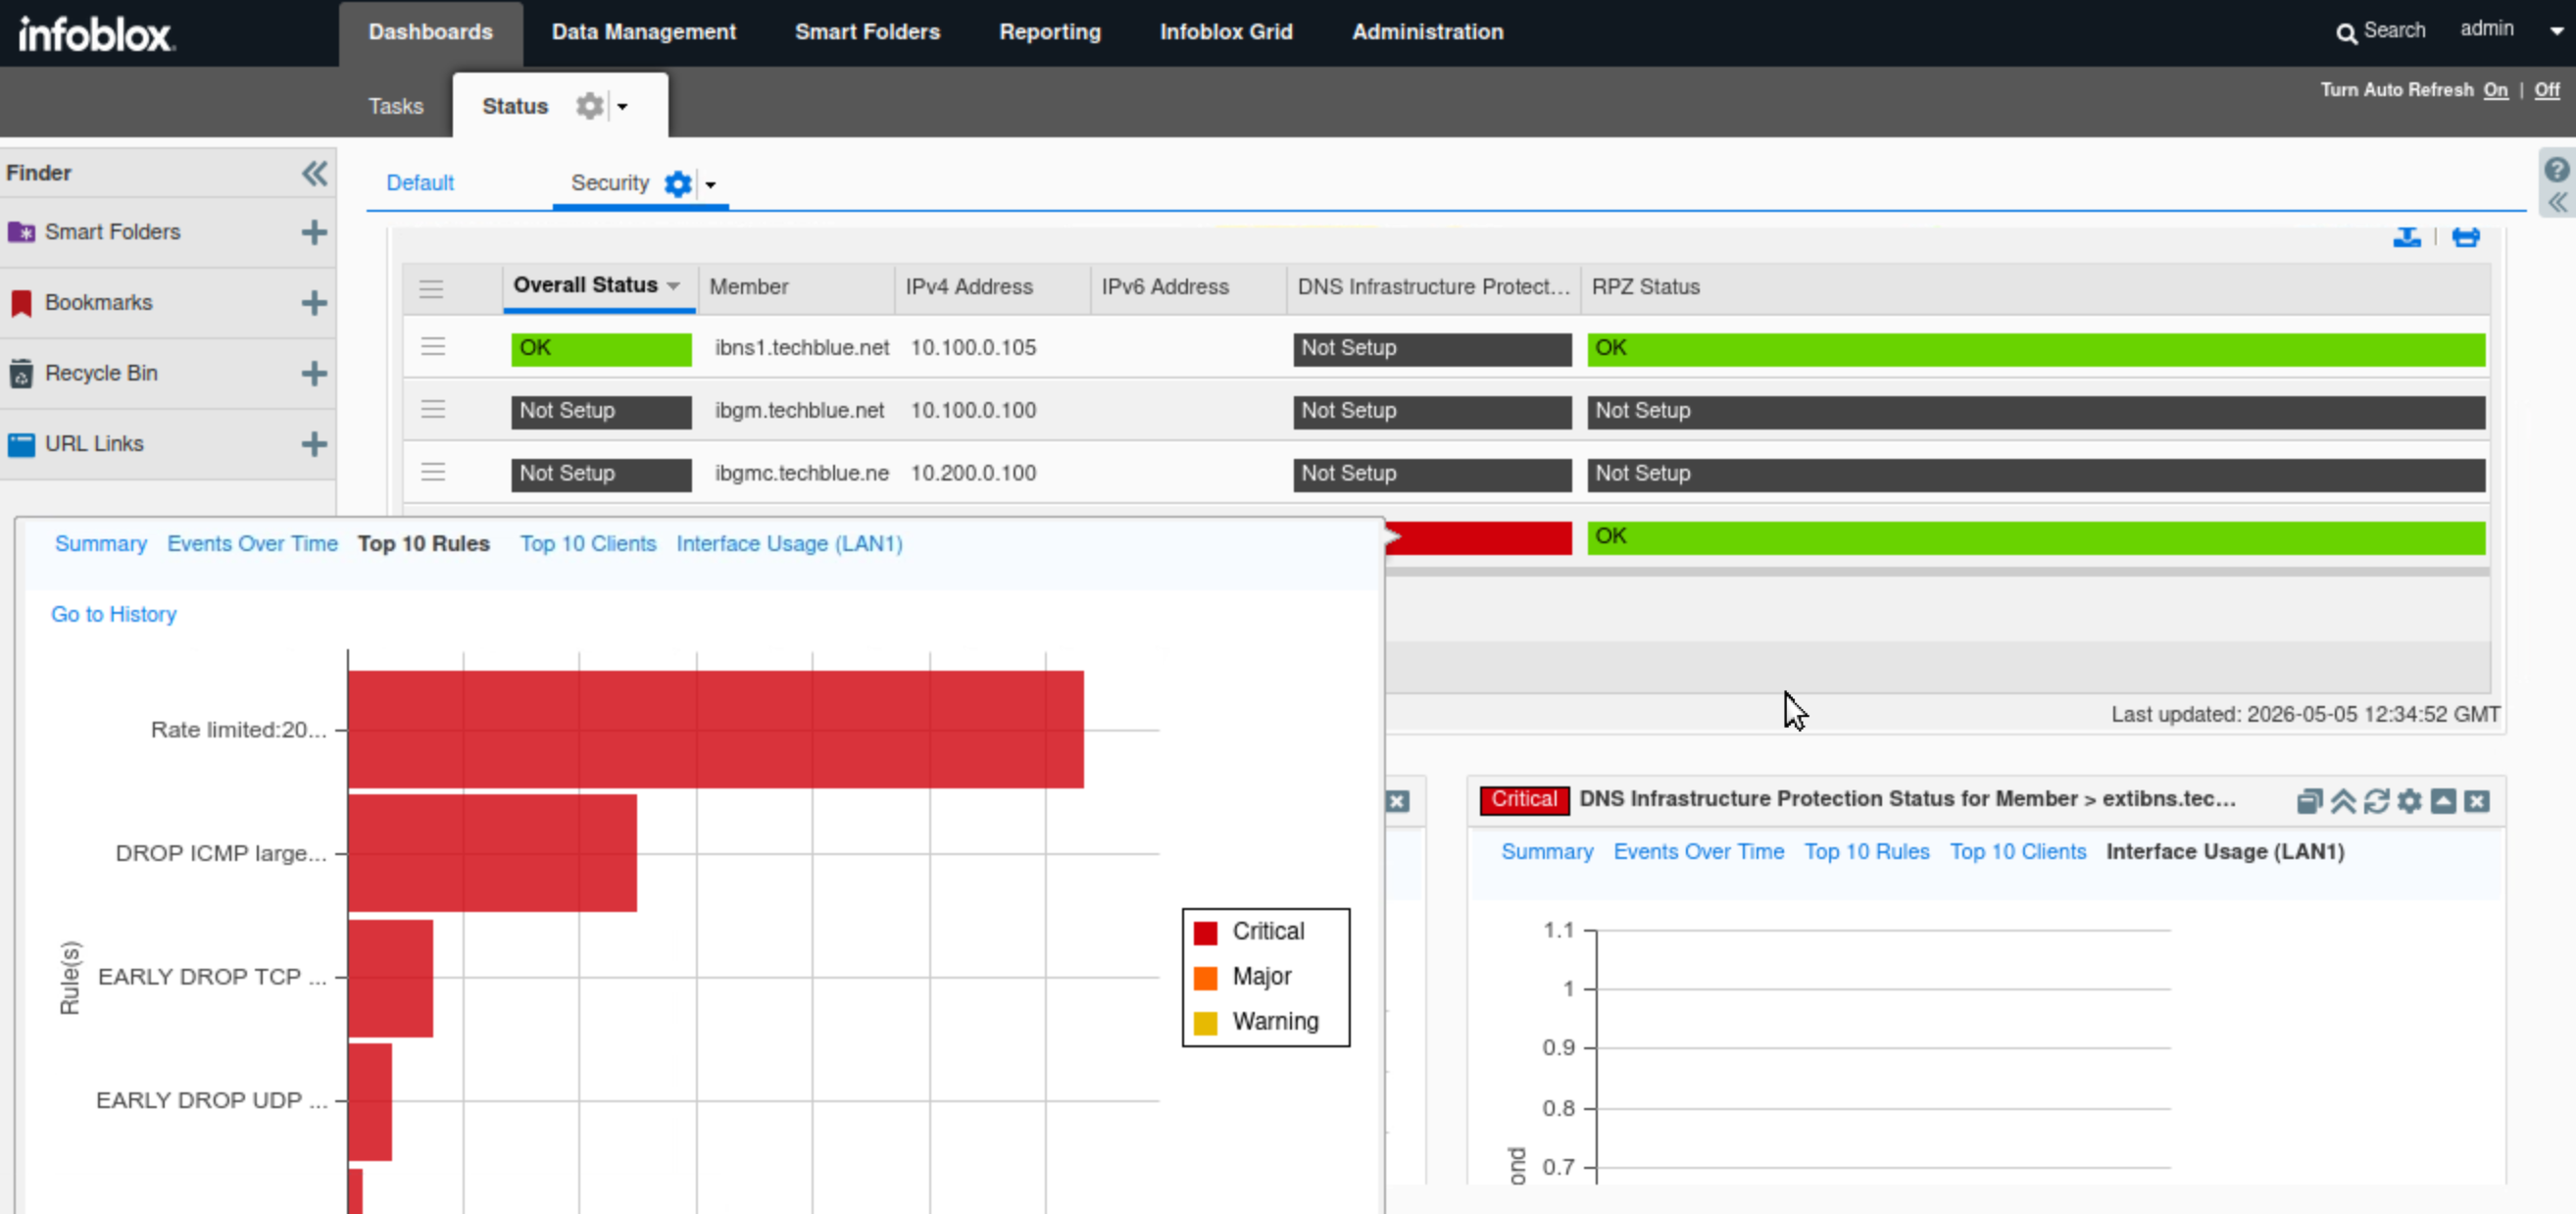
Hovering over each member's name reveals details about that Grid member, such as enabled services and CPU, memory, and disk usage. Similarly, hovering over the DNS Infrastructure Protection status bar shows a breakdown of the DNS Infrastructure Protection status for that member, including Total Events by Severity, Events Over Time, and Top 10 Rules. This information also appears in the DNS Infrastructure Protection Status for member widget. We will focus on these details in a later step.
-
-
Find the DNS Infrastructure Protection Status for Grid widget.
-
This widget shows a breakdown of the DNS Infrastructure Protection status, using five tabs: Total Events by Severity, Top 10 Grid members, Events Over Time, Top 10 Rules and Top 10 Clients.
-
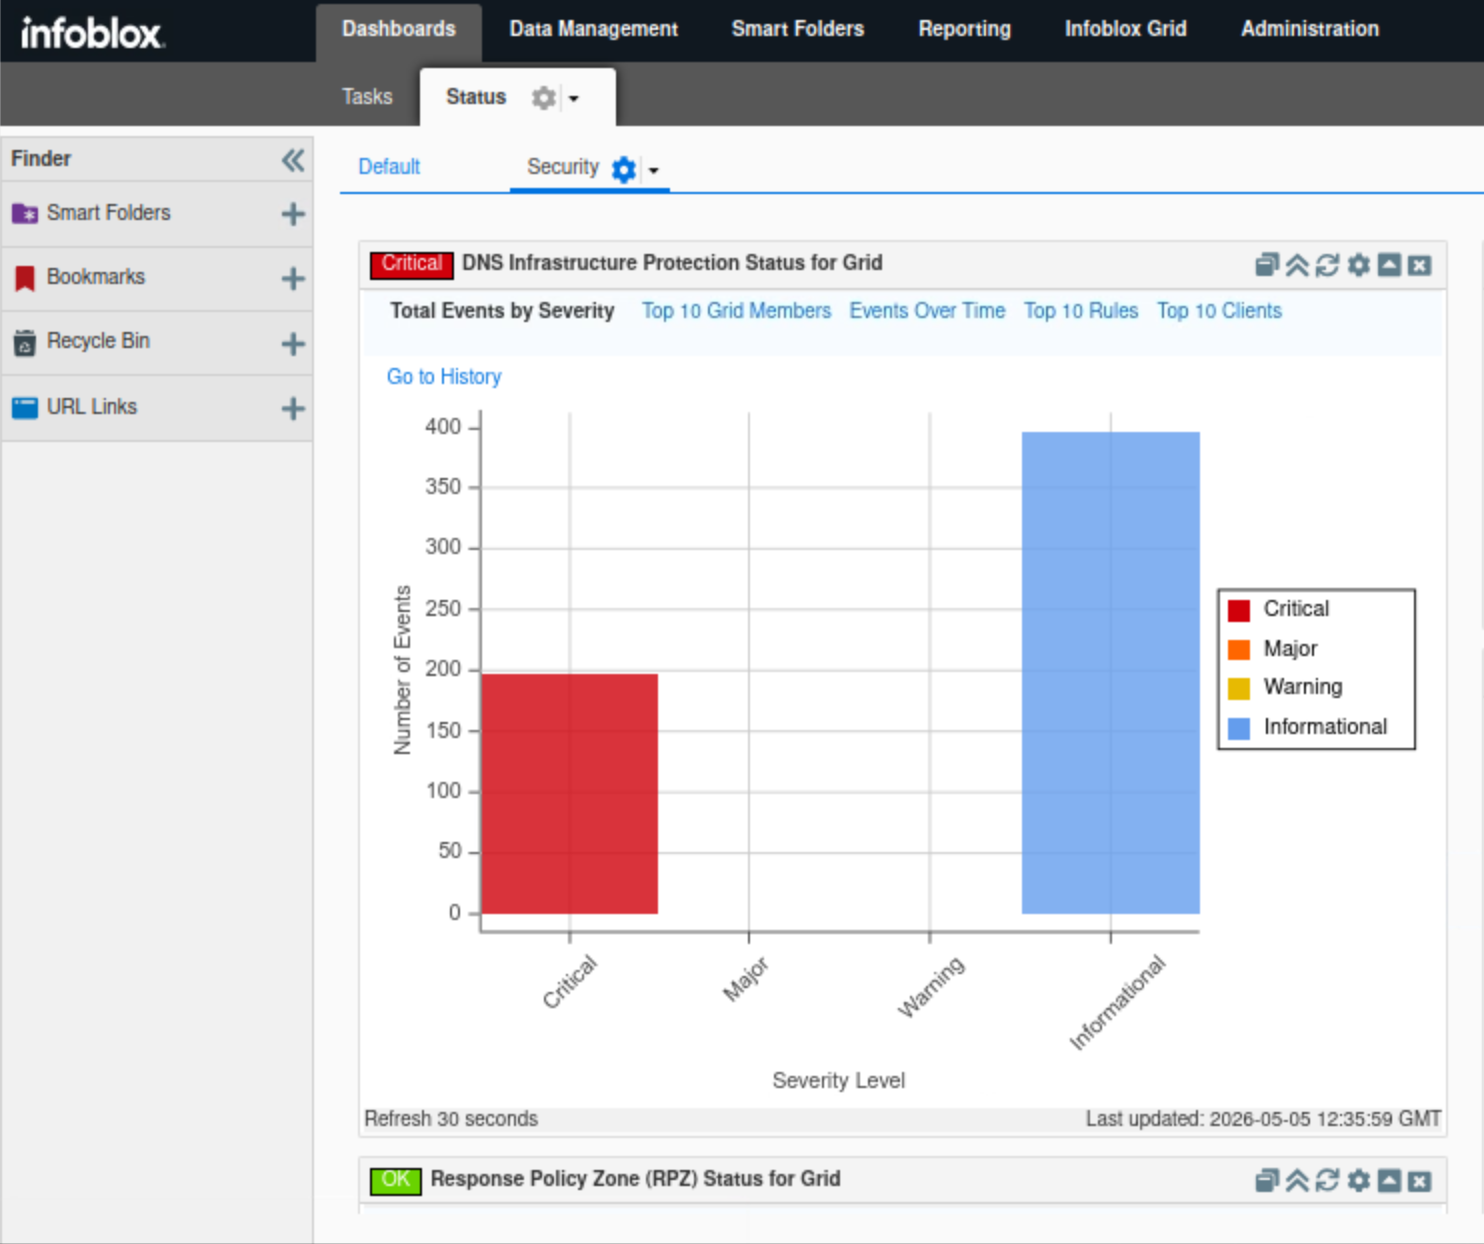
Click Total Events by Severity.
-
This tab, in bar chart format, breaks down DNS Infrastructure Protection events into four categories: Critical, Major, Minor, and Informational.
-
We can see only two categories being triggered: Critical and Informational, hover over severity columns to display the event count per column.
-
-
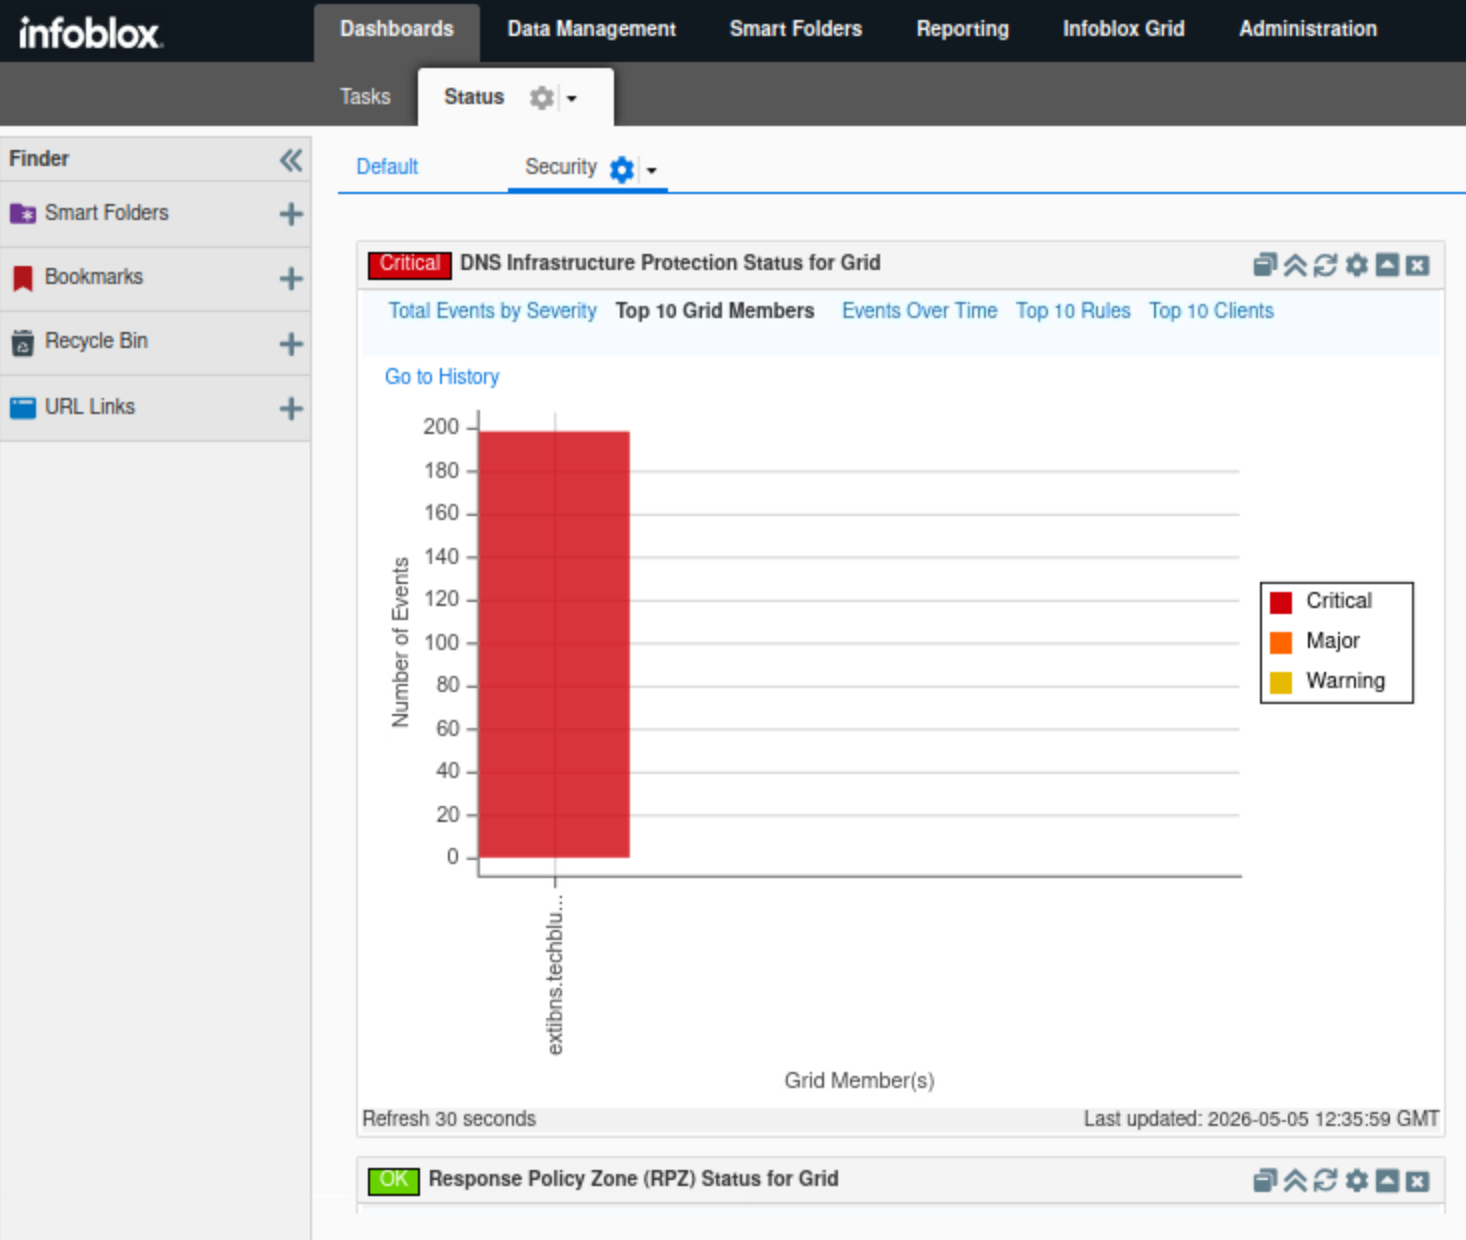
Click Top 10 Grid Members.
-
This tab, in bar chart format, breaks down the number of events triggered by each DNS Infrastructure Protection enabled member.
-
Only extibns.techblue.net is shown since it is the only DNS Infrastructure Protection enabled member, hover over member column to display the event count per member.
-
-
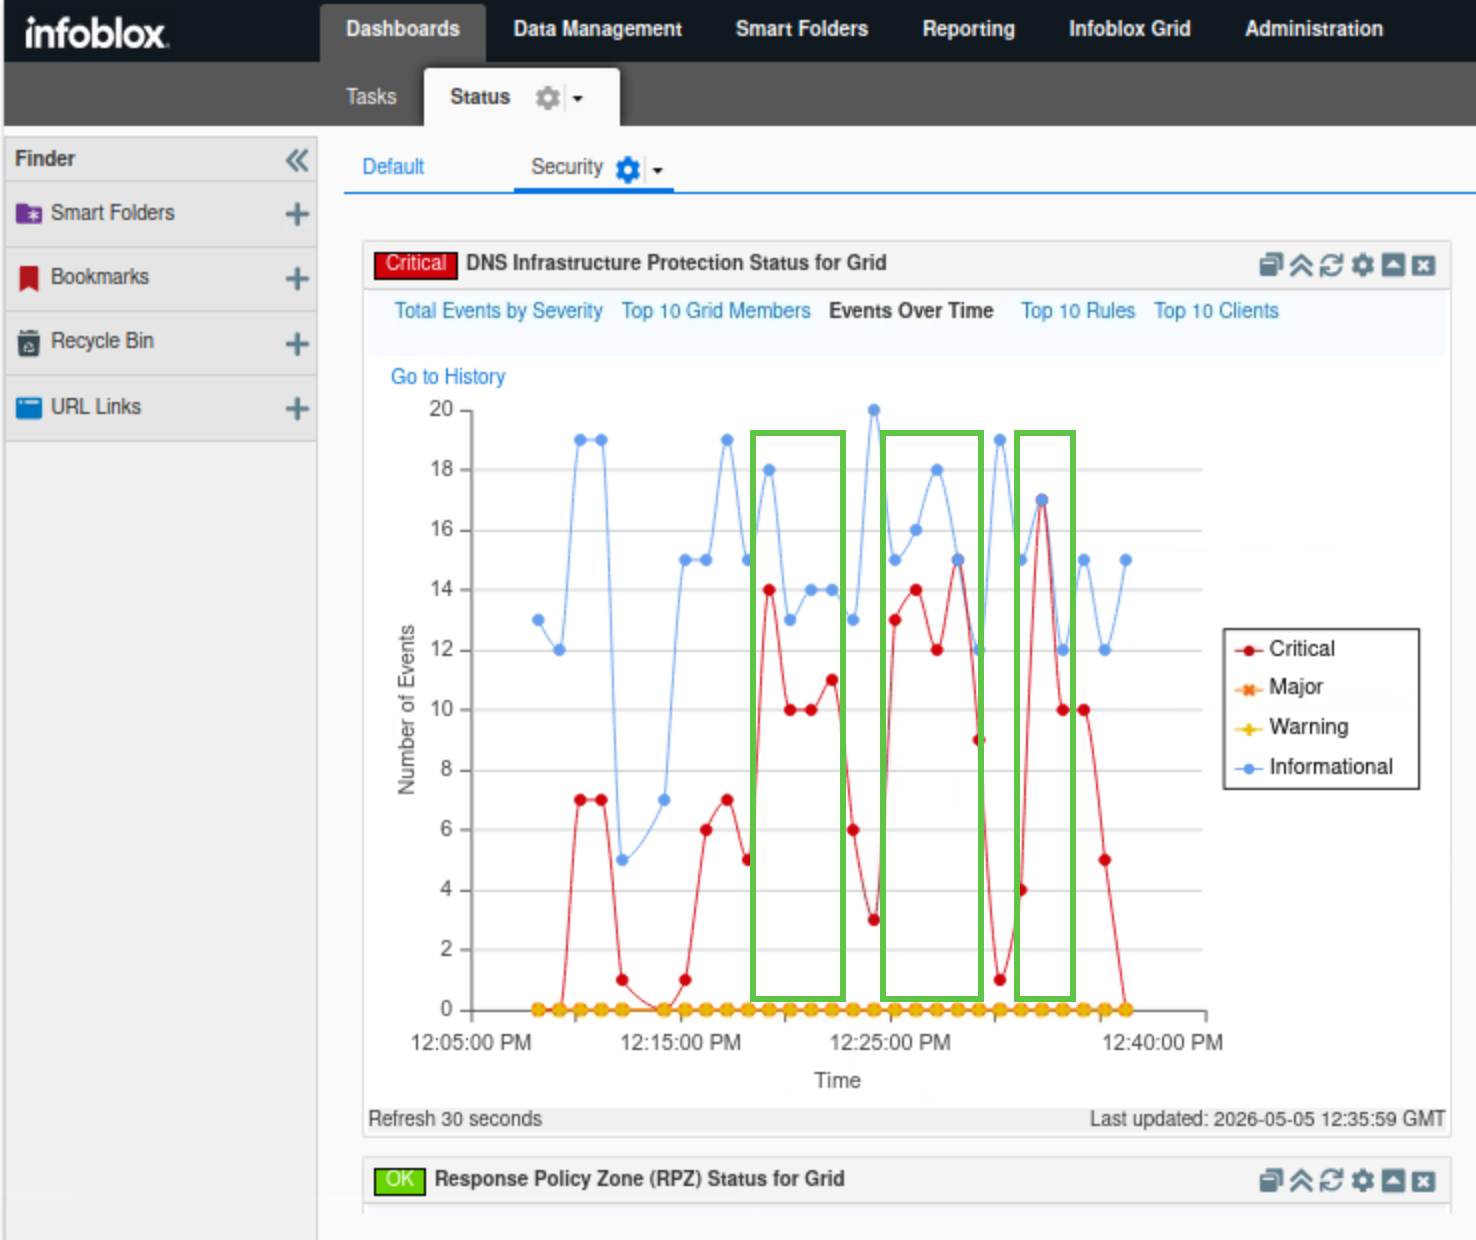
Click Events Over Time.
-
This tab displays a timeline for each event category to help visualize any recent spike of DNS traffic on the Grid.
-
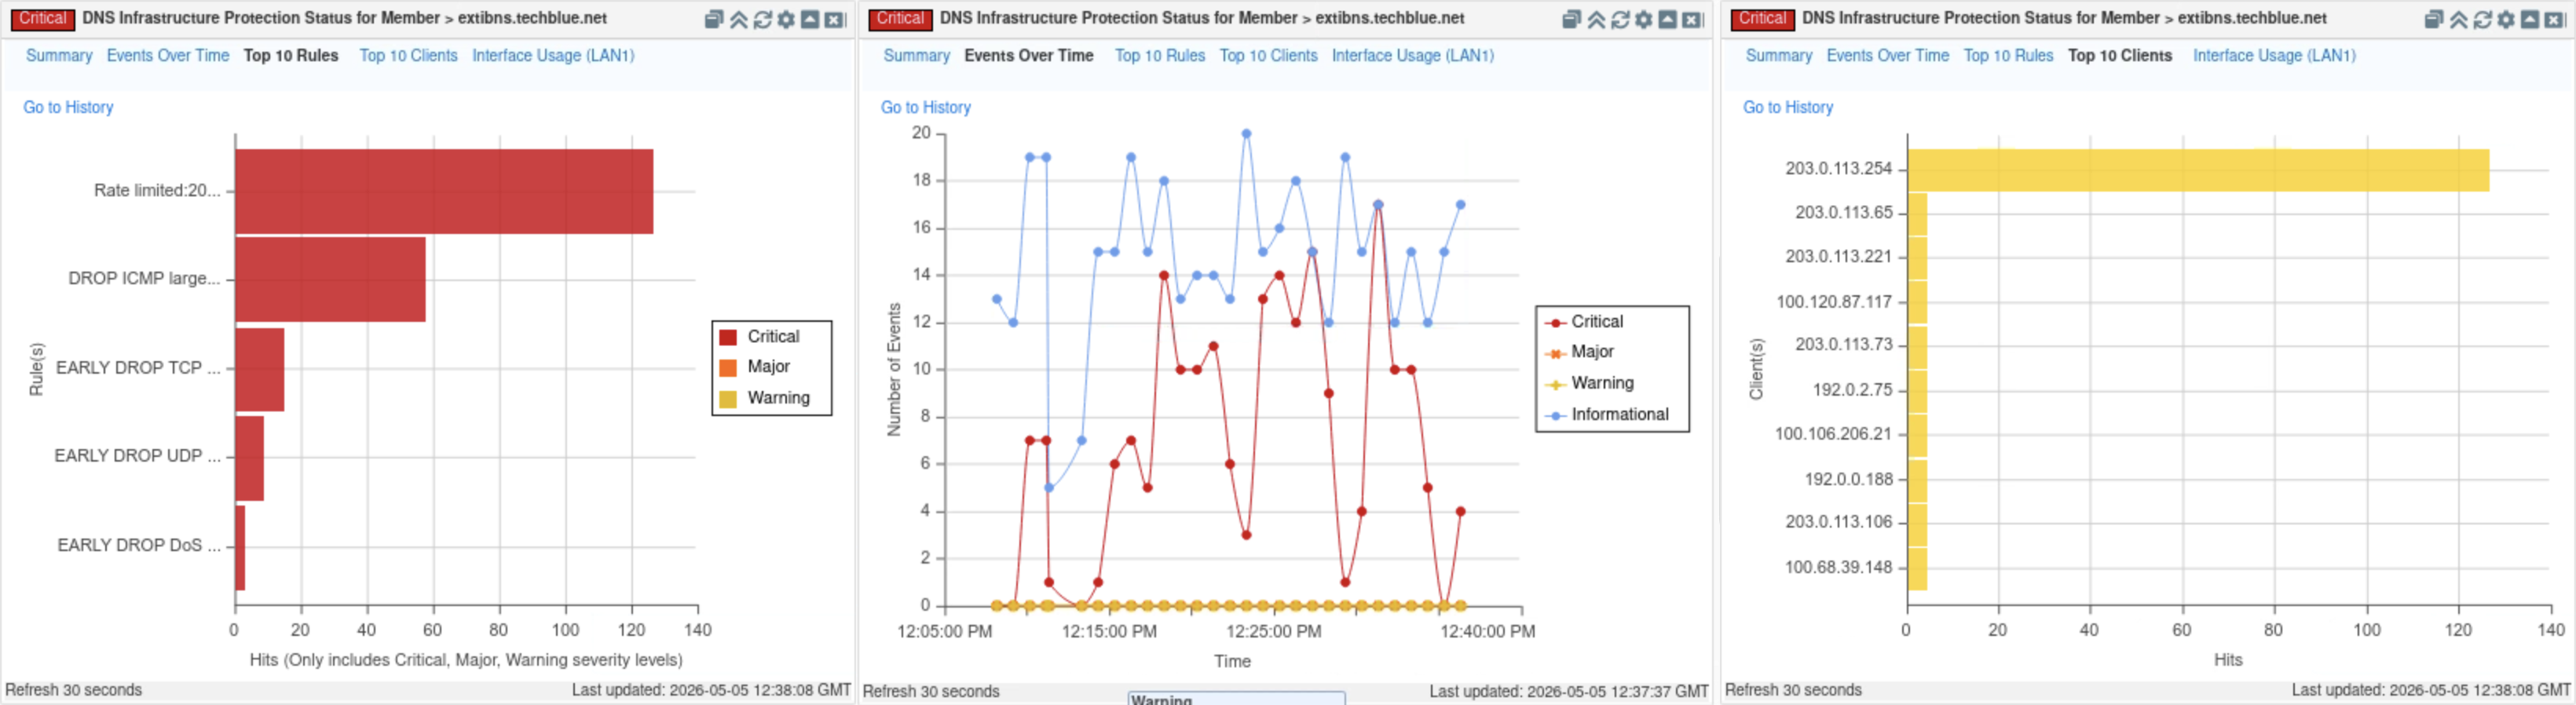
We can visualize the recent DNS spike event starting with a sudden rise in critical events triggered. Multiple spikes should appear within a 15-to-20-minute period, matching what we simulated earlier in the lab with queryperf.
-
-
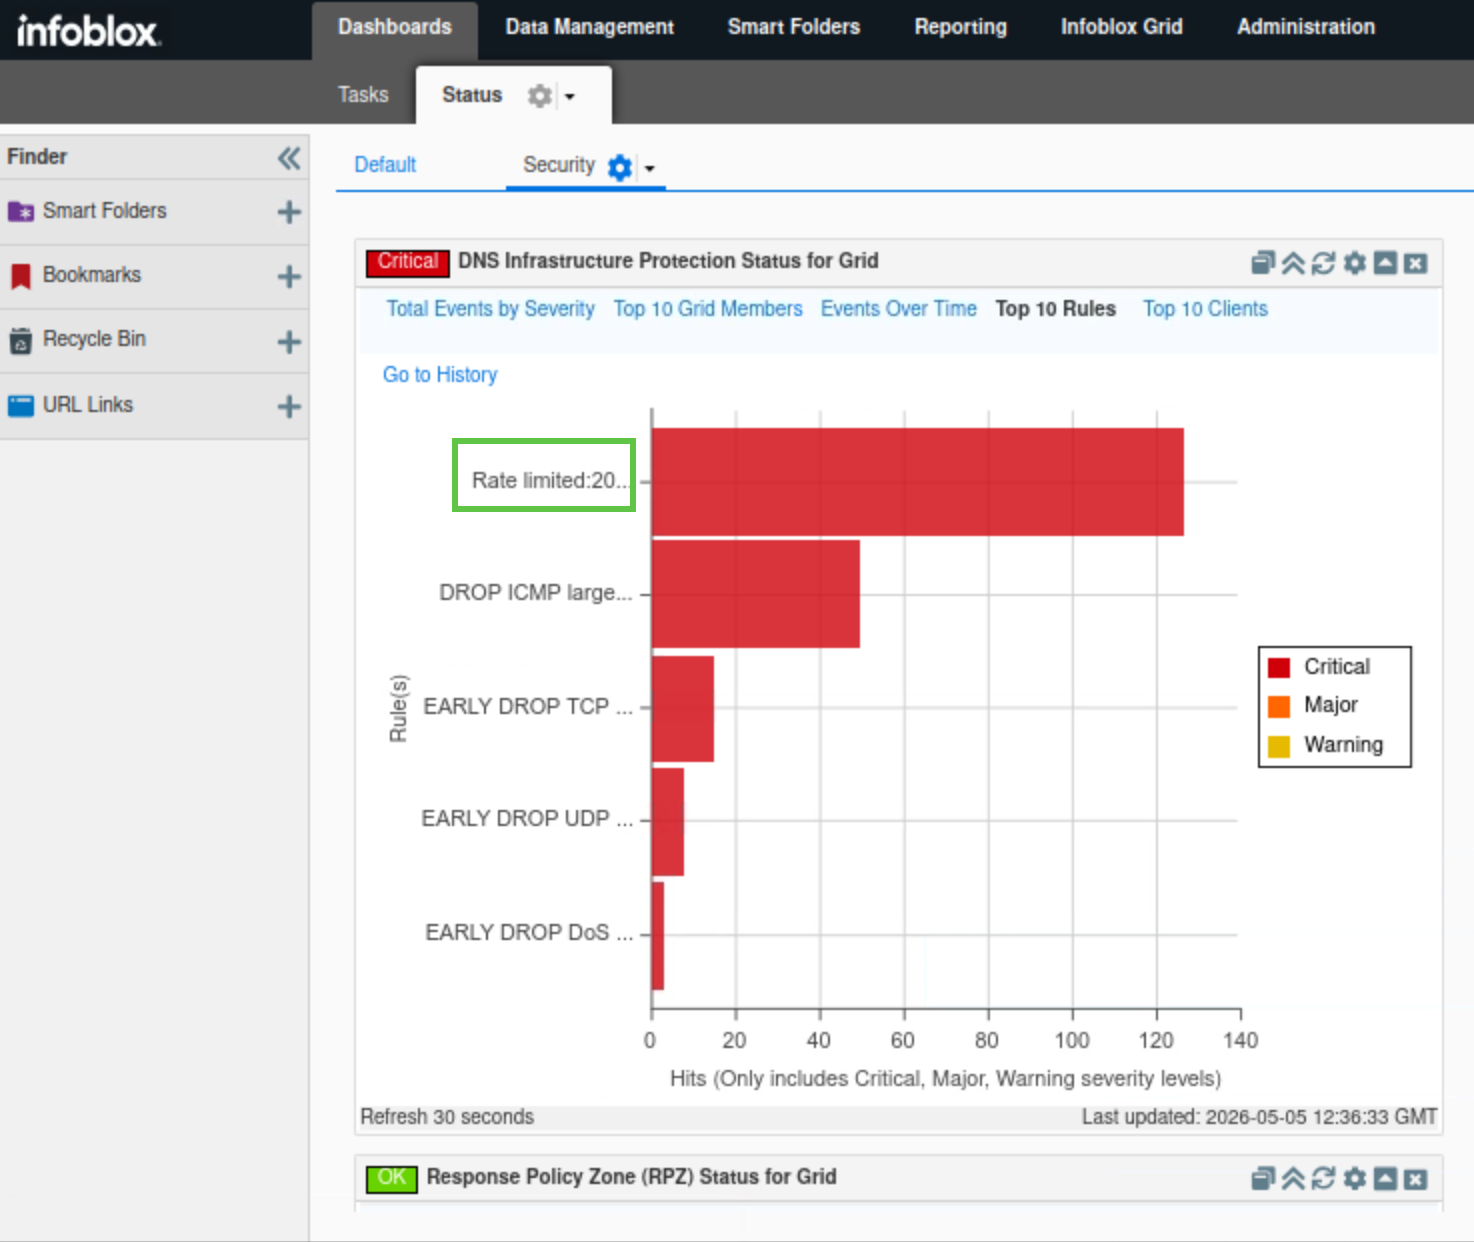
Click Top 10 Rules.
-
This tab, in bar chart format, breaks down the number of events triggered by each DNS Infrastructure Protection rule category.
-
We should see the RATE LIMITED: 203.0.113.254 rule listed, hover over the red bar to view the number of events triggered and read the full name for the triggered rule.
-
-
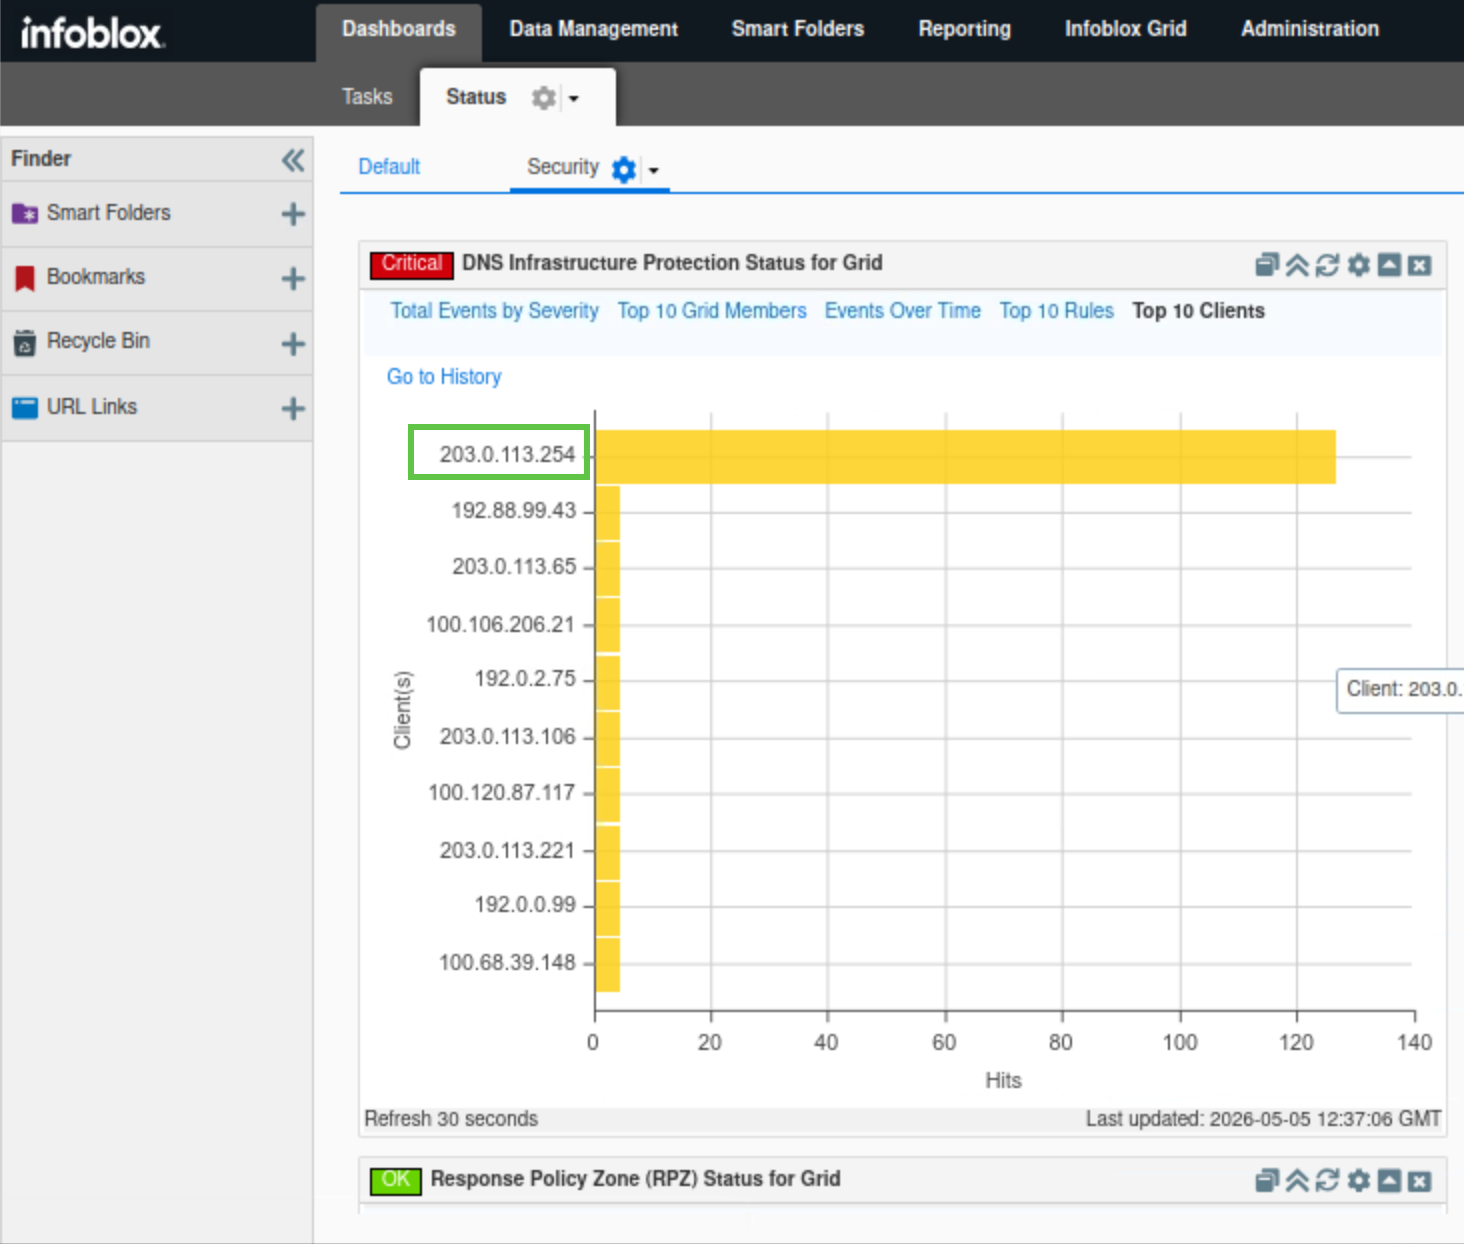
Click Top 10 Clients.
-
This tab, in bar chart format, breaks down the number of events triggered by each source.
-
We should see the 203.0.113.254 IP address listed as a top 10 client, hover over the yellow bar to view the number of events triggered.
-
-
-
-
Find the DNS Infrastructure Protection Status for member widget.
-
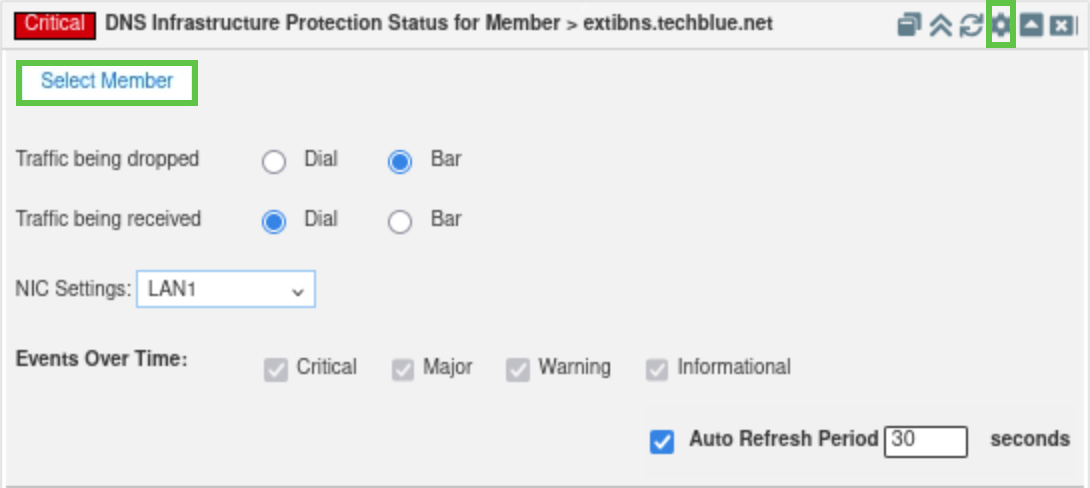
This widget shows a breakdown of the DNS Infrastructure Protection status for a manually selected Grid member, using the same five tabs: Total Events by Severity, Top 10 Grid members, Events Over Time, Top 10 Rules and Top 10 Clients.
-
To select the Grid member:
-
Click the cog wheel icon.
-
Select extibns.techblue.net.
-
-
Since extibns.techblue.net is the only member running DNS Infrastructure Protection, the information in all five tabs will be identical to what was displayed in DNS Infrastructure Protection Status for Grid widget.
-
Task 5 Solution: Investigate Action Taken and Matched Rule for the Recent Incident Using Syslog
In this task, we want to find which rule was triggered by the traffic spike from 203.0.113.254, so we may adjust its settings.
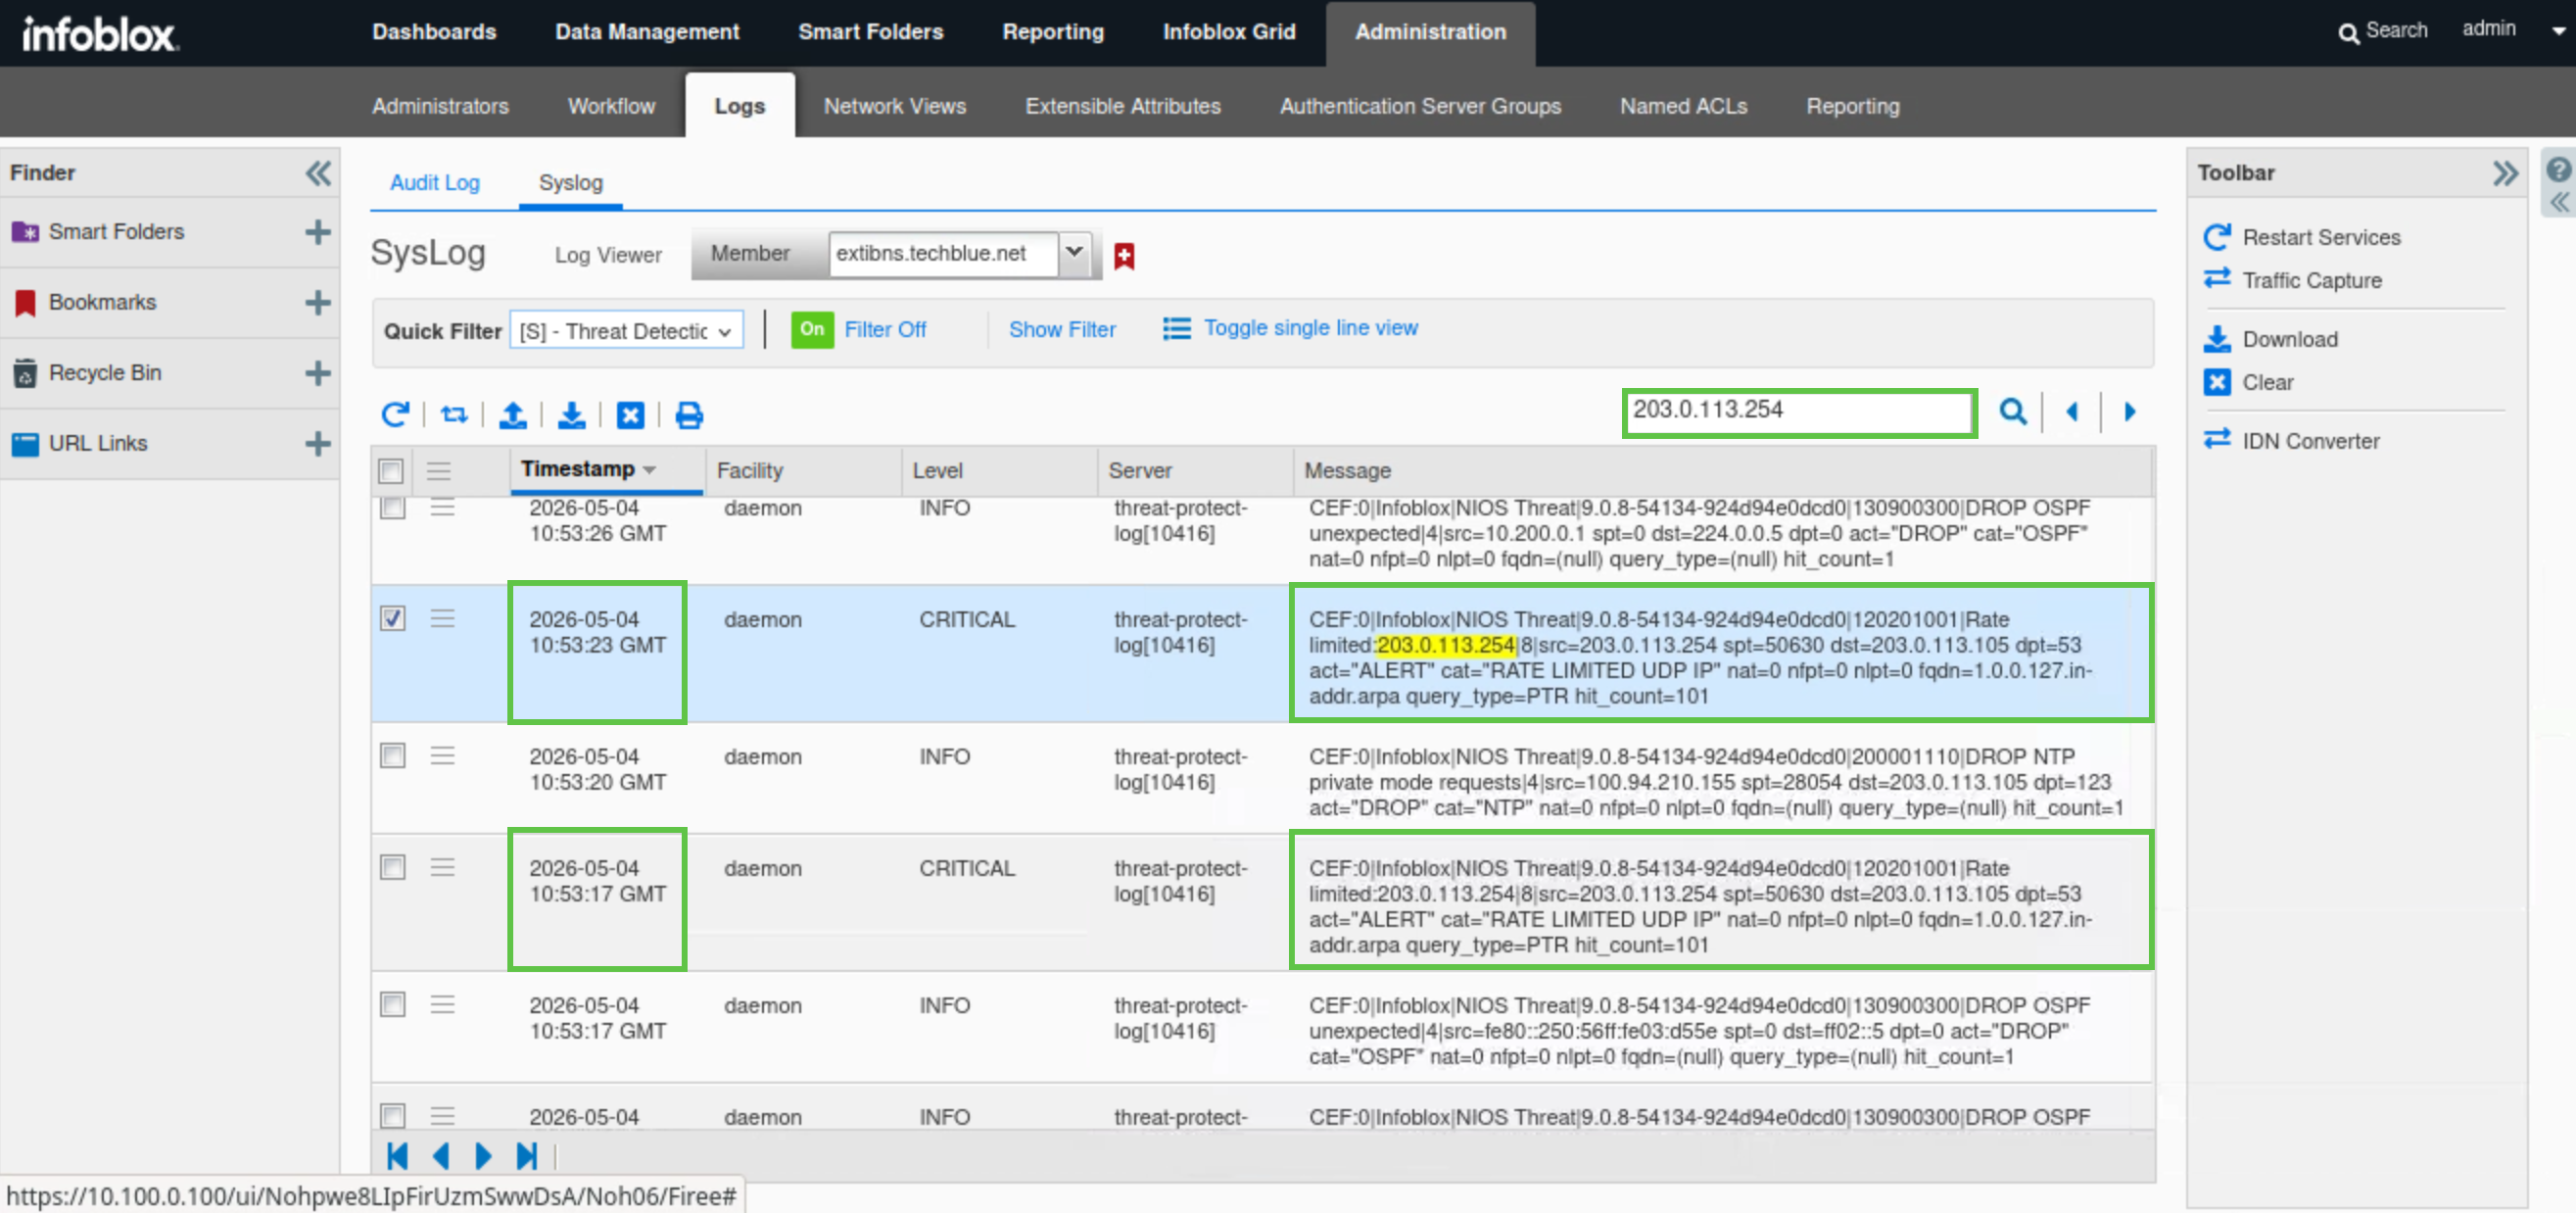
Acting as the security administrator, you will use the syslog viewer in the Grid Manager to focus specifically on Threat Detection Event Logs for extibns.techblue.net and filter them by the client IP. By reviewing these entries, you will find the custom rule ID (120201001) was matched, that the action taken was ALERT with a RATE LIMITED UDP IP category, and that events occurred in 5-second intervals, demonstrating that DNS Infrastructure Protection successfully rate-limited the misbehaving client while keeping the service available.
-
Navigate to Administration → Logs → Syslog.
-
Choose extibns.techblue.net from the Log Viewer drop-down menu.
-
Click the Toggle multi-line view link.
-
Select Threat Detection Event Logs from the Quick Filter drop-down list.

-
Enter the IP address 203.0.113.254 in the search bar.
-
Review syslog entries with the IP address 203.0.113.254. We are looking for the rate limited rule ID that the simulated behavior has triggered.
-
The screenshot shows two syslog entries, 5-seconds apart. Both of them are in the category of RATE LIMITED UDP IP.
-
We can see the custom rule ID (120201001) in both log entires. This is the rule ID we will investigate next.
-
Task 6 Solution: Investigate Incident History using Reporting Server Dashboards and Reports
It can take up to 15 minutes for the Reporting Server to pull data from the Grid and populate its dashboards and reports. This delay applies only to this simulated lab environment because the Grid and Reporting Server haven't had enough time to sync.
In this task, we will use the Reporting Server to add historical context to the DNS spike identified in the NIOS Security Dashboard and syslog.
After allowing time for data collection, you will explore several DNS Infrastructure Protection reports to confirm that only extibns.techblue.net has DNS-IP enabled, verify that all RATE LIMITED UDP IP events map to your custom rule (Rule ID 120201001), and check whether the suspect client 203.0.113.254 has triggered any additional rules in an unusual or excessive way.
By comparing event counts across Event Count by Member, Event Count by Category, Event Count by Rule, and Top Rules Logged by Source, you will build a complete historical picture of the incident, correlating affected members, categories, rules, and sources.
Finally, you will consolidate your findings using the DNS Infrastructure Protection Event Count Dashboard and export it as a PDF to create a concise, management-ready summary of the investigation.
-
Navigate to Reporting → Reports.
-
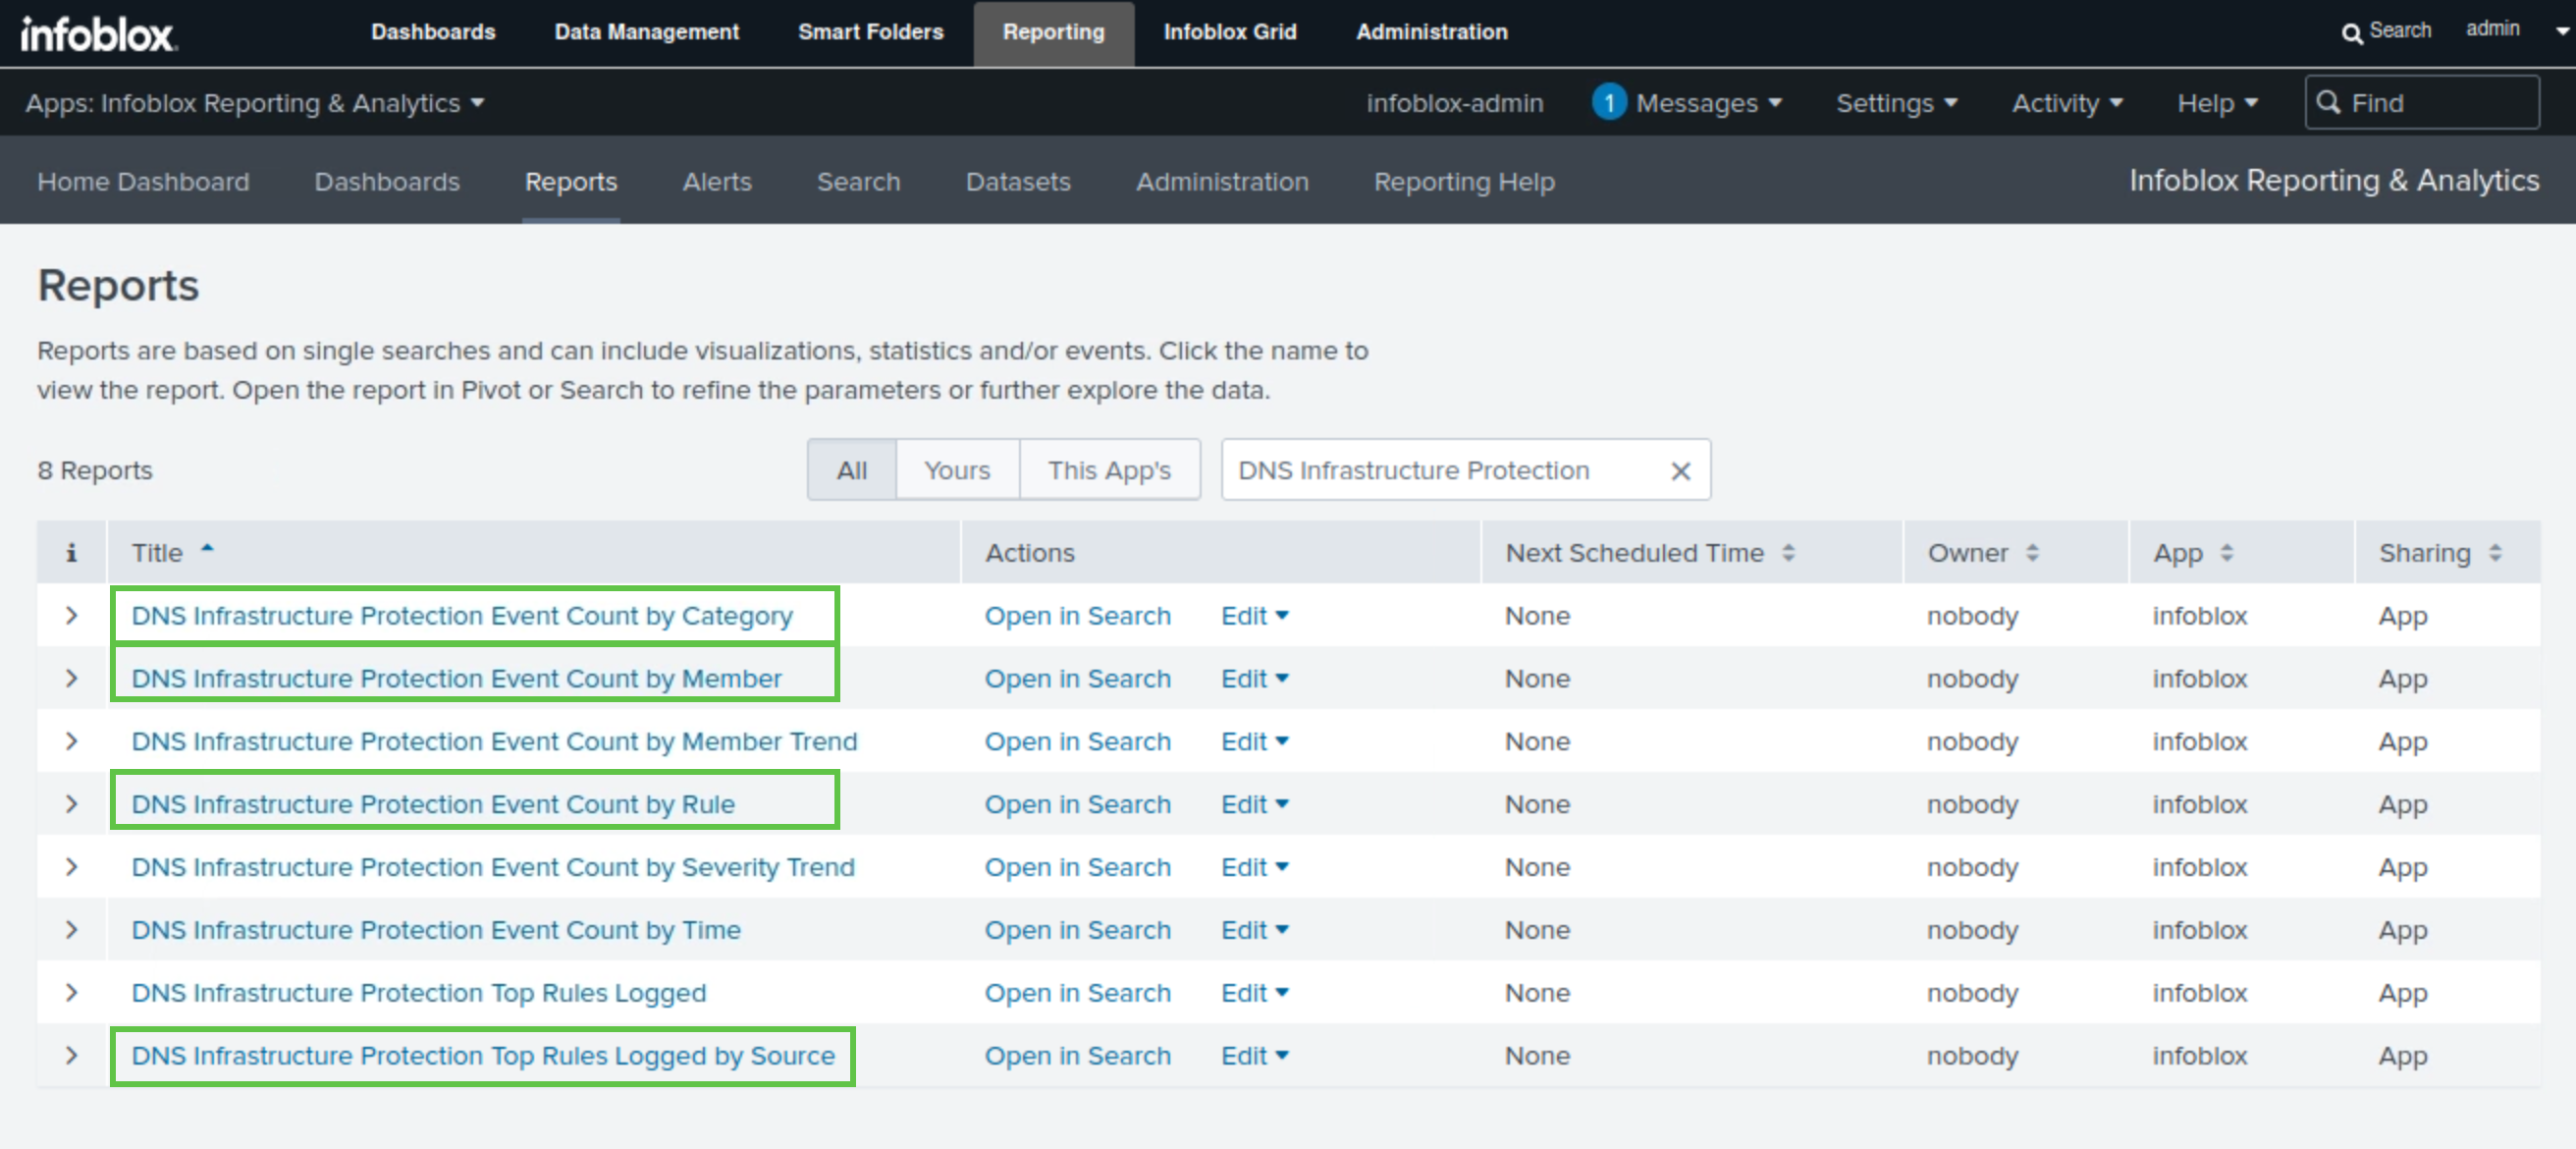
There are eight default reports available on the Reporting Server; in this lab, we will focus on five of them:
-
The DNS Infrastructure Protection Event Count by member, allows us to track if other members have had DNS Infrastructure Protection enabled in the past.
-
The DNS Infrastructure Protection Event Count by category, will be used to validate that historically our Grid has rate-limited UDP traffic and to track the total number of UDP rate-limiting events triggered.
-
DNS Infrastructure Protection Event Count by rule, will be used to track that our specific custom rule RATE LIMITED UDP IP (Rule ID 120201001) has been historically triggered for all the rate-limited UDP events and to track the alert count for the custom rule RATE LIMITED UDP IP.
-
DNS Infrastructure Protection Event Count by Source, allows us to historically track all DNS Infrastructure Protection rules triggered by our suspect IP address 203.0.113.254 and validate if the IP has not triggered any other rule excessively or unexpectedly.
-
-
-
Type DNS Infrastructure Protection in the filter box.
-
Select DNS Infrastructure Protection Event Count by member.
-
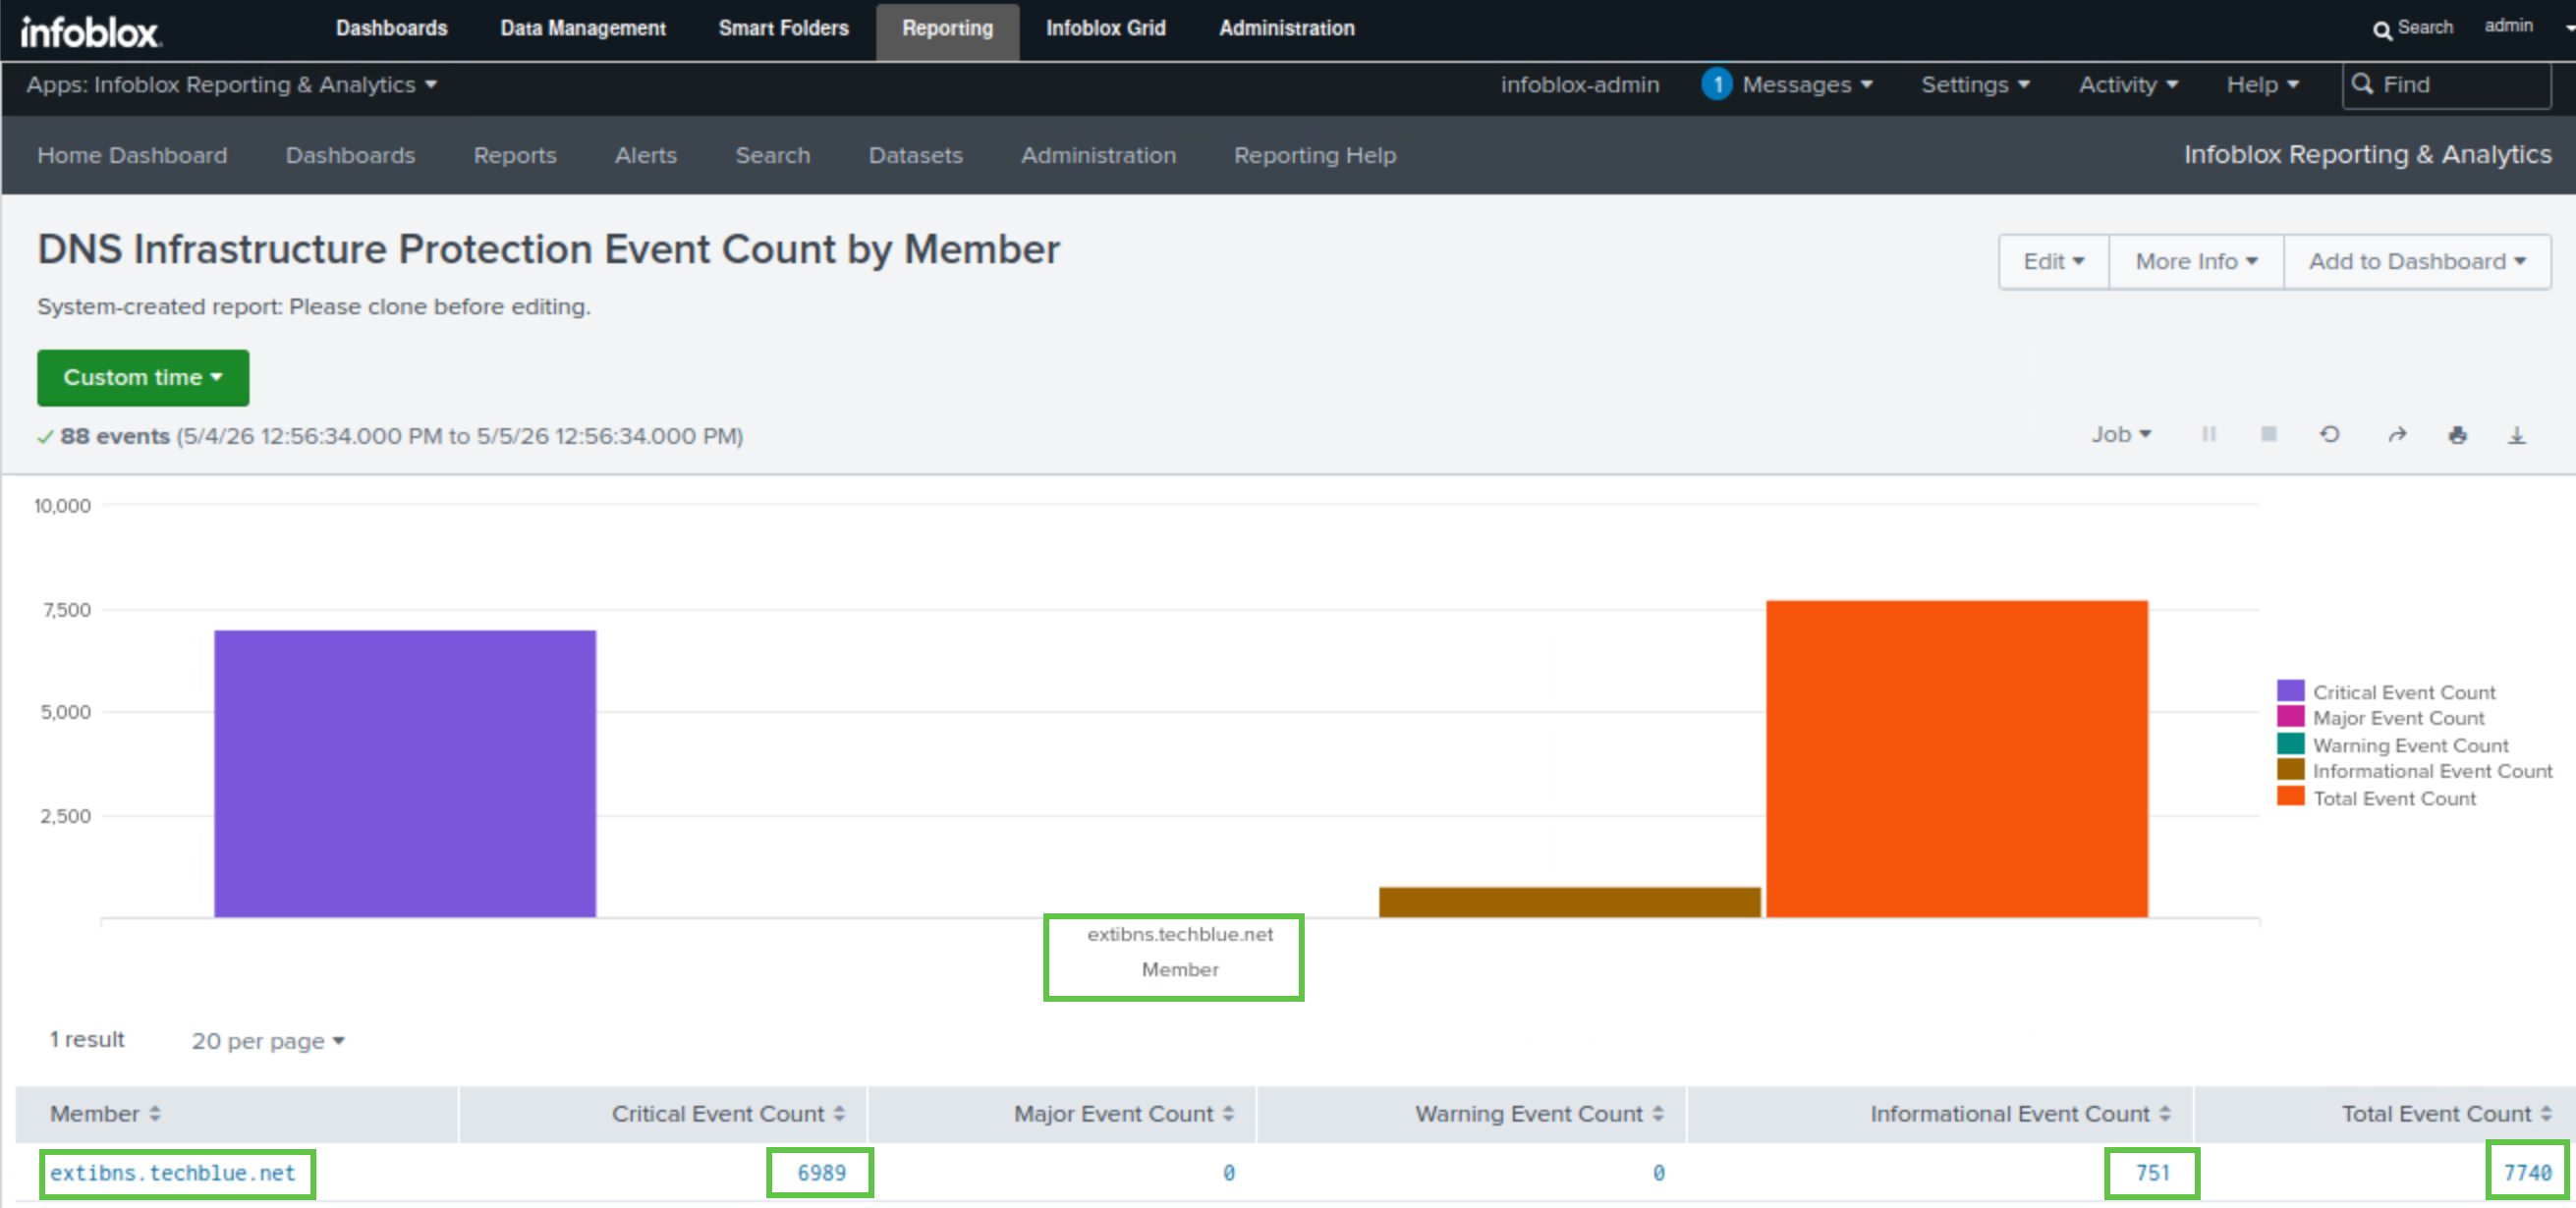
This report displays each member's total DNS Infrastructure Protection event count, broken down into severity levels in bar chart and table formats.
-
The graph and table should only display information related to extibns.techblue.net. This indicates that DNS Infrastructure Protection has only been enabled on that member. The whole graph will be dedicated to it, and we can clearly see the total number of events and its breakdown in different severity levels.
-
-
Click on Reports to navigate back to the main Reports page.
-
Type DNS Infrastructure Protection in the filter box, one more time.
-
Select DNS Infrastructure Protection Event Count by category.
-
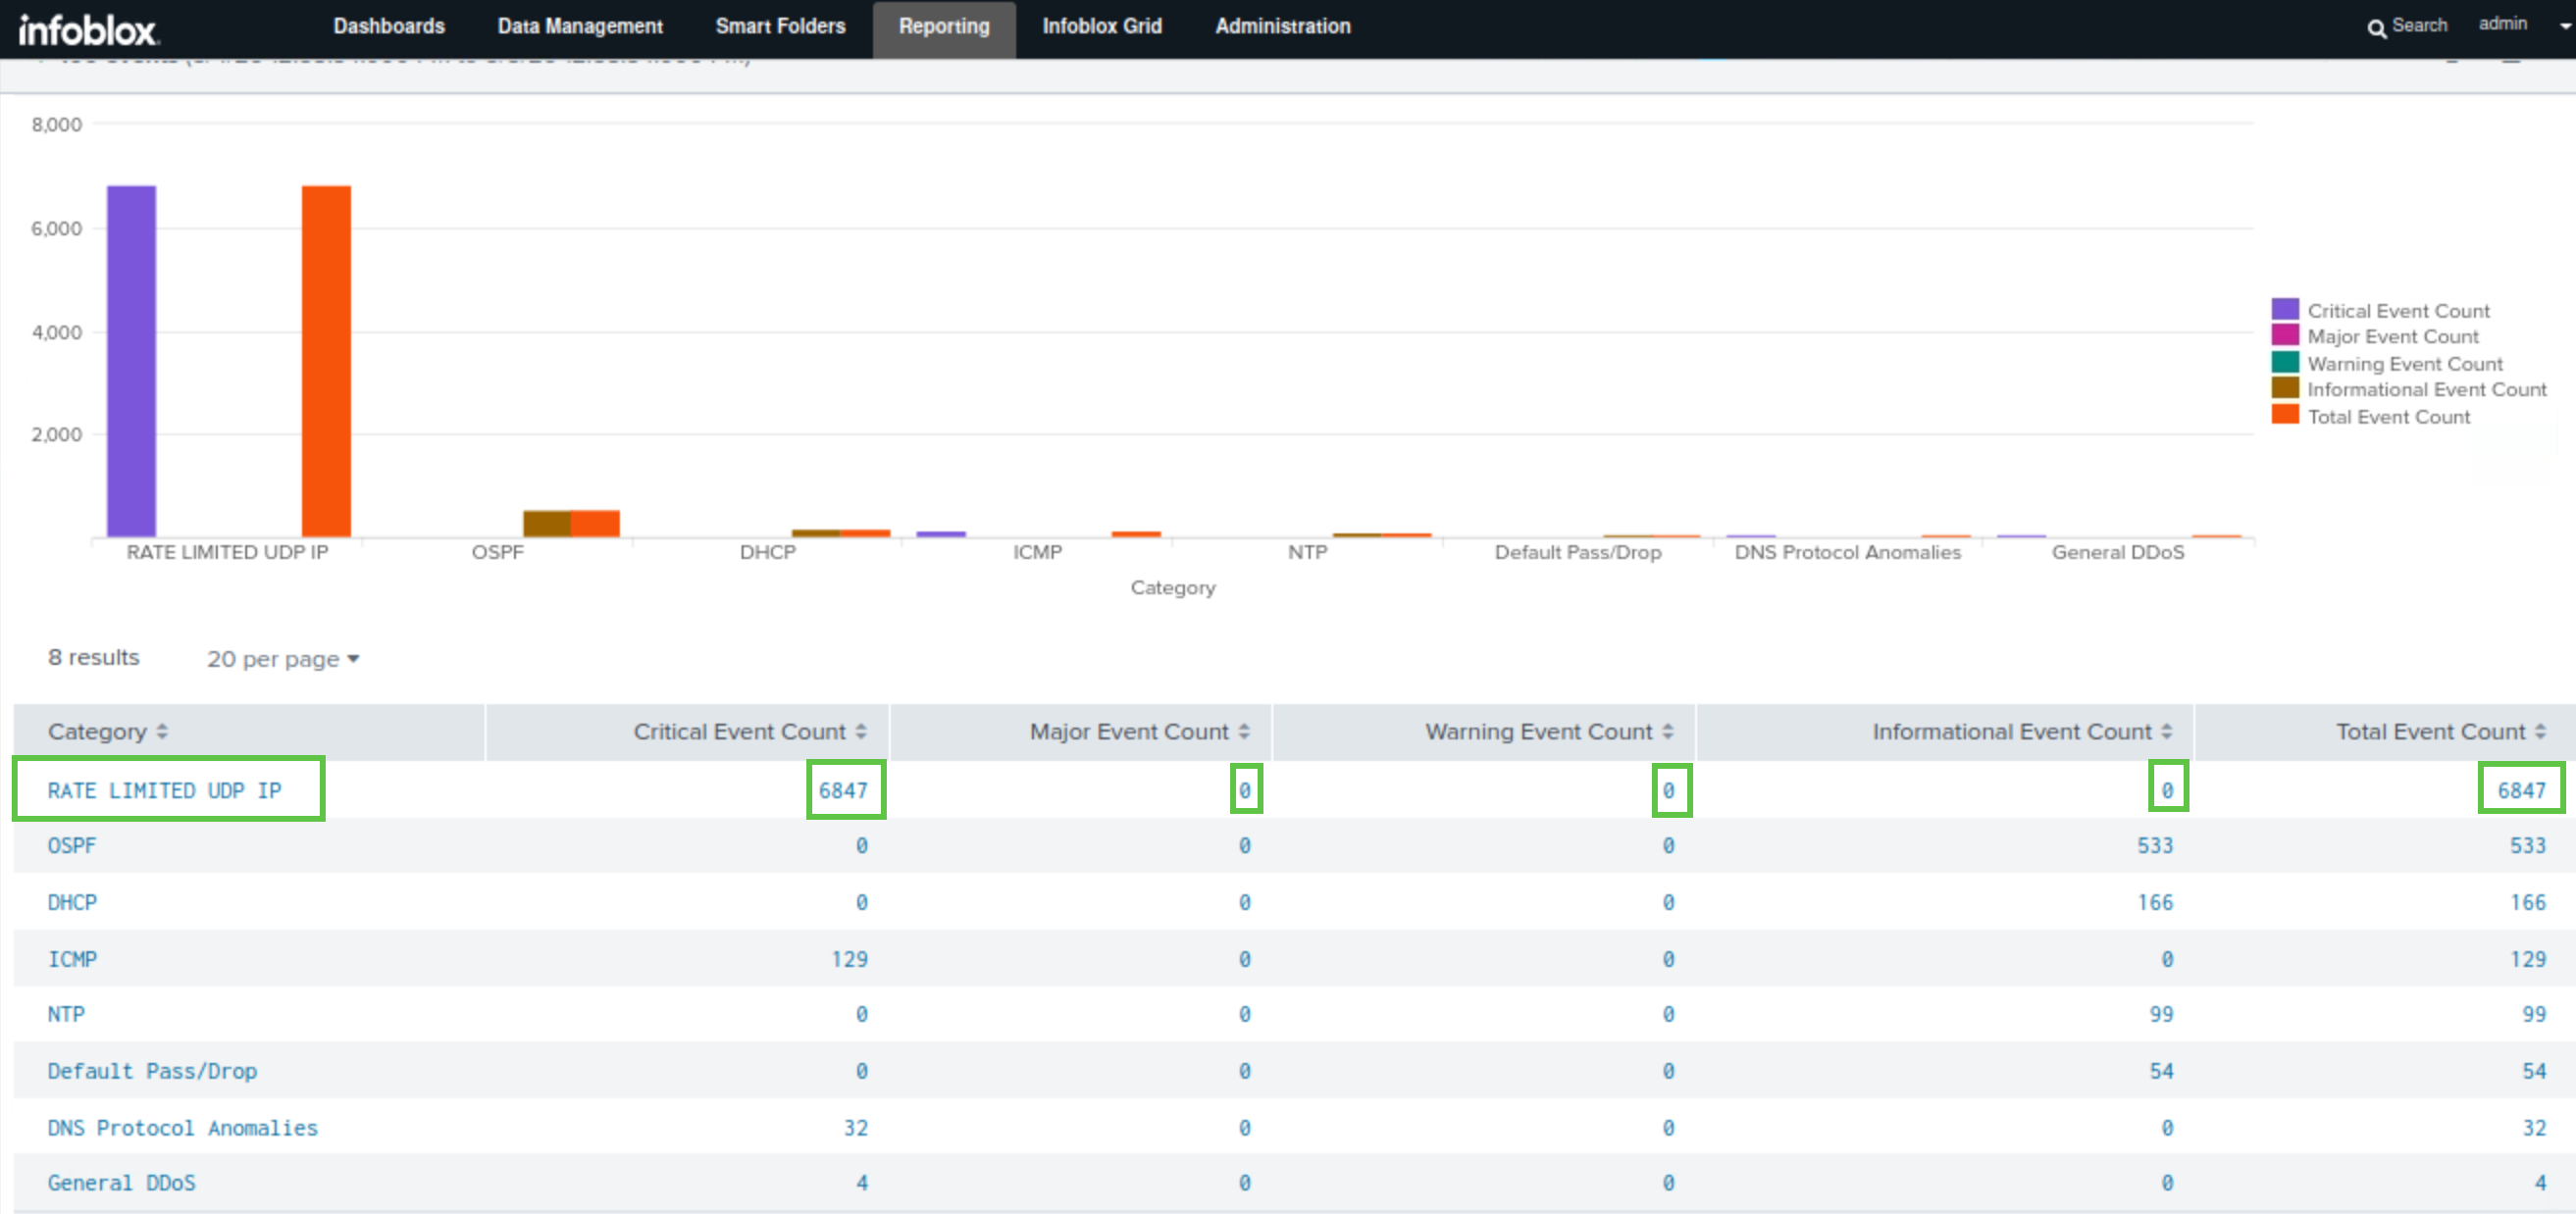
This report shows the total number of DNS Infrastructure Protection events and their severity per category in bar chart and table formats.
-
We look for the RATE LIMITED UDP IP category and how its events break down by severity. All events for this category should be Critical, matching findings from the NIOS Security dashboard and syslog.
-
We will track the total number of events triggered for the RATE LIMITED UDP IP category, comparing it to events triggered by the custom rule (Rule ID 120201001) in the next step, to verify if it was the only rule triggered.
-
-
Click on Reports to navigate back to the main Reports page.
-
Type DNS Infrastructure Protection in the filter box, one more time.
-
Select DNS Infrastructure Protection Event Count by rule.
-
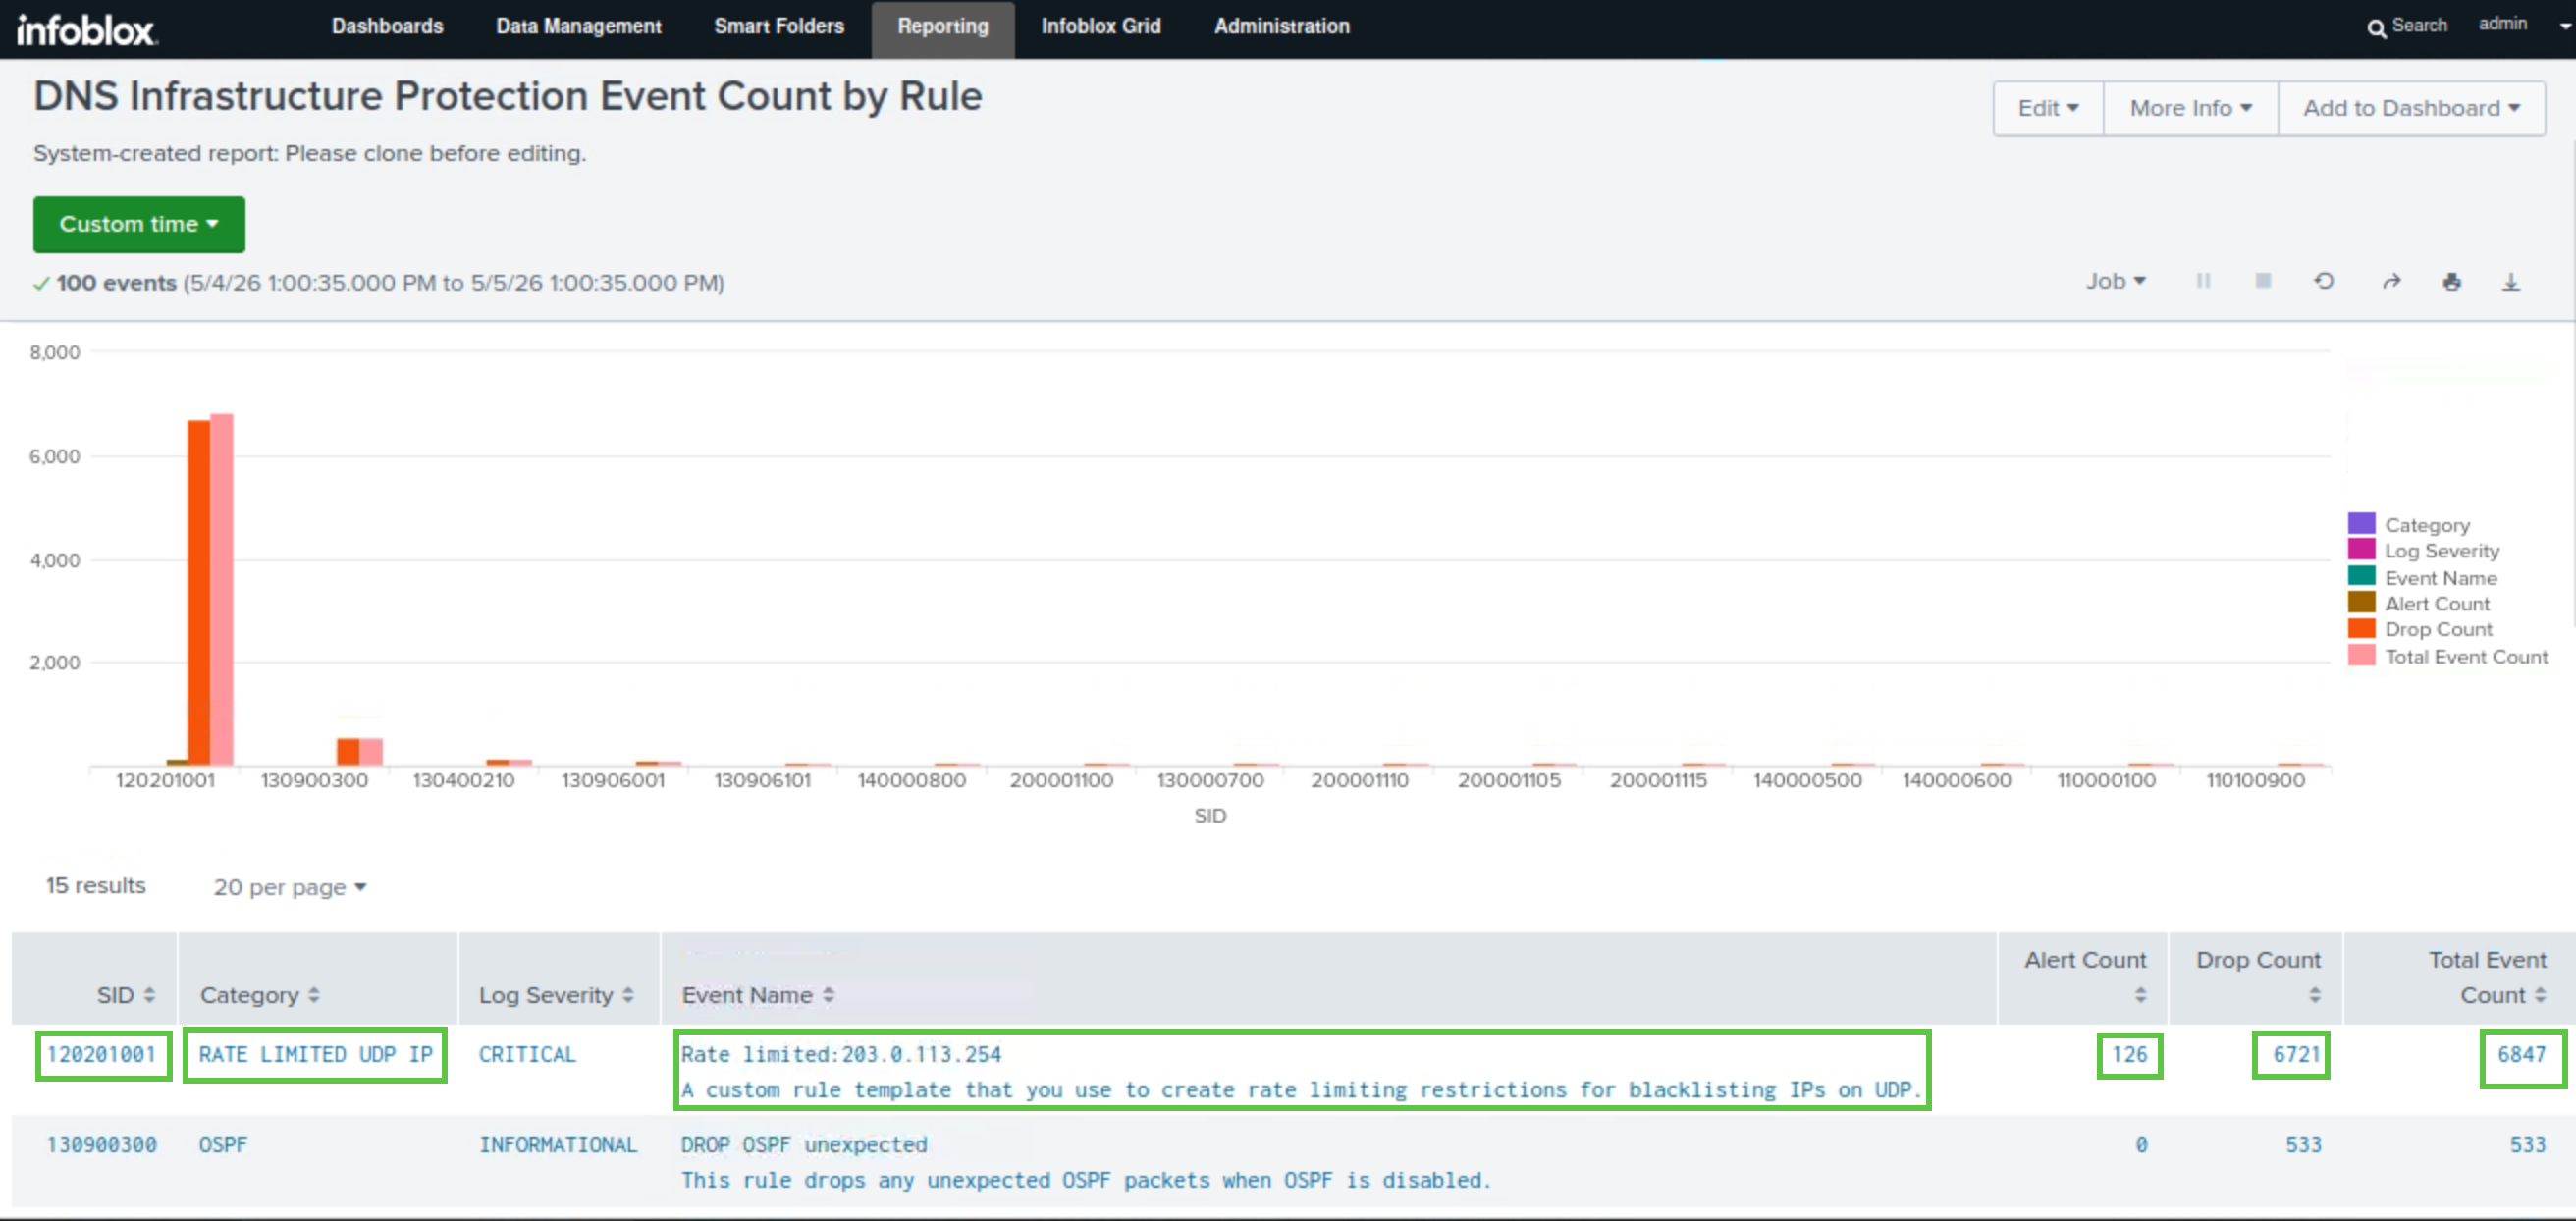
This report displays all DNS Infrastructure Protection rules, the total triggers per rule, and the actions taken, displayed in bar chart and table formats.
-
We will use this report to verify that our custom rule (Rule ID 120201001) triggered for all rate-limited UDP events and to identify any other triggered rules. In our scenario, only the custom rule (Rule ID 120201001) triggered, as its total events match those of the RATE LIMITED UDP IP category from the previous report.
-
Note the Alert Count for the custom rule RATE LIMITED UDP IP, we will compare it to the total number of events triggered by the suspect IP address 203.0.113.254 to check if it has triggered other DNS Infrastructure Protection rules and whether that was unexpected or excessive, in a later step.
-
-
Click on Reports to navigate back to the main Reports page.
-
Type DNS Infrastructure Protection in the filter box, one more time.
-
Select DNS Infrastructure Protection Top Rules Logged by Source.
-
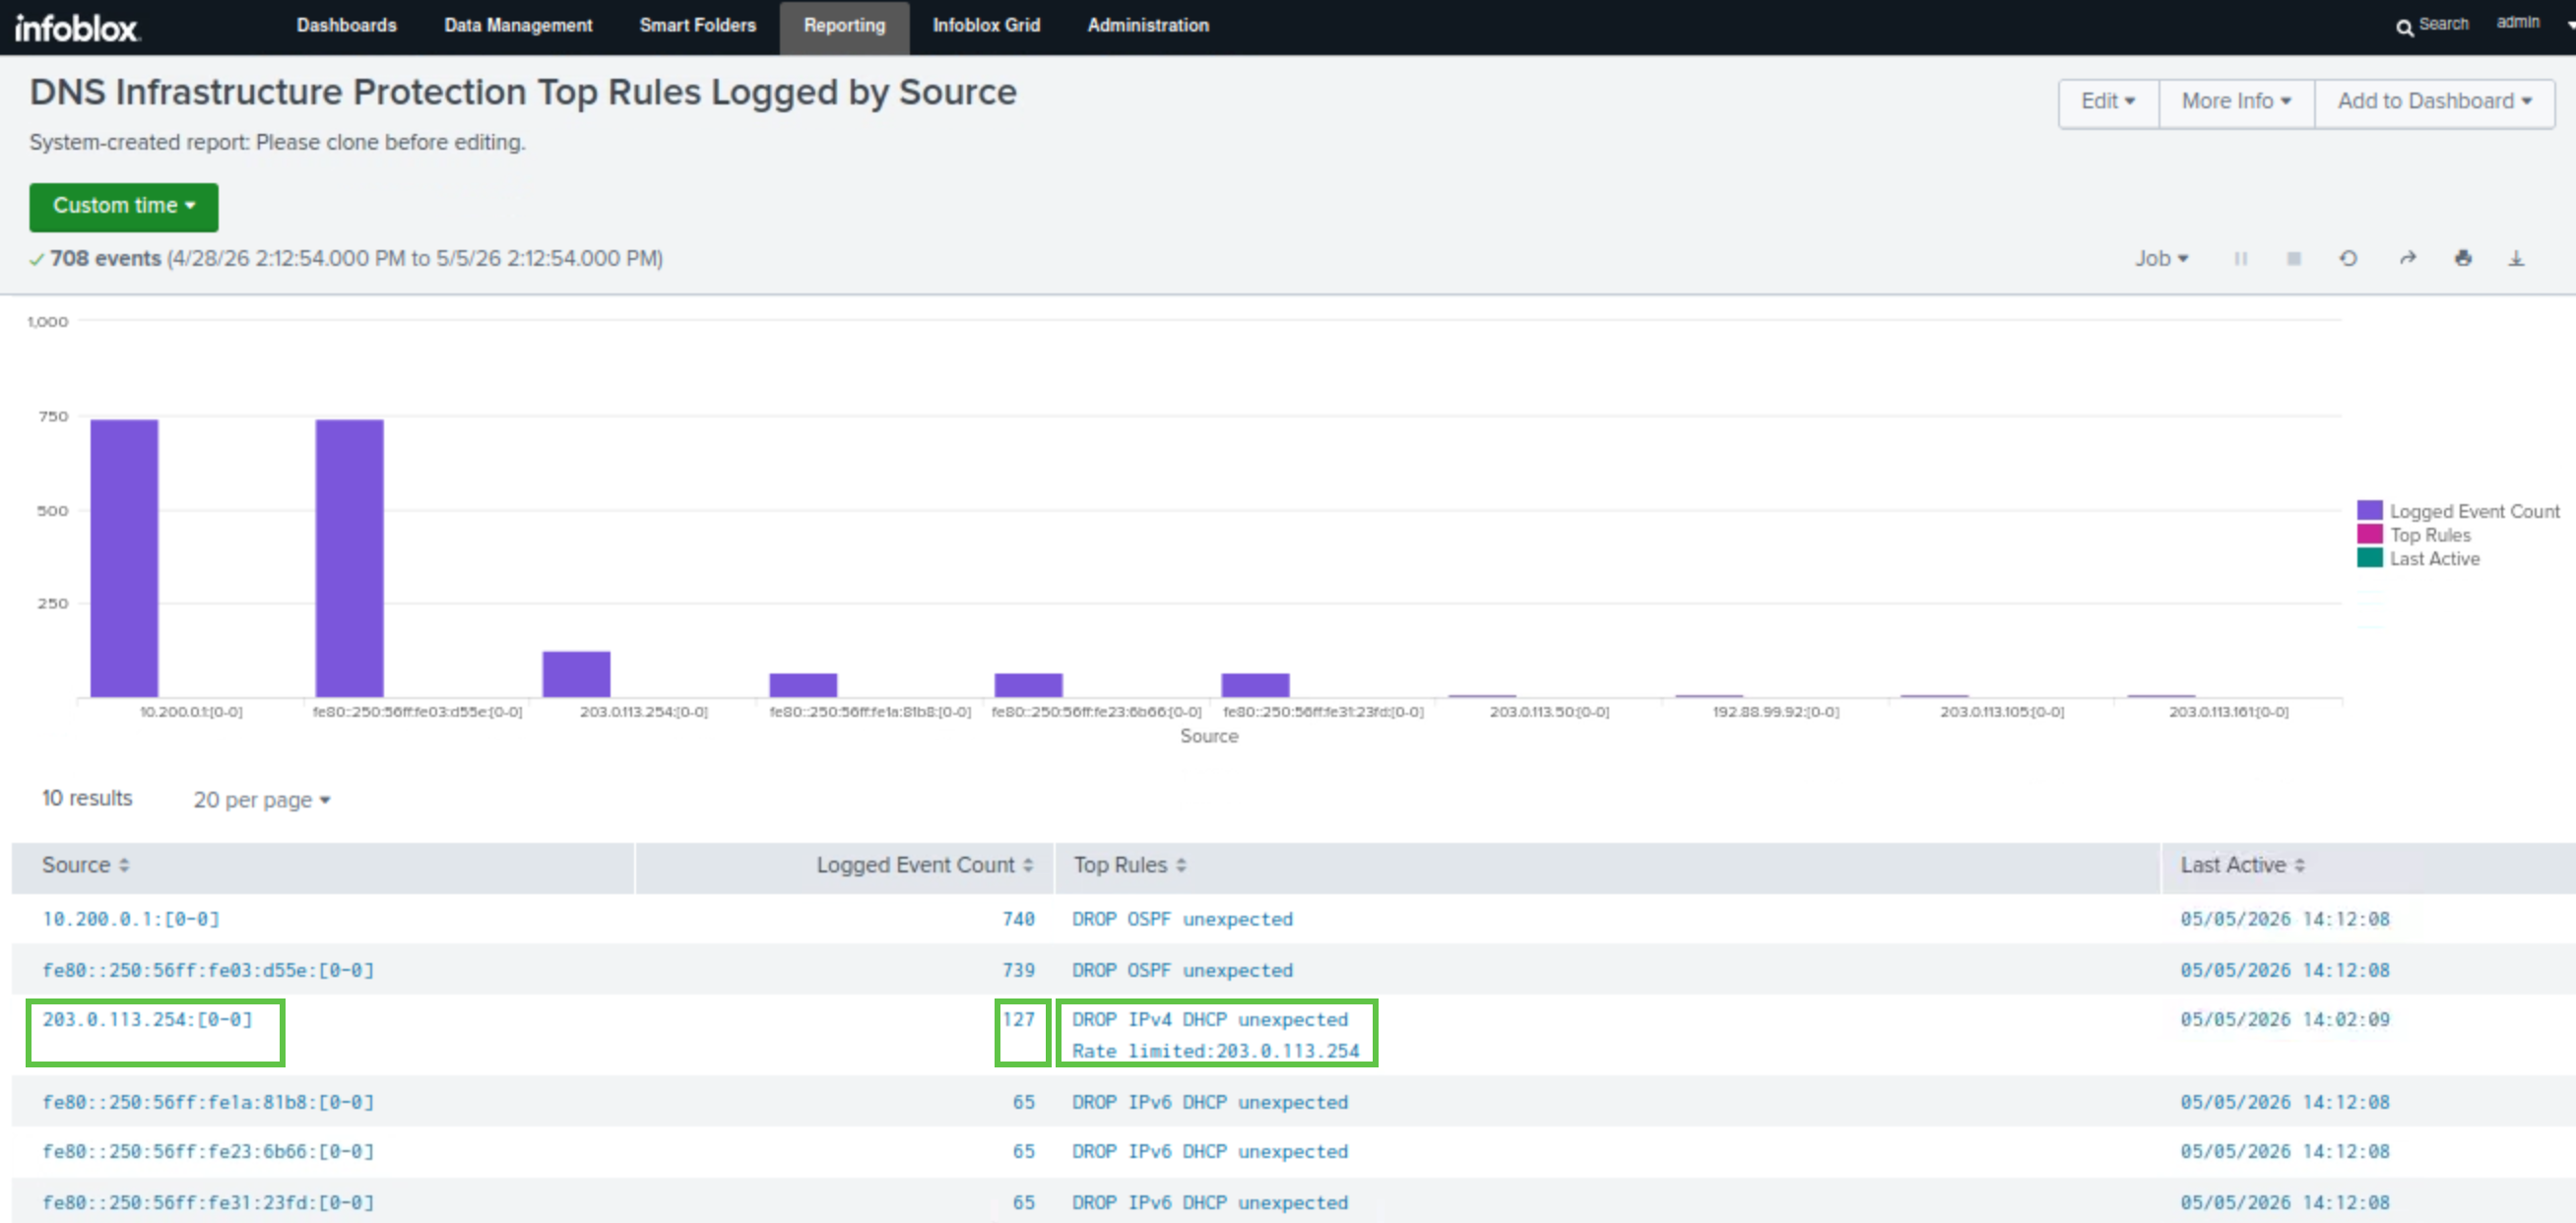
This report lists all triggered DNS Infrastructure Protection rules per IPv4 and IPv6 addresses that, along with the total number of events for each trigger.
-
We will use this report to check if our suspect IP address 203.0.113.254 triggered other rules and whether those triggers are unexpected or excessive. In our scenario, the total events count for IP address 203.0.113.254 closely matches the alert count we noted earier for our custom rule RATE LIMITED UDP IP from the previous report. Other triggered events like DROP IPv4 DHCP unexpected or EARLY DROP TCP non-DNS query may be present in your report and are common, as they are triggered by other sources, and fall within a reasonable range, confirming this IP has not triggered any other rule excessively or unexpectedly.
-
-
Navigate to Reporting → Dashboards.
-
Type DNS Infrastructure Protection in the filter box.
-
Find the DNS Infrastructure Protection Event Count Dashboard
-
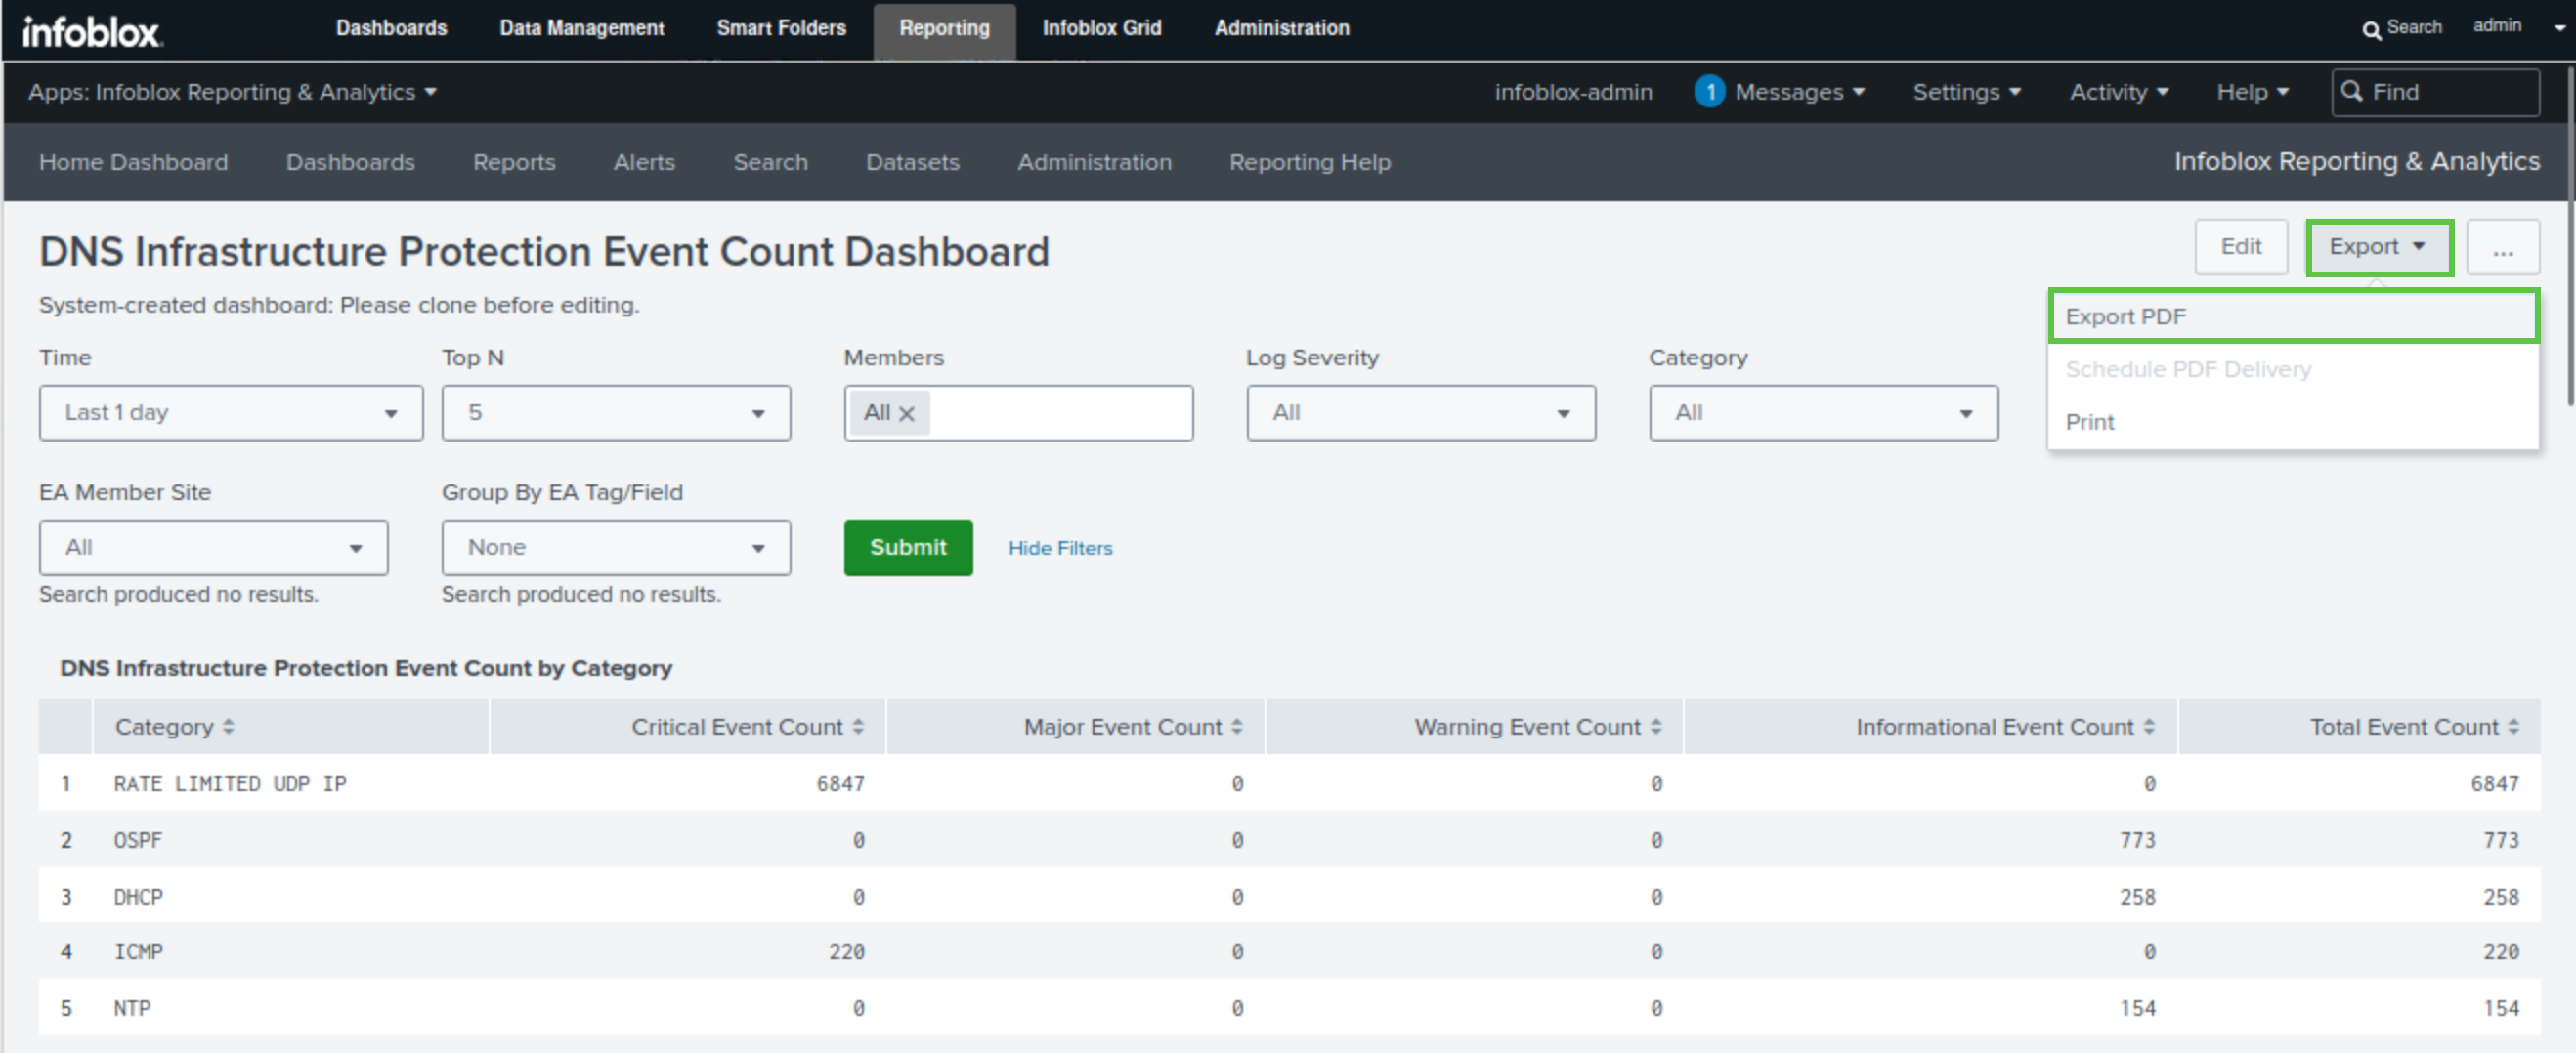
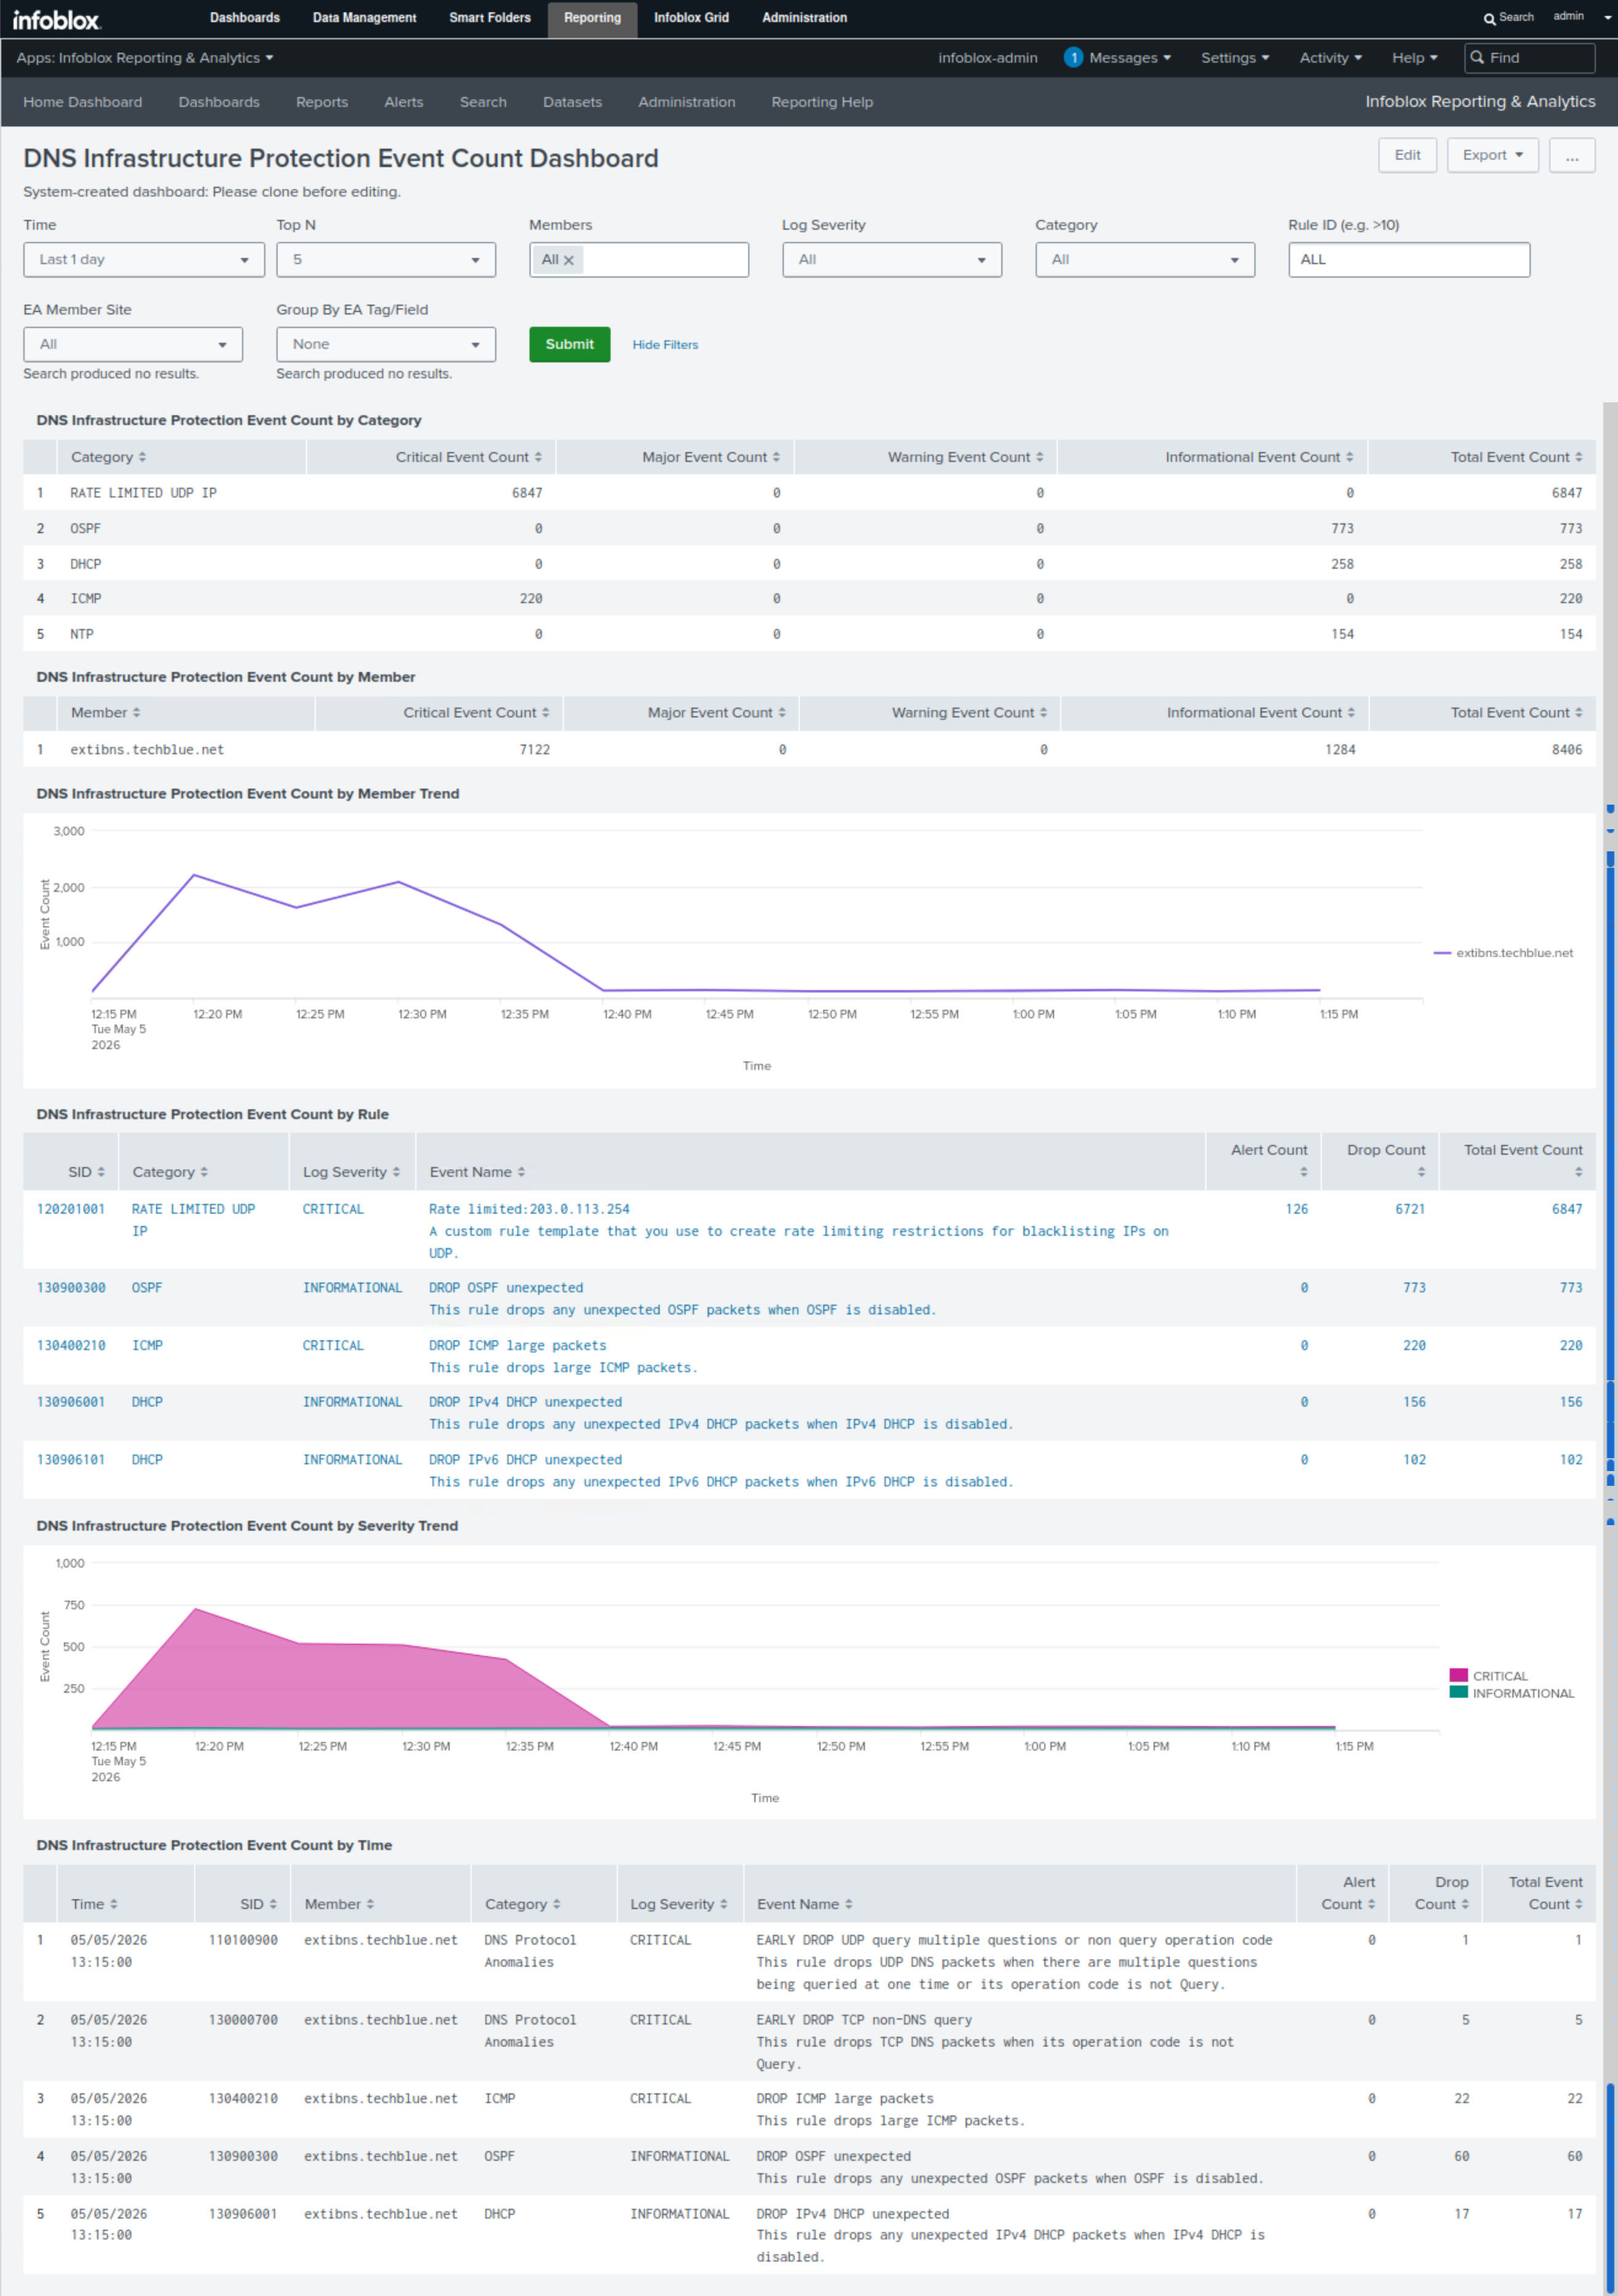
This dashboard consolidates all gathered information on a single summarized page. It shows event count by category, affected members, event count by rule, and trend graphs of events per member and severity level. This dashboard is ideal for exporting and presenting as a summary to management.
-
-
Click on Export
-
Select Export as PDF